Srcci
- インディケータ
- Jorge Alejandro Agudelo Alvarez
- バージョン: 1.0
- アクティベーション: 20
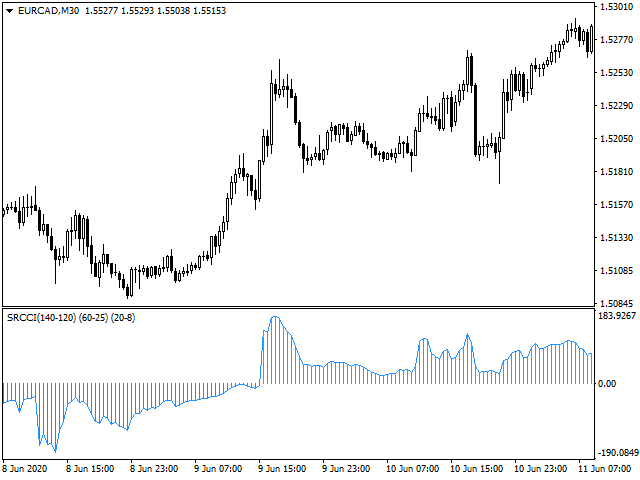
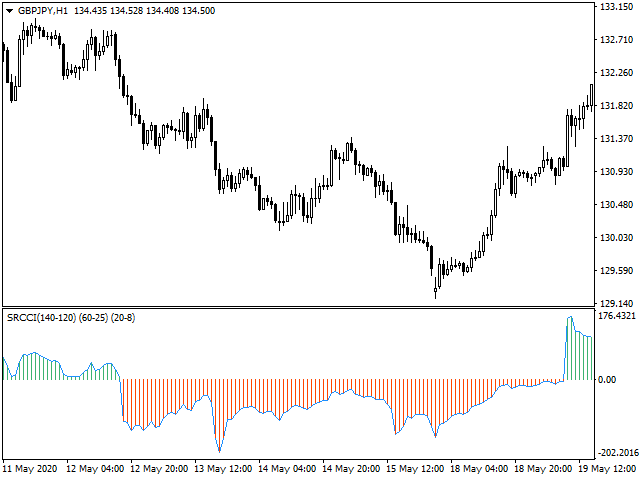
SRCCI
An indicator based on RCCI, is a combination of the RSI and CCI indicators, adapted into three levels categorized into A, B and C. Taking advantage of their combination to maintain a controlled filter and applicable to different strategies.
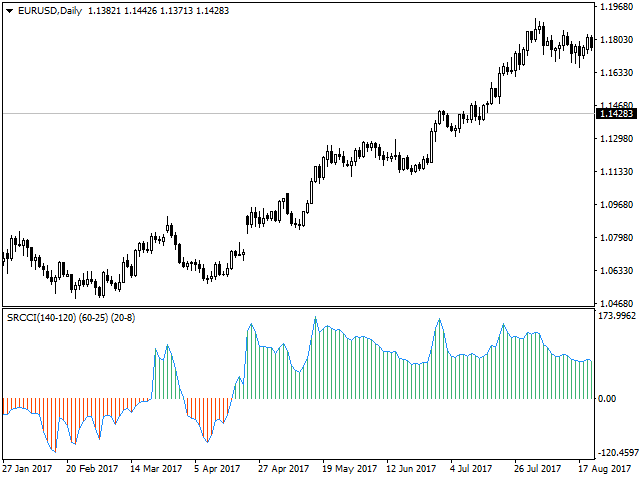
The RSI (Relative Strength Index) is one of the most popular and used oscillators to operate in the markets. It is a valuable tool to measure both the speed of price changes and the possible levels of overbought or overbought.
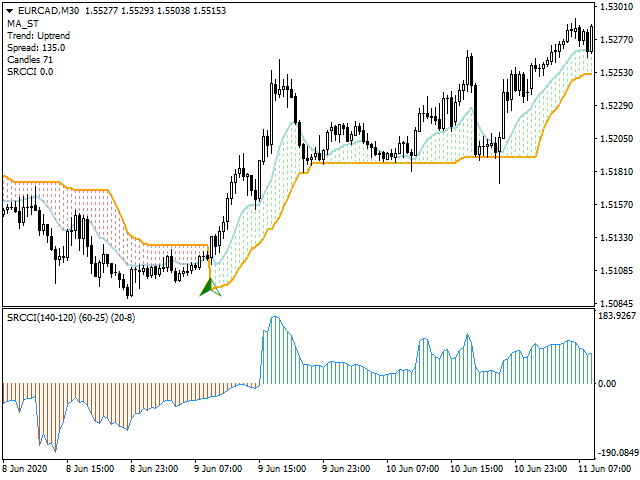
The CCI (Commodity Channel Index) indicator was developed by Donald Lambert. It is a versatile indicator that can be used both to identify a new trend and to detect extreme market conditions (over-purchase and over-sale), taking advantage of the calculations obtained in order to logically distribute a series of channels that accompany the price during its route, thus facilitating trade areas with a calculated risk and objective.
With great adaptability in any type of financial asset and with the potential of visual simplification in the graph, which will make the graph a simple work table.
A custom built indicator:
- For MT4 desktop platform.
- Great for Day trading, Swing Trading and Scalping.
- Work at any time and in any pair.
- Perfect tool for new operators and experienced operators.
- Simple parameter configuration.
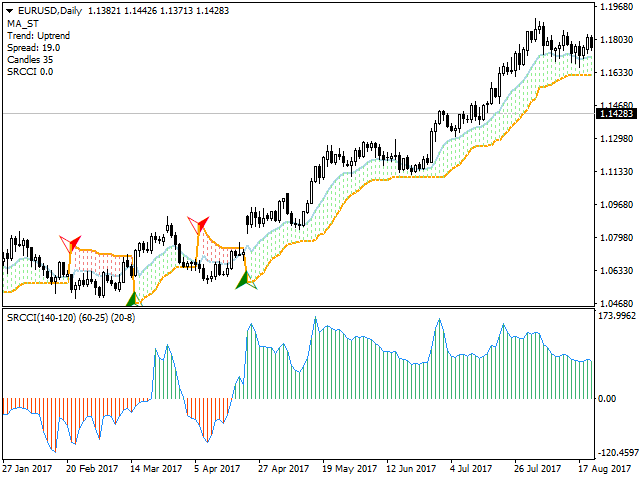
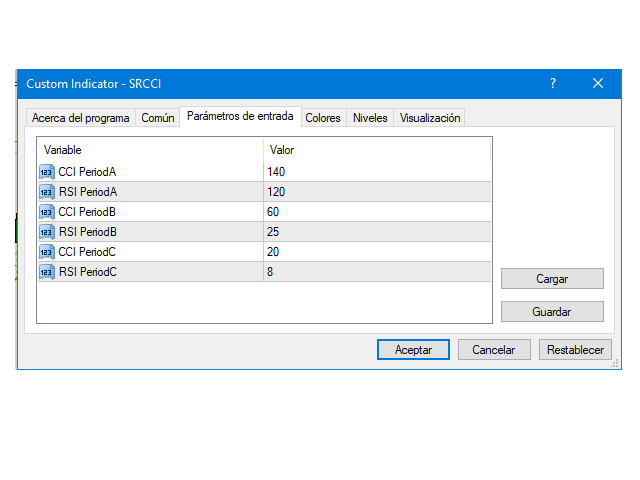
Input parameters:
Period A: number of candles needed to average, on the largest scale.
Period B: number of candles needed to perform the average, on the intermediate scale.
Period C: number of candles needed to average, on the smallest scale.