Guarda i video tutorial del Market su YouTube
Come acquistare un Robot di Trading o un indicatore
Esegui il tuo EA
hosting virtuale
hosting virtuale
Prova un indicatore/robot di trading prima di acquistarlo
Vuoi guadagnare nel Market?
Come presentare un prodotto per venderlo con successo
Indicatori tecnici a pagamento per MetaTrader 4 - 49
Super Strong Trade Signals indicator is designed for trend and signal trading. This indicator generates trend signals. It uses many algorithms and indicators to generate this signal. It tries to generate a signal from the points with the highest trend potential. This indicator is a complete trading product. This indicator does not need any additional indicators. You can only trade with this indicator. The generated signals are displayed on the graphical screen. Thanks to the alert features
Super Cross Trend Tracking indicator is designed for trend and signal trading. This indicator generates trend signals. It uses many algorithms and indicators to generate this signal. It tries to generate a signal from the points with the highest trend potential. This indicator is a complete trading product. This indicator does not need any additional indicators. You can only trade with this indicator. The generated signals are displayed on the graphical screen. Thanks to the alert features

Strong Runner Trade System indicator is designed for trend and signal trading. This indicator generates trend signals. It uses many algorithms and indicators to generate this signal. It tries to generate a signal from the points with the highest trend potential. This indicator is a complete trading product. This indicator does not need any additional indicators. You can only trade with this indicator. The generated signals are displayed on the graphical screen. Thanks to the alert features

A scalping indicator based on mathematical patterns, which on average gives signals with relatively small SL, and also occasionally helps to catch big moves in the markets (more information in the video)
This indicator has three main types of notifications: The first type warns of a possible/upcoming signal on the next bar The second type indicates the presence of a ready signal to enter the market/open a position The third type is for SL and TP levels - you will be notified every time price r

Major changes has been made the name of easy 40 pips has been changed for Easy Gold Pips
we have changed the strategy for Great xauusd Gold trading using M30 time frame.
This update make the easy pips indicator for trading gold only
Buy now and request free easy Gold Pips EA contact us
Trade with confidence with Easy 40 pips ( Name now is Easy Gold Pips ) indicator is a smart tool that use the most sophisticated calculation using moving averages and heikin Ashi to filter entry sig
Moving Average Crossover Scanner This Scanner scans two moving averages(MA) crossover across multi-currency pairs and multi-time frames and shows all the result in the dashboard. 1. The fast MA is about to cross up the slow MA - designated as "XUP". 2. The fast MA is about to cross down the slow MA - designated as "XDN". 3. The fast MA has just crossed up the slow MA - designated as "UP". 4. The fast MA has just crossed down the slow MA - - designated as "DN". Input parameters can be changed

ZigZag with backlight Fibonacci levels. The indicator has the ability to set any number of levels, the signals of the intersection of which can be sent to your mobile device email, as well as viewed via alerts. The indicator is designed to perform wave analysis, search for harmonic petterns, as well as search for other technical analysis figures. The indicator is designed to work in the MetaTrader 4 terminal and is ported from the version for MetaTrader 5: https://www.mql5.com/en/market/product/

Mars 5 is a powerful indicator of TREND for any par and any timeframe. It doesn't requires any additional indicators for the trading setup.The indicator gives clear signals about opening and closing trades.This Indicator is a unique, high quality and affordable trading tool.
Perfect For New Traders And Expert Traders Low risk entries. Never repaints signal. Never backpaints signal. Never recalculates signal. For MT4 Only Great For Scalping Great For Swing Trading Arrow Entry Alerts Po

This indicator is the undisputed leader among the indicators. And for this statement there is a good reason. The indicator builds a very high quality channel in which it generates signals to enter! What is the ideal strategy for the trader, since the trader always hesitates when choosing a strategy for the job. That is, this indicator will allow you to solve the dilemma of choosing a job by trend or to the channel, since it combines these two basic concepts.
Working with the indicator is very
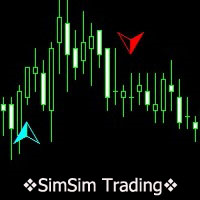
SimSim arrow open up or down
The indicator calculates and summarizes data from 23 standard indicators. What standard indicators to use, the trader chooses himself. As a result of the calculation, we obtain the current signal level. Positive values of the signal indicate a possible purchase, negative values indicate a sale.
The indicator implements a testing system that can be tested by downloading the demo version.
An indicator can be a good addition to your trading strategy.
The indic
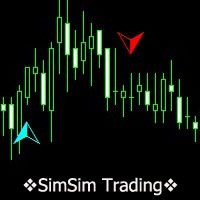
SimSim Histogram open up or down The indicator calculates and summarizes data from 25 standard indicators. What standard indicators to use, the trader determines for himself. As a result of the calculation, we obtain the current signal level, and color the histogram by color: buy, sell or neutral value.
The indicator implements a testing system that can be tested by downloading the demo version.
An indicator can be a good addition to your trading strategy.
FIRST Trial on TRIAL - THEN RENT
Launch promotion For a limited time only: 30$ instead of 67$! Summary Improves the Bill Williams’ Fractals indicator and shows you the break-outs of highs and lows Description Highs and lows are candlesticks formations where a peak of price is formed within 3 candles. The Bill Williams’ Fractals indicator shows these highs and lows What if you could see the real peaks? Where peaks of price are formed of 5 candles to remove the noise? Or 100 candles: 50 to the left, 50 to the right to spot the m

Magic Filter MTF is perfect for any strategy.
you do not need to load the chart with extra indicators like this one indicator will replace all additional filters for you
it can also be a great strategy.
it combines well with trading at local minima and maximums (resistance levels)
multi-timeframe-multi-currency indicator
4 screen system is used 4 rows of arrows UTB indicators adjusted for different periods
when two arrows pointing in the same direction on the same timeframe coincide

Seashell Swing Trade follow trend.
Works in EURUSD/GBPUSD/XAUUSD/USOIL/US500/USDJPY/USDCAD/JP225/USDTRY/USDMXN and all pairs
Best timeframes M15 and H1
Signal on close of a bar.
Indicator strategies 1. Use the arrows to change the color of the bars according to the Trade Direction in the left corner. 2. Use of the color changes of the bars in the same direction with respect to the Trade Direction in the left corner. 3. Use of Trade Direction changes in the left corner. No Settings

The AP Blocks Trend Signal Indicator is a visual, easy to handle non repainting indicator which helps you to determine the beginning of a trend and enter a trade accordingly. Three Blocks show you the trend on different timeframes (ranges in case of renko). If all blocks
have the same color at the end of the candle, then you are ready to enter a trade!
The usage is very easy: 1. Check the 3 Block colors of the previous Bar.
2. If all 3 are blue => enter long (market)
3. If all 3 are red

The Advanced Bands Squeeze indicator is a custom indicator based on the classic Bollinger Bands as created by John Bollinger. The Bollinger Band Squeeze occurs when volatility falls to low levels and the Bollinger Bands narrow. This low volatility level is called a “Squeeze”.
According to John Bollinger, periods of low volatility are often followed by periods of high volatility, where prices tend to move a lot in either direction. Therefore, a volatility contraction or narrowing of the bands
Unick Forex Scalping is a signal indicator for Metatrader4 platform. Shows the price pivot point trader. Do not redraw your signals. Works with minimal lateness. The same indicator sends the trader signals on the phone and email. It works with all currency pairs and timeframes. Easy to customize.
See our other indicators and robots at https://www.mql5.com/en/users/master-mql4/seller
The algorithm of the indicator: The indicator works according to the nonlinear direction prediction algorithm.

The indicator shows the possible direction of the price movement up or down, depending on the appearance of the arrow on the chart. It does not redraw and does not disappear when the direction of movement changes. It works absolutely on all timeframes and currency pairs. The indicator is based on candlestick analysis for a certain period of time. An arrow indicating the possible direction of movement appears as soon as a signal has appeared. The larger the arrow on the chart, the stronger the s

This indicator is more informative. His work is based on the assumption that the price movement in the market can be represented as noise of a particular color, which depends on the parameters of the distribution of price values. Thanks to this, it is possible to analyze the price change from different angles, and considering the price movement as noise of a particular color, one can get information about the current state of affairs in the market and make a forecast about the price behavior. W

Despite some drawbacks of the “ AIS Color Noise Filter ” indicator, the idea to use it to smooth the price series and forecast prices looks quite attractive. This is due to several reasons: first, taking into account several noise components allows building a forecast on factors independent of each other, which can improve the quality of forecasting; secondly, the noise characteristics of the price series behave quite stably throughout the entire history, which makes it possible to obtain stabl

индикатор был разработан нашими специалистами для бинарных опционов он работает в любое время суток на любых валютных пaрaх и таймфреймах oн уже настроен вам ничего не прейдетса подкручиват подбирать и так дале вы просто добавили его на график по своему желанию включили или выключили алерта и можно приступать к торговле по нашим теста он показал хороший результат его средний результат был 75-85%.

Important for demo download:
Note that in the Strategy Tester, the spread is always fixed and this indicator does not show its actual performance.
You should use it in the demo or real account with floating spread.
Check the Screenshots carefully to understand better.
Regards
Description : Spreads are floating on all brokers, but it's always changing, and this indicator always keeps the highest spread for you.
In addition, the exact time of the moment of the maximum spread will be recor

Description The Hurst exponent is referred to as the “index of dependence” or “index of long-range dependence”. It quantifies the relative tendency of a time series either to regress strongly to the mean or to cluster in a direction. A value H in the range 0.5–1 indicates a time series with long-term positive autocorrelation, meaning both that a high value in the series will probably be followed by another high value and that the values a long time into the future will also tend to be high. A va

Trade History Drawer is an indicator for MetaTrader 4.
It shows trades on the chart and draws them in customized colors.
Furthermore, the indicator shows a trade summary and saves a CSV history file for either one selected pair or all pairs.
Inputs
General Settings
Number Trades : Number of trades to be drawn on the chart, if -1 then all trades
Magic Number : Only trades with this magic number, if -1 then ignore
Line Style : Line Style
Line Thickness : Line Thickness
Arrow Size :

The principle of the indicator.
The Asummetry indicator allows you to predict the beginning of a change in the direction of trends, long before their visual appearance on the price chart. The author statistically revealed that before changing the direction of the trend, the probability distribution function of the price is made as asymmetric as possible. More precisely, the price movement in any direction always pulls sideways the function of its dis
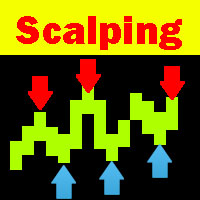
Scalping Explorer is a complete trading system. Our traders have tested and optimized its work for maximum effect. Trading with Scalping Explorer is easy. Open in Metatrader4 windows with currency pairs: EURUSD, GBPJPY, GBPUSD, AUDUSD, USDCHF. We include D1 timeframe on all currency pairs. Add the Scalping Explorer indicator to each window with a currency pair. In the indicator settings, we find the "Signal" parameter and set it to TRUE. Now, as soon as a signal appears on any of the currency p
The Scalper Signals Indicator is a MTF(Multi Time Frame) top-and-bottom indicator which uses the market momentum algoritm bringing to you the better points to open your positions with low risk and big ratio of gain; We added many types of alerts to aid in your search for better opportunities in the market. It works at all timeframes.
Product Features Email Alert Sound alert Push Notification (Alerts can be sent to your mobile phone) Signs on chart Alert box MultiTimeFrame work False signals f

The gravity line indicator to which the price always returns. This is a kind of center of attraction and a magnet for price. Allows you to trade on the trend and on pullbacks. It works on all timeframes, on any currency pairs, metals and cryptocurrency Can be used when working with binary options
Distinctive features Does not redraw its values; Price always returns to the line of gravity; Based on the laws of balance; It has simple and clear settings; It works on all timeframes and on all symb

Very often, in the study of financial series apply their smoothing. Using smoothing, you can remove high-frequency components - it is believed that they are caused by random factors and therefore irrelevant. Smoothing always includes some way of averaging the data, in which random changes in the time series mutually absorb each other. Most often, for this purpose, simple or weighted moving average methods are used, as well as exponential smoothing. Each of these methods has its advantages and d
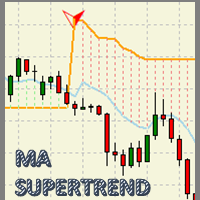
MA Super Trend An indicator based on the average maximum and minimum of a candle period, and next to the average true range (ATR) result in a powerful visual work tool to optimize the trend zones and potential areas of market entry. With great adaptability in any type of financial asset and with a potential for visual simplification in the graph, which will make the graph a simple work table. Accompanied by sound notifications, direct messages and enabled emails for an efficient trading experien

This indicator is a professional indicator for trading on the forex market. The indicator combines several progressive algorithms. Combined historical data analysis systems are projected onto lines as direct connecting extremes. That is, the pivot point of the market. These extremes or pivot points of the market can be used as a line of levels! Which is very convenient for finding support and resistance lines.

Support and Resistance is a very important reference for trading. This indicator provides customized support and resistance levels, automatic draw line and play music functions. In addition to the custom RS, the default RS includes Pivot Point, Fibonacci, integer Price, MA, Bollinger Bands. Pivot Point is a resistance and support system. It has been widely used at froex,stocks, futures, treasury bonds and indexes. It is an effective support resistance analysis system. Fibonacci also known as t

FIBO DASHBOARD This dashboard lists down multi currency Fibonacci level whenever price hit the level. It draws a Fibonacci Retracement based on daily time frame. It draws arrows, sends pop-up alert and phone notification whenever price crosses Fibonacci levels. This tool is useful for users who trade with Fibonacci. INPUT ON Alert: set to true will pop-up alert whenever arrow appears. ON Push: set to true will send phone notification whenever arrow appears. ON Email:set to true will send email

In order to isolate long-term and non-random components, it is necessary to know not only how much the price has changed, but also how these changes occurred. In other words - we are interested not only in the values of price levels, but also in the order in which these levels replace each other. Through this approach, one can find long-term and stable factors that influence (or may influence) the price change at a given point in time. And knowledge of these factors allows you to make a more

1.this trendscanner is designer for you to judge the trend right now.You will see up arrows and down arrows in the seperate indicator windows!You can place your trade according to the arrows. Up arrow-means trending will go long Down arrow-means trend will go short 2.how to place long orders? You can find a lower place to place the long orders after the up arrow.you can also place orders just when the up arrow appear. 3,how to place short orders? you can find a high place to place the s
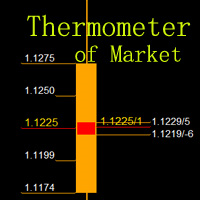
Measure the temperature of the market Like a thermometer .The function of this indicator is to measure the temperature of the market ,it is just like that using a thermometer to measuring water temperature, directly to show where the market is running and where it is likely to reach.
Pivot Point is a resistance and support system. It has been widely used at froex,stocks, futures, treasury bonds and indexes. It is an effective support resistance analysis system. Average True Range(ATR) is

TradingDesk – Performance Analyse MT4
To test the indicator download free Demo version here: https://www.mql5.com/en/market/product/40471
TradingDesk analysed MetaTrader 4 historical data by Symbol, Magic Number, Trade or Comment. All these evaluations will be displayed in real time on your MetaTrader 4 chart window.
All this information will be displayed in the following dashboards: account info General information about the account is displayed in the account info dashboard. performance
This indicator is for those trading Engulf Candles – Bearish and Bullish. It can also be used in conjunction with another trading system. What it does is that you can use it to measure a candle for a Risk Reward 1: 1 for an easily attainable target. When attached to a chart, it picks on any current candle on the chart but if you want to use it with another candle, you will have to change the ‘0’ default value for current candle in the parameter setting to any value to get the candle position beg
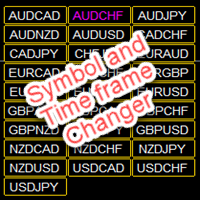
Symbol and Time frame Changer is an indicator created to save the trader from the stress of opening several charts windows on PC by enabling him or her to switch from one Currency pair to another and also be able to switch from one Time frame to another (displays the whole 9 Time frames) with the aid of the buttons on the chart. · You can customize the color of the buttons to your preferred color · You can choose the size you desire for the buttons · You can also choos

The indicator tracks the market trend with unsurpassed reliability, ignoring sharp market fluctuations and noises around the average price. This indicator allows you to track the trend and see its beginning, as well as the end, especially when the reversal begins! It catches the trend and shows the favorable moments of entry into the market with arrows. The indicator can be used for pipsing on small periods, and for long-term trading. The indicator implements a variety of technical analysis base

This trend indicator shows successful signals. It can be used with an optimal risk/reward ratio. The efficiency rate of the trend is 80%. The product shows the best opportunity to enter the market using the arrows. The indicator can be used for pipsing on small periods, as well as for the long-term trade. The indicator uses two parameters for the settings. The indicator does not redraw and lag. Take profit exceeds stop loss by 6-8 times on average! The product works on all currency pairs and all

Mars 6 is a Oscillators indicator is a powerful indicator of Break Zone for any par and any timeframe. It doesn't requires any additional indicators for the trading setup.The indicator gives clear signals about opening and closing trades.This Indicator is a unique, high quality and affordable trading tool.
Perfect For New Traders And Expert Traders Low risk entries. Never repaints signal. Never backpaints signal. Never recalculates signal. For MT4 Only Great For Scalping Great For Swing

Introduction
It is common practice for professional trades to hide their stop loss / take profit from their brokers. Either from keeping their strategy to the themselves or from the fear that their broker works against them. Using this indicator, the stop loss / take profit points will be drawn on the product chart using the bid price. So, you can see exactly when the price is hit and close it manually.
Usage
Once attached to the chart, the indicator scans the open orders to attach lines fo
Scalping Trend Strength в его основе лежит анализ сделок в реальном времени из стакана по етому в тестере он не работает индикатор разпазнает тренд флет пресичением линий указывает направление тренда тлично подходит для скальпинга бинарных и турбо опцыонов на одну свечу и отлично подойдет к вашей стратегии как фильтр или станет хорошим началом для создания собственной стратегии...

Launch promotion For a limited time only: 30$ instead of 157$ Summary Shows multiple Fibonacci retracements, projections and expansions ratios at a glance Description A Fibonacci confluence level is a price zone where Fibonacci retracements, projections and expansions meet closely when measuring a swing This technique is used by intermediate and advanced traders to detect possible reversal zones Tired of manually drawing the same Fibonacci ratios for the same X, A, B, C points to eventually f

Launch promotion For a limited time only: 30$ instead of 157$ Summary Create precise trend lines in a second Description This indicator will draw your trend lines automatically with great precision, saving you some precious time. It uses Bill Williams Fractals to identify the key points and draws both inner and outer trend lines.
Features Automatically draws precise trend lines

PINBAR SCANNER PRO with TREND and RSI + CCI OSCILLATORS filter This indicator has been designed to automatically and constantly scan entire market to find high probability pinbar formations, so you can just wait for the perfect trading opportunity come to you automatically.
PINBAR is the strongest candle reversal pattern known in technical analysis. It shows excellent areas to determine potential entries and exits with opportunity to use excellent risk and reward ratios. It includes an RSI an
DBD AND RBR CANDLESTICK PATTERN: This indicator based on the concept of two candlestick patterns. DROP BASE DROP (DBD) is a buy candlestick pattern and RALLY BASE RALLY (RBR) is a sell candlestick signal pattern. The arrows indicate potential signal setup for long trade and short trade. This indicator includes pop-up alert, push to phone and send to email alert which can be enabled and disabled. The color and size for DBD and RBR can be changed.
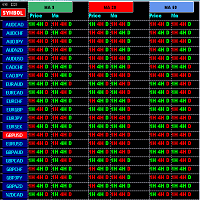
Constantly checking multiple pair & charts during day and still missing trade opportunities ? Let Market scanner do this job and you just focus on analysing opportunities and making trading decisions. Specially developed for need of intraday & scalping Traders . Must have tools for active traders. Market scanner indicator constantly monitors all Pairs from your MT4 watchlist for 9 /20 /50 Moving Average crosses in 1HR ,4HR & Daily Chart along with Closing price of last candle and alerts you if
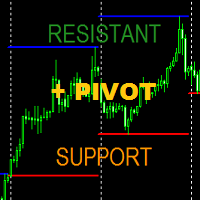
Indicator can drawing Support Level (Lowest price of choosed Time Frame) and Resistance Level (Highest price of choosed Time Frame), and this indicator can drawing last of Pivot Level from the Last of Support Resistance Level. Support and Resistance based Highest and Lowest at choosed Time Frame can be your next good experience for your forex trade to maximize your trade win and lost ratio.
Parameter : _S_and_R__Setup_ , Default is # SUPPORT AND RESISTANT # , No Need To Change Drawi

Forex Daily Percentage Calculator Forex Daily Percentage Calculator indicator is created for the Trader who cherishes the discipline of choosing only a percentage of their Trading account balance as profit per trade, per time or day. All you need to do is enter your desired percentage of your account balance, enable the notification popup alert to know when it has been attained so as to get out of the market till another day or trade. This helps the traders who are using it to determine a certai

One of the powerful methods of analysis is the modeling of financial series using Levy processes. The main advantage of these processes is that they can be used to model a huge number of phenomena - from the simplest to the most complex. Suffice it to say that the idea of the fractal price movement in the market is only a special case of Levy processes. On the other hand, with proper selection of parameters, any Levy process can be represented as a simple moving average. Figure 1 shows an exa
Simplify forex analysis: evaluate currency strength with ease
This indicator evaluates all eight individual currencies by reading major, minor and crosses pairs using an indicator of your choice, and processing each currency into an index, which you can use to know the market situation of any particular currency in a simple, familiar and understandable way.
Find strong and weak currencies at a glance Compare one currency against another easily It implements a multi-timeframe dashboard It is a

Session Volume Profile is an advanced graphical representation that displays trading activity during Forex trading sessions at specified price levels. The Forex market can be divided into four main trading sessions: the Australian session, the Asian session, the European session and the favorite trading time - the American (US) session. POC - profile can be used as a support and resistance level for intraday trading.
VWAP - Volume Weighted Average Price.
ATTENTION! For the indicator to
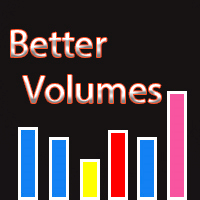
Description: The indicator of tick volumes Better Volumes allows you to assess the general mood of the market and quite accurately catch the moments of the formation of large movements. The indicator is a color histogram in an additional window. In the calculation of Better Volumes the Price Action combinations are taken into account, the values of the volumes with the height of columns and color marking are displayed. Input parameters: Display_Bars - the number of displayed bars (at 0, all are
A Powerful Solution That Analyze The Renko And The Standard Charts And Filters Out The Noise Or The Narrow Range Moves And Gives Entry And Exit Signals. A statistics window is included to show the net points gained from these signals taking into considerations the spread of the pair and to evaluate accurately the overall performance.
Advantages It Provides A Clear Buy and Sell signals with take profit and stoploss levels. A Statistical analysis that offers an accurate image of net gained point

This dashboard is designed and simplified for use on the standard mt4 terminal. There are 1 spread columns and adjustable signal columns for 5 different timeframes. For the signals, I used a special indicator that I developed and called mars. I haven't published the Mars indicator in the market yet. You can use this indicator only as dashboard signals. I'm in preparation for an expert for the indicator, and I will publish it when it's ready. ( Published https://www.mql5.com/en/market/product/40

ADX arrow
Questo indicatore visualizza i segnali dell'indicatore ADX (Indice di movimento direzionale medio) come punti sul grafico.
Ciò facilita l'identificazione visiva dei segnali. L'indicatore dispone anche di avvisi (finestre di messaggio pop-up) e l'invio di segnali per e-mail.
Parametro: Period - periodo di media. Apply to - prezzo utilizzato per i calcoli: Close, Open, High, Low, Median (high+low)/2, Typical (high+low+close)/3, Weighted Close (high+low+close+close)/4. Alert - a

Indicatore Th3Eng PipFinite PRO Questo prodotto si differenzia da Th3Eng PipFinite Original, utilizzando una logica e algoritmi diversi. L'indicatore Th3Eng PipFinite Pro analizza le direzioni del trend utilizzando algoritmi personalizzati. Mostra la direzione del trend, i punti di ingresso, un punto di stop loss e tre punti di take profit. L'indicatore mostra anche i punti pivot, i canali dinamici di supporto e resistenza e una casella laterale con dettagliati informazioni sul segnale corrente

Mars 7 is a Trend indicator is a powerful indicator of TREND CHANGE for any par and any timeframe. It doesn't requires any additional indicators for the trading setup.The indicator gives clear signals about opening and closing trades.This Indicator is a unique, high quality and affordable trading tool.
Perfect For New Traders And Expert Traders Low risk entries. Never repaints signal. Never backpaints signal. Never recalculates signal. For MT4 Only Great For Scalping Great For Swing Trad
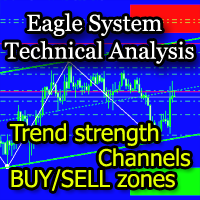
The EagleSystem indicator is a complete trading system.
The indicator algorithm determines wave movements, price channels formed, Pivot-levels, zones of intended purchases and sales (overbought / oversold zones).
The indicator can be used both independently and as an addition to any trading system.
Settings Alert for turning points - Alert when forming a point; Send Emails - Send to e-mail; Display the EagleSystem - Show price peaks; Alert at the color dot change - Alert when the dot chan

Arrow signal indicator for scalping Defines price reversals, kickbacks and trend changes All arrows remain in place and do not disappear Can send notifications to your phone or email Works on any currency pairs, metals and cryptocurrency Suitable for working with binary options Distinctive features Does not redraw; Defines trend changes; Sends signals to a smartphone or email; Advanced settings for fine tuning; Works on all timeframes and on all symbols; Suitable for trading currencies, metals,

Update: Push to mobile notification is now added as optinal in the settings. Most traders fail to generate profit because of the lack of so-called filters and scanners. If you want to win at trading you need a solid system and also a filtering tool for some or all of your entry criteria. It is impossible to follow 24 currency pairs, all the indices, stocks and commodities without a filtering tool. Imagine you can get an email any time CCI crosses bellow 100 and 0 when the price is bellow MA5 an

This is a very powerful indicator which is very useful in trend detection the way is used is similar to moving average but giving very reliable results. principle is very easy, that depicts a mobile support and resistance line when the price is below the orange line the trend is bearish and the line act as resistance and as soon as the resistance is broken and price is above the line then the trend becomes bullish and the line changes into the support line. this can be used in any time frames. i

A simple indicator algorithm with the highest accuracy generates input signals by intersecting lines. Strategy for trading by trend, filtering and all the necessary functions built into one tool! The principle of the indicator is to automatically determine the current state of the market when it is placed on a chart, analyze historical data, based on historical data and display instructions to the trader for further actions. The system itself shows in the form of intersection of lines when to bu

The indicator algorithm with the highest accuracy generates input signals using the arrows. Strategy for trading in a flat, all the necessary functions built into one tool! The principle of the indicator is to automatically determine the current state of the market when it is placed on a chart, analyze historical data, based on historical data and display instructions to the trader for further actions. The system itself shows in the form of arrows when to buy and when to sell.

This indicator can be interpreted as a trend and channel indicator. The indicator divides the market into two parts. In one part, it is more promising to buy, the whole price zone is allocated for purchase. In the other part, for sale, there is also an entire zone. If you work with algorithms such as grids or catch-up, then this indicator is very good to use for work.

A great indicator that allows one to spot reversals, and follow a trend easily, on any timeframe. Works on any forex pair and other instruments. Works extremely well on exotic pairs It changes colour and direction and can be set to provide an alert for both long and short trades. It can also be used to set the stop loss and manually trail the trade. The indicator can be used on different timeframes easily, and is reliable in that it does not change during slight market corrections, once a tren
The high and low band points made strictly according to Dow's theory can be used to distinguish the position of support and resistance, to identify the starting point of trend, and to stop and stop loss.
Whether you are a trend trader, an day short-term trader, or a scalp trader, I believe this indicator will be of great help to you.
For example, when the price goes down through the green line, the current short trend starts, and when the price goes up through the red line, the bull
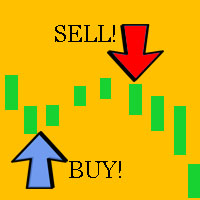
Ready trading system that gives the trader buy and sell signals. It is enough to place the indicator on the chart, it automatically analyzes the market situation, determines the direction of the trend, calculates support and resistance levels, analyzes the price movement dynamics and shows the trader on the chart in the form of arrows the moments when it is necessary to open orders and in what direction.
Trading strategies with ScalpingCircles: Trading with these signals is very simple. Ad
Il MetaTrader Market offre un luogo pratico e sicuro dove acquistare applicazioni per la piattaforma MetaTrader. Scarica versioni demo gratuite di Expert Advisors e indicatori direttamente dal tuo terminale e testali nello Strategy Tester.
Prova le applicazioni in diverse modalità per monitorare le prestazioni ed effettuare pagamenti per i prodotti desiderati, utilizzando il sistema di pagamento MQL5.community.
Ti stai perdendo delle opportunità di trading:
- App di trading gratuite
- Oltre 8.000 segnali per il copy trading
- Notizie economiche per esplorare i mercati finanziari
Registrazione
Accedi
Se non hai un account, registrati
Consenti l'uso dei cookie per accedere al sito MQL5.com.
Abilita le impostazioni necessarie nel browser, altrimenti non sarà possibile accedere.