YouTubeにあるマーケットチュートリアルビデオをご覧ください
ロボットや指標を購入する
仮想ホスティングで
EAを実行
EAを実行
ロボットや指標を購入前にテストする
マーケットで収入を得る
販売のためにプロダクトをプレゼンテーションする方法
MetaTrader 4のための有料のテクニカル指標 - 41

Range Volume Profile The indicator Range Volume Profile shows the distribution of transactions on the price scale in a given time range. This tool simplifies the analysis of the market situation and helps to find the price levels where a large player is sitting. Features: shows the distribution of tick volumes relative to the price. shows the distribution of real volumes relative to the price. If your broker provides them. you can select the part of the chart that you want to explore. for cert

The Sensitive Volume indicator is an indicator designed to generate trading signals. The purpose of this indicator is to generate signals from the highest probability of trading. Using a number of price movements and a set of indicator properties to generate these signals.
Easy to use, simple and understandable to the user. With alert features, user signals can be reached quickly. Visually the user can easily recognize the signals. This indicator will not repaint. Parameters Trend_Period - p
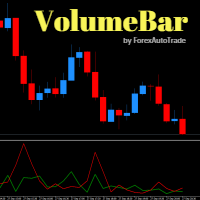
VolumeBar Hola Traders. This indicator will show line graph of each bar's volume. Indicates the volume of purchases and sales of each bar's volume. You can use this indicator with every currency pairs and every time frame. The display parameters are color customizable.
Original Parameters: ColorGreen - buy volume. ColorRed - sell volume.
Thanks Traders
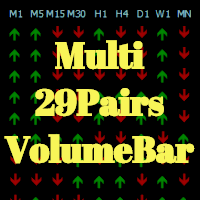
Hola Traders. This indicator Developed from VolumeBar indicator. By the signal show from the last bar complete. Show 9 time frame and 29 pairs currency. XAU,USD,EUR,GBP,AUD,NZD,CAD,CHF,JPY
The display parameters are color customizable. Original Parameters: ColorGreen - buy signal. ColorRed - sell signal. Font29PairsColor - color of font 29 pairs currency.
Thanks Traders

Oscillator Trend indicator macd, divergence and a set of algorithms is a trend indicator. The aim of the indicator is to generate signals with high reliability using the above-mentioned calculations.
The indicator is very easy to use. Red arrows give sale signal. The Aqua arrows give a buy signal. Thanks to the alert feature, you can easily reach the signals. It works without any setting. It can be used in all time frames. The recommended time frames are m15, m30 and h1.
Parameters Trendline

The MESA Spectrum indicator calculates the power spectrum of a data series using the Maximum Entropy Spectrum Estimation method and produces a power spectrum plot. The Maximum Entropy algorithm, unlike a simple FFT transform, will include frequencies from the entire complex frequency plane and not just the Nyquist interval which, in general terms, means that it can resolve cycle periods that are larger than the data window passed to the function. In addition, MESA has the ability to fit very sha

Version 1.05 - added option to use mouse to set the Data Offset (anchor). Just hold down your SHIFT key, then double-click anywhere on the chart, then release the SHIFT key and the anchor will be set to the bar nearest to your double-click.
Version 1.04 - added fix for demo mode (i.e., operation in Strategy Tester). Use Open Prices Only and check Use Date (select a date range)
The MESA Cycles indicator calculates the power spectrum of a data series using the Maximum Entropy Spectrum Estimation

The Trend Confirm indicator is a set of indicators and a set of channel movements. The purpose of the indicator is to find a healthy trend and designed to confirm these trends. There are two channels in the trend. The blue channel line is used to confirm the ascending trend. The green trend line is used to confirm the downtrend.
How to use? If the trend line in the indicator goes above the blue channel line, the trend is starting to rise. If the trend line within the indicator falls below the

The CCI Standard/Hidden Divergence indicator will plot the Commodity Channel Index (CCI), and will also identify and plot standard (regular) divergences between the indicator and the price action, OR it can be set to identify and plot hidden (reverse) divergences between the indicator and the price action. The divergences themselves are implemented as lines (default green for bullish divergence and red for bearish divergence) drawn in the indicator pane. If activated via the Inputs dialog, alert

BeST_Visual MAs Signal Generator MT4 Indicator is a very useful Visual Tool that can display in the Chart all ENTRY signals (BUY and SELL) and also any corresponding EXIT signal, based on a total of 12, common but also different trading strategies, in which the Entry and Exit Signals are derived exclusively by using Moving Averages (MAs). The two main groups of MAs Strategies included in this tool are: A) Crossover Signals This group includes 4 different strategies (A1-A4), where Entry and Exi
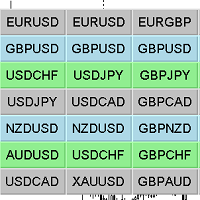
Chart Changer 金融商品を高速でナビゲートするためのインジケーター。ボタンをクリックすると、ボタンに名前が書かれている金融商品のチャートに遷移します。
言い換えれば、インジケーターは既存のチャートウィンドウを開くか展開します。そのようなチャートがない場合、インジケーターはこの端末のマーケットウォッチに存在する場合にそれを開きます。
チャートごとに、金融商品の名前、テキストの色、背景色をカスタマイズできます。合計で42個のボタンをカスタマイズできます。 インジケーターは、切り替える必要のあるすべてのチャートにインストールする必要があります。
設定の説明 Pair_x_x-金融商品の名前 colorFont_x_x-背景色 colorText_x_x-テキストの色 幅-ボタンの幅 高さ-ボタンの高さ Font_Size-フォントサイズ、文字の高さ コーナー-固定するグラフのコーナー border_color-ボタンの境界線の色 string _font-フォント、名前。例:Arial Black、Georgia、Impact、Segoe Print、Comic S

The arrows are calculated with: - 2 Parabolic parameters - 2 ADX parameters - 4 Stochastic parameters
We recommend to combine it with Parabolic, ZigZag or Elliot waves indicator. Always trade the trend!
If you make sure to draw your trend lines and support/resistance zones you will just have to wait for the signal to appear. Take the trade. For Binary Options it is advisable to set the expiry time to 5-15 min in M1 chart. THIS INDICATOR IS ZERO REPAINT
Best assets to trade: -

This indicator displays super power trend movement. Features Multiplier - displays multiplier movement.
Multiplier2 - displays multiplier2 movement. Trend - displays indicator trend 1 and trend 2 (true/false). separate_windor - displays trend separate window.(0-1....)
X - move the trend left and right.
Y - move the trend up and down. How to understand the status: If the Trend color is green, trend is up. If the Trend color is red, trend is down.

Pips collector - this indicator is a complete mechanical trading system. Pips collector itself analyzes the market for 57 characteristics, determining the direction of the trend, volatility, aggressiveness, resistance and support. After this, the Pips collector displays the signals for opening buy or sell orders. Interpretation of trading with Pips collector is very simple and suitable for both professional traders and beginners. Also, the Pips collector indicator can send signals to the trader

The MACD Standard/Hidden Divergence indicator will plot the MACD, and will also identify and plot standard (regular) divergences between the indicator and the price action, OR it can be set to identify and plot hidden (reverse) divergences between the indicator and the price action. The divergences themselves are implemented as lines (default green for bullish divergence and red for bearish divergence) drawn in the indicator pane. If activated via the Inputs dialog, alerts will be generated when

The RSI Standard/Hidden Divergence indicator will plot the Relative Strength Index (RSI), and will also identify and plot standard (regular) divergences between the indicator and the price action, OR it can be set to identify and plot hidden (reverse) divergences between the indicator and the price action. The divergences themselves are implemented as lines (default green for bullish divergence and red for bearish divergence) drawn in the indicator pane. If activated via the Inputs dialog, alert

The Momentum Standard/Hidden Divergence indicator will plot the momentum, and will also identify and plot standard (regular) divergences between the indicator and the price action, OR it can be set to identify and plot hidden (reverse) divergences between the indicator and the price action. The divergences themselves are implemented as lines (default green for bullish divergence and red for bearish divergence) drawn in the indicator pane. If activated via the Inputs dialog, alerts will be genera

The Stochastic Standard/Hidden Divergence indicator will plot the stochastic (%K and %D), and will also identify and plot standard (regular) divergences between the indicator and the price action, OR it can be set to identify and plot hidden (reverse) divergences between the indicator and the price action. The divergences themselves are implemented as lines (default green for bullish divergence and red for bearish divergence) drawn in the indicator pane. If activated via the Inputs dialog, alert

Ultimate solution on price action trade system Built Inside One Tool! Our smart algorithm tool will detect the price action pattern and alert upon potential with entry signals and exit levels including stoploss and takeprofit levels based on the time setting on each market session. This tool will also filters out market currency strength to ensure our entry are in a good currency conditions based on it's trend.
Benefit You Get
Easy, visual and effective price action detection. Gives you th
The ' MTF MA Cross ADV ' indicator comes from MTF Moving Average Cross with an advanced algorithm . Fast & slow m oving average crosses are used for generating up to four arrows either at bar 0 or bar 1.
Key Features Advanced algorithm to detect changes in standard moving average cross w/arrows. There are many settings which can all be non-repaint for signals at a new bar and at bar 0. NewBarConfirm as 'true' means notifications come from bar 0 & bar 1(false). Audible Alerts, e-mail no

This indicator displays Super Power Beeta trend movement.Indicator is version 2 . Features Multiplier - displays multiplier movement. Multiplier2 - displays multiplier2 movement. Trend - displays indicator trend 1 and trend 2 (true/false).
Background:color - displays background color (true/false).
separate_window - displays trend separate window.(0-1....) separate_window2 - displays trend (background color )separate window.(1-2....) X - move the trend left and right.
Y - move the trend up

Let´s try to make some real money!
Call me profit addicted. I thought why not try to make THE dream come reality. With discipline, a clear strategy and this indicator I focus on entering the perfect trades. This indicator is very easy to use as you will get perfect entry points for Put or Call trades.
The arrows are calculated with: - Momentum parameters - Candle stick patterns - Fundamental Price action
We recommend to combine it with Parabolic, ZigZag or Elliot waves indic

フィボナッチリトレースと拡張ラインツール
DiNapoliポイント取引方法とゴールデンセクション取引を使用するトレーダーにとって理想的なMT4プラットフォームのフィボナッチリトレースと拡張ラインツール
主な特長:
あなたはフィボナッチリトレースメントの複数のセットを直接描くことができ、重要なリターンポイント間の関係は一目瞭然です。
2.フィボナッチ拡張を描画することができます。
3.フィボナッチフォールドバックとラインの延長は、簡単な観察と数値表示のために左右に動かすことができます。
4.チャートは非常に爽やかな
5.数字キーでサイクルを切り替えることができます。
ファンクションキー:
1。 [戻るを押す、要求に応じて描画する、最大8つのグループにする
2。拡張]を描くには[押す]
3。 \を押すと、現在のサイクルの下にあるすべての拡張機能と折り畳みが削除されます
4。フォールドバックを移動して削除して展開する
(1)最初のフォールドバックセットのF5行をクリックします。
一度クリックすると(黄色に変わります)、キーボードのDel

Extended VERSION
Ultimate solution on price action trade system Built Inside One Tool! Our smart algorithm tool will detect the price action pattern and alert upon potential with entry signals and exit levels including stoploss and takeprofit levels based on dynamic and unique calculation. This tool will also filters out market currency strength to ensure our entry are in a good currency conditions based on it's trend.
Benefit You Get
Easy, visual and effective price action detection. Gi
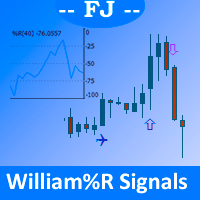
It draws on the main price chart icons indicating clearly the different crosses produced by the William% R oscillator signal as it passes through the overbought, oversold, and intermediate lines.
Allowed customization: - Position of overbought/oversold lines - Your prefered icons - The color of each icon - Periods to use in William% R
Parameters: - WilliSignalsOn_Off: It allows you to hide/show the indicator without having to delete / re-add and configure this indicator - WilliPeriods: Perio

This indicator based on OBV. He is essentially trending , it can "feel" the trend change. The arrow-signal does not disappear and does not redraw after a bar closes. An order may be opened towards the arrow direction at the next bar after the signal appears. Using this indicator is intuitive. Once the first turquoise arrow appears, buying is preferred. Red – selling. I recommend using the indicator on the H1 timeframe. When the first hand of the opposite color appears and the hour bar clos

Description
The base of this indicator is an ZigZag algorithm based on ATR and Fibo retracement. The ZigZag can be drawn like a classic ZigZag or like Arrows or needn't be drawn at all. This indicator is not redrawing in sense that the ZigZag's last shoulder is formed right after the appropriate conditions occur on the market. The shoulder doesn't change its direction afterwards (can only continue). There are some other possibilities to show advanced information in this indicator: Auto Fibo on

Entry Point Dashboard Ultimate の導入は、6 通貨ペアの売買通知を提供するように設計された強力なテクニカル指標です。このインジケーターは、3 つの異なる時間枠にわたる 5 つの移動平均、CCI、RSI、ストキャスティクス、ビル ウィリアムズ、および出来高インジケーターを分析して、正確なシグナルを生成します。プロのトレーダーに無制限のカスタマイズオプションを提供し、経験と戦略に基づいてインジケーターを調整できます。 Entry Point Dashboard Ultimate は、モバイル デバイス、電子メール、音声付きポップアップ アラートを介してユーザーに信号を送信します。 インジケーターのメインシグナルは、異なるタイムフレームからのシグナルの組み合わせに基づいて決定されます。たとえば、M1、M5、および M15 がすべて売りシグナルを示している場合、メインシグナルは売りまたは強い売りとして分類されます。 幅広い機能を備えた Entry Point Dashboard Ultimate は、トレーダー向けの包括的なツールです。 6 つの人気のあるインジケ
Relative Trend Bias
The Relative Trend Bias indicator is a simple indicator that helps you identify the current directional movement bias of a financial instrument based on the number of bars specified. Helps you identify the current trend based on a bar period of your choice Shows you level "safety zones" for reversals Shows you when the trade bias changes while the indicator is active on the chart
Indicator is forward facing. It does not backdraw/backpaint but it can be tested on the indi
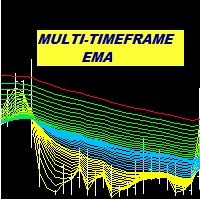
Multi Period EMA A trend indicator based on the exponential moving average. Keeping track of multiple EMA is a more effective way of detecting possible trend development. This indicator allows for the setting of as many as 6 different EMA periods. Unused period parameters can be set to zero to exclude the particular EMA from being displayed on the chart.
Features Up to 6 EMA displayed on chart. Option to select high EMA and Low EMA in order to detect crossovers Alert in event that change in s

About
Holy Renko is a trend identifier capable of identify small and long market movements. This indicator should be use in Renko Charts.
VIDEO (information and tips) [HERE]
How to install Renko Charts [HERE]
Features
Developed for Renko Charts Easy to analyze Fast signals Not repaint (when candle close) Statistics panel Filters false signals
Alerts, emails and push notifications
Advantages of Renko Chart Easy to install Easy to analyze Filter out the noise of wicks Easy ide
Данный индикатор отмечает участки разворота тренда, в точках разворота давая сигнал на вход в рынок в виде стрелок соответствующего цвета и направления движения в виде линий, а также звукового оповещения. Основан на закономерностях рынка FOREX, точных определениях текущего экстремума и нахождения свечных моделей на вершинах/низах рынка. Универсальный алгоритм помогает определить точки разворота указывая стрелками где осуществить вход в рынок. Дополнительно Индикатор не перерисовывается. Выводит

Dynamic Support and Resistance is the collective work of three traders with several decades worth of experience trading all financial markets. The math behind these levels is unlike anything ever produced in the public trading world. Dynamic S&R is a tool to measure ranging markets, trending markets, and aids in catching the turns of the trends when combined with Dynamic PriceWraps. Dynamic S&R can be used for spot FX, futures, stocks, and is incredibly useful in options trading for all produ

This indicator alerts you when/before new candle bar formed. In other words,this indicator alerts you every 1/5/30/60/240 minutes.
This indicator is especially useful for traders who trade when new bars formed.
*This indicator don't work propery in strategy tester.Use Free Version to check functionality in live trading.
Input Parameters Alert_Or_Sound =Sound ----- Choose alert or sound or both to notify you when new bar is coming.
Enable_1mBarAlert ----- Enable alert for 1 min bar
dif

The Pallada Manual System indicator is a complete manual trading system that does not require the use of any other indicators. Very simple and clear to use. Estimated profitability, depending on the setting, is 5-30%. The indicator is ideal for those who want to control the trading process, but do not sit at the monitor for days. Ideal for calm measured trading without nerves and stress.

Super Trend Lines is an indicator that calculates trends using a set of channels and using a set of algorithms. This indicator helps to find trend return points. It generally represents an oscillator. This trend tracking system helps the investor to understand small or large trends and determines the direction according to it.
Time frames: M15, M30, H1
Parameters Period : general trend period. Bar : bar calculation setting Channel_Cal : channel calculation period. The smaller the value here,

This cluster indicator is a next generation of CCFpExtraSuperMulti . It's improved in a way, which allows for processing mixed clusters, where symbols from various markets can be included. For example, it can handle Forex, indices, CFDs, spot at the same time. Number of visible lines increased to 16. An interactive ruler can be enabled to measure signals' strength on the history. The indicator creates a set of embedded cluster indicators (CCFpExtraIndices) with carefully selected periods and com

Strong Pivot trend indicator is a trend indicator that uses standard pivot calculation and some indicators. The purpose of the indicator is to calculate the possible trends using the pivot point. And to give the user an idea about trend direction.
You can use this indicator as a trend indicator. Or with other indicators suitable for your strategy.
Features The blue bar represents the upward trend. The yellow bar represents the downward trend. The blue pivot point represents the upward trend.

Always Strong indicator, an indicator that uses MacD and Bollinger bands. It is a coded indicator to find trends. It finds these trends by its own algorithm. This indicator requires visual monitoring. It does not give any warning because it needs visual follow-up. The main trendline should turn down to find the down trend. The main trend line should go under the white line and then go under the yellow line. The main trendline should turn upward to find the upward trend. The main trend line shoul

The algorithm of the indicator is based on the fact that the price is attracted to the slow moving average The same applies to a fast moving average that moves around a slow moving average These moving averages have a special smoothing algorithm. When the fast Moving average goes up and is below the slow Moving average, we have a potential signal to open a position-Buy entry When the fast Moving average goes down and is above the slow Moving average, we have a potential signal to open a positio
Signal Trend Arrows is an indicator designed to generate trading signals. This indicator uses a number of different indicators and generates a signal using a number of historical data. It generally tries to calculate the trend return points. These trend returns may be sometimes very large, sometimes small. The investor should act with the belief that the signal may be small. These signals vary according to market conditions. The signals do not repaint. Currency pairs: Any. Work with at least 20

Trend Waves indicator is a trend indicator that uses Average True Range and Standard Deviation indications. It is aimed to find more healthy trends with this indicator. This indicator can be used alone as a trend indicator.
Detailed review 4 different trend colors appear on this indicator. The aqua color represents the rising trend. Dark aqua color means the train is getting weaker. pink color represents the downtrend trend. The dark pink color means the trend is weaker. Parameters Stdeviati

Colored Trend Bars indicator is a trend indicator working with a set of algorithms and a set of indicators. Trend finds trends by using many factors while you are there. This indicator has 4 mode features. Mode 1 represents short-term trends. Mode 2 represents medium to short term trends. Mode 3 represents medium to long term trends. Mode 4 represents long term trends. Easy to use and simple indicator. The user can easily understand the trends. This indicator has 3 trend features. Up trend, down

Realization of trend movement indication with points for potential stops in the TrendCloud indicator. It can be easily used as an independent trading system. You can interpret this: the location of the course above or below the shadows show the presence of a trend. The transition to the shadow warns of a possible reversal. Entering the price inside the shadow speaks in a flat motion. The indicator tracks the market trend with unsurpassed reliability, ignoring sharp market fluctuations and noises
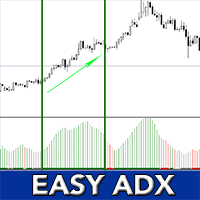
EASY AND SIMPLE STRATEGY - NON REPAINTING - HIGH TIMEFRAME FILTER - EASY TO BACKTEST
*For Desktop MT4 Only *Great For Scalping *Great For Swing Trading *Mobile Alerts, Desktop Alerts *Works On Any Timeframe *Works On Forex, Indices, Crypto *Perfect For New Traders And Expert Traders
We very often use Average Directional Movement Index (ADX) to identify a trend in forex. We use a simple rule: - If the indicator is above level 25, the market is in strong trend and we then study the values
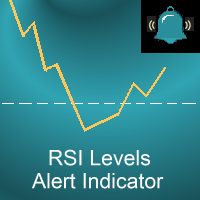
Our custom RSI indicator uses the standard RSI calculation, but it adds a few super-useful upgrades. In our opinion this is the RSI indicator that should come standard with MT4! Have a look and decide for yourself!
Our indicator has the following benefits:
Never miss another RSI set-up when you are away from your computer A colored RSI line makes it easy to see when price is overbought or oversold Get alerts when price moves into overbought/oversold, out of overbought/oversold, or both Custo
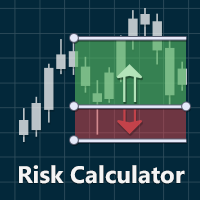
The Visual Risk Calculator is the indicator that allows calculating the risks, before placing an order.
Features:
- Calculation of potential profits and losses in points, interest and in the base currency, including the brokerage commission.
- calculation of the ratio of profit to potential loss.
- informing about the calculated levels of stop-loss and take-profit.
- the ability to drag the levels of entry into the market, stop-loss, and take-profit on the graph for preview before pl

フィボナッチ取引戦略に革命をもたらすように設計された強力なツールである、 フィボ チャネル アルティメット テクニカル インジケーターのご紹介です。高度な機能を備えたこのインジケーターは、過去のすべてのフィボナッチ チャネルをチャート上に自動的に描画し、時間と労力を節約します。 Fibo Channels Ultimate の特徴は、プロのトレーダーが望む任意のフィボナッチレベルを引き出すことを可能にする卓越したカスタマイズ機能です。このレベルの柔軟性により、インジケーターを独自の取引スタイルや好みに完全に合わせて調整できます。 Fibo Channels Ultimate で最新情報を入手し、取引機会を逃すことはありません。このインジケーターは、モバイルデバイスや電子メールに直接シグナルを送信し、価格がフィボナッチレベルに達するたびに音声通知を伴うポップアップアラートを表示します。アクティブ化/非アクティブ化機能を使用してアラートを完全に制御し、ニーズに応じて通知をカスタマイズできます。 私たちは、最も重要なフィボナッチレベルを含めることの重要性を理解しているため、フィボナッチレベル
A's Capital Line は、100%のトレンドを検出する複雑なアルゴリズムです。 この行は以下の情報をマークします。 トレンドへの入り口。 損失の停止 サポートと抵抗 いつ利益を取りますか。 メタトレーダーを介して携帯電話にアラートを送信する それはあらゆる証券(株、外国為替、暗号、商品、指数など)に完璧に働きます。また、あらゆる取引スタイルに合わせて調整することができます。 例についてはスクリーンショットをご覧くださいそしてinstagramで私たちに従ってください。 画像1 ライン設定はシンボルとタイムフレームごとに異なります。あなたはシンボル、時間枠、そしてあなたの取引スタイルに従って最適なパラメータを調整しなければなりません。 (10周期、4倍)(7周期、3倍)一般的な設定です。 ディスプレイを表示し、あなたは提供されたすべての情報をオン/オフにすることができます アラート&Movil通知、あなたはオン/オフPCとmovil通知をすることができます。 表示位置。表示を他の場所に配置します。 表示フォント、サイズ、色も変更できます。 画像2 これがすべての表示要素です。

Trade Trend indicator is an oscillator designed to calculate trend reversal points. A set of bar calculations and a set of algorithms to calculate trend reversals. Level probing system with high probability trends. All of these features combine to make it easier for investors to find trends.
Suggestions and Features There are two levels on the Trade Trend indicator. They are at levels of upper level and lower level. The oscillator bar should be below lower level to find the upward trend. And a
RSI Mtf
This is a multi-frame version of the standard indicator " Relative Strength Index ". Here, the same ideology is implemented, as in other indicators of the author, such as " Ma_Multi ", " CCI MTF ", " DeMarker Mtf ", " Force Multi ". Their common distinguishing feature is the observance of the correct time scale. In the indicator window you can create any set of timeframes, and the scale of each will always correspond to the scale of the current price chart. This way you can see the ov
WPR Mtf
This is a multi-frame version of the standard indicator " Williams Percent Range ". Like the other indicators of the author, it allows you to see any set of timeframes at the same time, and all they will be presented on a scale of the current price chart. You can choose any set of timeframes of the indicator and freely switch to the price chart in both the highter and the lower direction. For each price period, indicator charts will always be displayed at the correct scale. The indica
This indicator is an upgrade of traditional MACD on MT4. It can alert and push notificaton (if configured) when : - MACD line cross Signal Line -MACD line cross Zero -MACD cross Trend Line -MACD cross Horizontal Line It has two working mode: on ClosedCandle and on RunningCandle. With ClosedCandle mode, it only alert when a candle is closed. Trader only draw a line (trend line or horizontal line) on MACD indicator window and the indicator will automatically find that line and check if it is cros

このインジケータは、毎秒のティックの量をリアルタイムでカウントし、最後のバーの隣に表示します。
さらに、それは、2つの異なる信号で、各信号に割り当てられた特定のダニ量を示す。
このインジケータは、価格の特定の動きがマーケットから予想されるダニ量に対応するかどうかを検出するために特別です。
This indicator counts in real time the number of ticks per second and shows them next to each last bar.
In addition, it indicates with two different signals the determined quantities of ticks that we have assigned to each signal.
This indicator is special to detect if certain movements of the price correspond with the quantity of ticks that we
Индикатор ищет на графике уровни поддержки и сопротивления. Алгоритм устроен так, что при побитии уровней в обратном направлении и закреплением за уровнем индикатор показывает сигнал на покупку или продажу инструмента. Подтверждение сигнала обусловлено низким объемом. Хорошо себя показывает на коротких дистанциях. То есть идеально подходит для скальпинга. Лучшие таймфреймы это: M15, M30, H1. Валютные пары только - EURUSD, EURJPY, USDCHF, GOLD, USDJPY, GBPUSD, GBPJPY. На осталь
Super signals is an indicator that generates trade arrows. It generates trade arrows with its own algorithm. These arrows give buying and selling signals. The indicator certainly does not repaint. Can be used in all pairs. Sends a signal to the user with the alert feature.
Trade rules Enter the signal when the buy signal arrives. In order to exit from the transaction, an opposite signal must be received. It is absolutely necessary to close the operation when an opposite signal is received. The
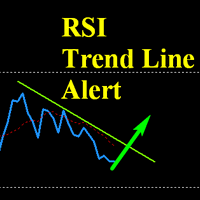
This indicator is an upgrade of traditional RSI on MT4. It can alert and push notificaton (if configured) when : -RSI line cross its MA line -RSI Enter and Exit Overbought and Oversold Zone. These zones can be set by input. -RSI cross line for both Trend line and Horizontal line. It has two working mode: on ClosedCandle and on RunningCandle. With ClosedCandle mode, it only alert when a candle is closed. Trader only draw a line (trend line or horizontal line) on RSI indicator window and the indi
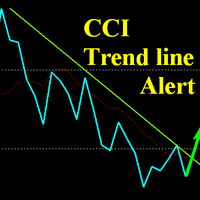
This indicator is an upgrade of traditional CCI on MT4. It can alert and push notificaton (if configured) when : -CCI line cross its MA line -CCI Enter and Exit Overbought and Oversold Zone. These zones can be set by input. -CCI cross line for both Trend line and Horizontal line. It has two working mode: on ClosedCandle and on RunningCandle. With ClosedCandle mode, it only alert when a candle is closed. Trader only draw a line (trend line or horizontal line) on CCI indicator window and the indi

This is the indicator of trading signals. Signal special will be not repair.
Input Parameters On Alert - True/False (displays a message in a separate window). On Send Notification = True/False. (Sends push notifications to the mobile terminals, whose MetaQuotes IDs are specified in the "Notifications" tab. (Strict use restrictions are set for the SendNotification() function: no more than 2 calls per second and not more than 10 calls per minute. Monitoring the frequency of use is dynamic. The
This indicator is based on the classic Pivot Points concept combined with additional optimizations and advanced features. The levels of support and resistance are calculated by taking into account the average historical volatility. The added multi-symbol scanner allows you to detect the best conditions and trade setups. You can see in real time the current situation for all of your favorite symbols and you can switch the chart to any symbol with one click. The build in alert system allows you

価格の強制力は、市場で行われている業務の量に加えて、動的に平均化することにより、価格の実際の力に関する価値ある有用な情報を提供する非常に強力な指標です。
このインジケータは、価格の動的な力を特定するために特別です。 ゼロの距離(0から上向きまたは下向きゼロのいずれか)は、弱気でも強気でも、強さと強さの程度を示します。
Force Price Power is a very powerful indicator that provides valuable and useful information about the real force of the price, dynamically averaging the volume of operations that are taking place in the market. This indicator is special to identify the dynamic force of the price. The zero distance (either up from zero or down from ze

Trend Professional is an indicator that generates trend signal. It generates trend signal with its own algorithm. These arrows give buying and selling signals. The indicator certainly does not repaint. Can be used in all pairs. Sends a signal to the user with the alert feature.
Trade rules Enter the signal when the buy and sell signal arrives. Processing should only be initiated when signal warnings are received. It is absolutely necessary to close the operation when an opposite signal is rece

Level Gun Pro is an indicator of the automatic construction of the levels of Ghana.
It is based on the theory Ghana, slightly modified algorithm to calculate the vibrations of the market.
The main essence of the indicator is that it takes the entire history of the trading instrument and builds horizontal levels on its basis.
Yearly, monthly and weekly.
The advantage of this indicator is that it applies levels to the chart in advance and does not adjust to its changes.
Yearly le

About Holy Trend was developed to identify trend and strength.
VIDEO (information and tips) [HERE]
Features Identifies trend Identifies strength of trend Identifies lines of support and resistance
Easy to analyze Fast signals All timeframes Not repaint (when candle close) No settings required Can be used in Renko charts Can be used with indicator Holy Renko PRO Alerts, email and push notifications
Advantages Sensitive identifier of trend able to identify the long, short movements and
PERFENCTRY will show you exactly when to enter a trade. If the trend changes, it will show the reverse accordingly. It works on all time frames and currencies, stocks, commodities & crypto It does not require a change of settings. The default settings are fine. Just load it on to your chart and wait for the entry signal. This works very well when using Trend Qualifier as a filter. You will wonder how you managed without PERFENCTRY DOES NOT REPAINT once candle is closed
Join my Telegram Ana
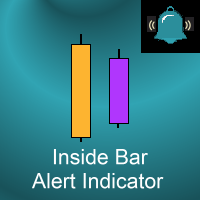
This indicator marks Inside Bars (bars with a lower high and a higher low than the previous bar) on your chart. It will also send alerts when one forms, including via e-mail or push notification to your phone . It's ideal for when you want to be notified of an inside bar set-up but don't want to have to sit in front of your chart all day. You can configure all the settings including: What symbol (if any) is plotted to highlight an inside bar Whether the symbol is plotted above the bar or below t
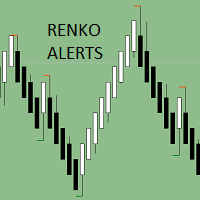
Renko Charts now have the alerts, we need. There are four alert types to choose from for notification on screen, email or phone notification. The alert types also have buffers for use with automation. This indicator can be incorporated with any system that requires renko charts. The four (4) alert types are: Three-bar Formation; Pinbar; Maubozu and Engulfing Bar The alerts may also be adjusted by settings found in the input window of the indicator.

The Doonchian channel consists of two channel displays. Channel lines are determined by a simple and reliable algorithm. The channel is preferably used for trading inside the channel. The indicator does not redraw and does not lag; simple algorithms are the basis of the work. It works on all currency pairs and on all timeframes. As always a warning, we must not forget that the approach must be comprehensive, the indicator signals require additional information to enter the market.

BBMA INDI https://www.mql5.com/en/users/earobotkk/seller#products This Indicator marks entry set-up for buy and sell. It will also send alerts when arrow forms, including via push notification to your mobile phone. It is very convenient when you want to be notified of the entry set-up while you are away from your chart. It also calculates maximum pips gained for each 1st set-up. Setting · You could choose two types of alert, pop-up desktop and push notification to your mobile phone. ·
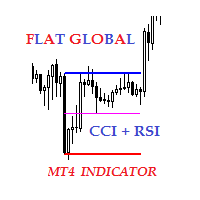
Description The indicator of local flat for CCI and RSI indicators. Users can select financial instruments. The indicator allows to find local flats in the following options: Width of channels that is not more than certain range Width of channels that is not less than certain range Width of channels that is not more and not less than certain range The indicator displays the middle and boundaries of the channel.
Purpose
The indicator can be used for manual or automated trading within an Exper
MetaTraderマーケットはトレーダーのための自動売買ロボットやテクニカル指標を備えており、 ターミナルから直接利用することができます。
MQL5.community支払いシステムはMetaTraderサービス上のトランザクションのためにMQL5.comサイトに登録したすべてのユーザーに利用可能です。WebMoney、PayPal または銀行カードを使っての入金や出金が可能です。
取引の機会を逃しています。
- 無料取引アプリ
- 8千を超えるシグナルをコピー
- 金融ニュースで金融マーケットを探索
新規登録
ログイン