YouTubeにあるマーケットチュートリアルビデオをご覧ください
ロボットや指標を購入する
仮想ホスティングで
EAを実行
EAを実行
ロボットや指標を購入前にテストする
マーケットで収入を得る
販売のためにプロダクトをプレゼンテーションする方法
MetaTrader 4のための有料のテクニカル指標 - 17
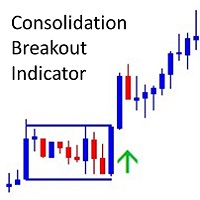
!! FLASH SALE !! Over 80% off !! For ONE week only. Now only $47 - normally $297! >>> Ends on 30 June 2023 - Don't miss it!
The Consolidation Breakout Alerts Indicator will revolutionize your trading strategy. Our innovative indicator offers unique buy and sell arrows when price breaks out from consolidation, allowing you to get in at the most optimal entry with minimal risk and maximum reward potential. Never again will you miss out on the lucrative trading opportunities available
This indicator displays RVI indicator signals on the chart. The main point of Relative Vigor Index Technical Indicator (RVI) is that on the bull market the closing price is, as a rule, higher, than the opening price. It is the other way round on the bear market. So the idea behind Relative Vigor Index is that the vigor, or energy, of the move is thus established by where the prices end up at the close. To normalize the index to the daily trading range, divide the change of price by the maximum r
This indicator is an oscillator built on the principle of the classic Momentum. The indicator is part of a series of indicators - T3 Line AM, T3 Momentum AM, T3 Candles AM, T3 Signal AM .
The indicator represents the difference between the current price and the price some number of periods ago. The difference from the classic indicator Momentum is the preliminary smoothing of prices according to the method T3.
Using the indicator: It should be taken into account that the values of the ind
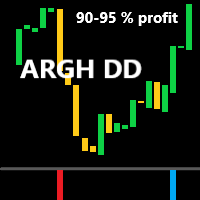
ARGH DD買い売りインジケーター
このインジケーターはヒストグラムインジケーターです。
これは、誤検知がほとんどない、強力で正確なインジケーターです。
これらが引き起こす取引は、数日または数週間にわたる取引です。
しかし、それらは非常に安定した取引です。
もちろん、エントリールールは非常にシンプルです。
️ 青いヒストグラム バーは、買いポジションの開始を示します。
️ 赤いヒストグラム バーは、売りポジションの開始を示します。
取引開始後、しばらく市場が逆方向に動く可能性があることに驚くべきではありません。
90% 以上の場合、意図したとおりに戻ります。
取引には H4 および D1 期間が推奨されます。
インジケーターをチャートにアタッチするときは、[最小値を 0 に固定] ボックスをオンにします (画像を参照)。
例:
2023 年の初めから現在まで、EURUSD ペアでは、この指標は 14 回の取引の開始を示してきました。
これら 14 回の取引のうち、損失は 1 回だけで、他の取引はすべて非常にうまくいきました

Advanced Trend Breaker Free Dashboard!!! Advanced Trend Breaker DashBoard: https://www.mql5.com/en/market/product/66336 Breaker's smart algorithm detects the trend,Support and resistance, filters out market noise and find entry signals!!! Test the demo version and explore its features, it would be useful tool added to your trading arsenal. Do not foget down load Free DashBoard!!! Advanced Trend Breaker DashBoard !!!
Advantages You Get Easy, visual and effective trend detection. Support a
The indicator analyzes the difference between the current price and the standard MA data. The indicator is not redrawn on the formed bars. To confirm the signal of the indicator, it is necessary to wait for the price to overcome the high (for buying) or the low (for selling) of the bar where the indicator changed color. The indicator is easy to use and configure. The indicator is effective as an element of any trend trading strategy. Custom Parameters: MA_Period - MA period; MA_Shift - MA shift;
The indicator allows you to simplify the interpretation of signals produced by the classical ADX indicator. The position of the thick bars of the histogram relative to zero and the histogram coloring indicate the direction of price movement determined by the intersection of DI+ / DI-. The position of the thin bars of the histogram relative to zero and the color indicate the strength of the price movement. A buy signal is generated when the price moves above the high of the last fully formed bar
The presented indicator colors the chart candles in accordance with the data of the T3 Momentum AM indicator. Coloring of candlesticks depends not only on the location of the oscillator histogram above or below zero. The location of the histogram relative to the signal line is also important. The indicator is part of a series of indicators - T3 Line AM, T3 Momentum AM, T3 Candles AM, T3 Signal AM . For a better understanding of the operation of each of the indicators, it is recommended to sta

This indicator displays the moment when the RSI oscillator crosses the zero value, and the moment when the RSI oscillator crosses its smoothed value. Crossing the zero value by the RSI oscillator is a buy/sell signal. If the RSI oscillator crosses its smoothed value, it is a signal of a trend change. The signal is given after the end of the formation of the candle. The signal is confirmed when the price crosses the high/low of the bar on which the signal was given. The indicator does not redraw.
This indicator displays RVI indicator signals. The main point of Relative Vigor Index Technical Indicator (RVI) is that on the bull market the closing price is, as a rule, higher, than the opening price. It is the other way round on the bear market. So the idea behind Relative Vigor Index is that the vigor, or energy, of the move is thus established by where the prices end up at the close. To normalize the index to the daily trading range, divide the change of price by the maximum range of price
Mars 12 is a Pullback indicator is a powerful indicator of Pullback trade for any par and any timeframe. It doesn't requires any additional indicators for the trading setup.The indicator gives clear signals about opening and closing trades.This Indicator is a unique, high quality and affordable trading tool. Can be used in combination with other indicators Perfect For New Traders And Expert Traders Low risk entries. Never repaints signal. Never backpaints signal. Never recalculates signal.
Please feel free to contact me if you need any further information.
Please let me know if you have any questions.
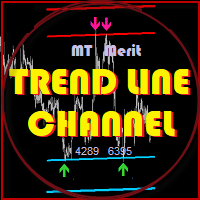
I hope the above is useful to you. MT MERIT TLC ( Trend Line Channel ) : It is an indicator created to look for Reverse or Break Out signals by using the trend line channel as a plot point to the current price. Suitable for people who trade by yourself, do not use with ea (non auto trade) manage risk management by yourself (Stop Loss,TP, Risk Reward, ...) and fundamental analysis
This indicator displays on the price chart (coloring candles graphics) signals about the standard MACD crossing the zero value, as well as about crossing the signal line. The indicator does not redraw.
Custom Parameters: Fast_EMA_Period - fast moving average period; Slow_EMA_Period - slow moving average period; Signal_Period - signal line period; MACD_Price - the price at which the indicator is built;

The indicator detects the current trend using the following definition: A trend is a market situation when each subsequent peak is higher/lower than the previous one, as well as each subsequent bottom is higher/lower than the previous one. Exceeding all previous peaks/bottoms on the specified amount of bars by the current peak/bottom is considered to be a beginning of a new trend. The indicator paints bars according to an identified trend. The indicator does not repaint.
Settings:
Lines_Bre
This indicator displays candle prices on the chart based on moving average data. That is, the opening price is the opening price of the moving average, the closing price is the closing price of the moving average, and so on. This approach allows you to visualize the average price changes, eliminate the "noise" and get a picture more suitable for evaluation and decision making. The indicator does not redraw on fully formed bars. At the same time, the indicator can change its data on the zero bar

Trade with Gann on your side!! MASTER CIRCLE 360 CIRCLE CHART, originally created by Gann admitted that this is “The Mother of all charts”. It is one of the last studies that this great trader left for us. The numeric tab le is apparently quite simple like all the tables and is based on square numbers, the SQUARE OF 12 and is by evolution, one of the most important square numbers. Here we can find CYCLE, PRICE AND TIME thanks to angles and grades, to show past and future support and resistance.

The indicator is based on the elements of Bill Williams' trading system. Sell signals are formed when MACD and OsMA values are falling simultaneously (Bill Williams calls these indicators АО and АС in his book), while buy signals appear when both indicators are rising. Thick and thin colored histograms match MACD and OsMA values. If the histogram is greater than 0, the indicator value is rising. Otherwise, it is falling. Positions should be opened when the price exceeds the bar's high or low, at
This indicator colors candles in accordance with the projected price movement. This indicator displays signals on the price chart when the closing price crosses the standard moving average line, as well as when the moving average changes its direction. The indicator does not redraw on completed candlesticks. The forming candlestick can change its color depending on the current data. Thus, it is recommended to wait for the candlestick to be completed before making a decision.
Custom Parameters:
This indicator displays RVI indicator signals on the chart. The main point of Relative Vigor Index Technical Indicator (RVI) is that on the bull market the closing price is, as a rule, higher, than the opening price. It is the other way round on the bear market. So the idea behind Relative Vigor Index is that the vigor, or energy, of the move is thus established by where the prices end up at the close. To normalize the index to the daily trading range, divide the change of price by the maximum r
REI Osc is an indicator that measures the rate of price change and signals overbought/oversold conditions if the price shows weakness or strength. The indicator was developed by Tom DeMark and described in the book Technical Analysis - The New Science. The indicator value changes from -100 to +100. REI is an improved oscillator as it attempts to remain neutral in a sideways trend and only shows signals when a significant top or bottom has been reached. Tom DeMark suggests using a default period

This indicator displays elements of the trading system described by Alexander Elder. This indicator uses the idea of opening sell deals in the period of MACD (or OsMA) falling below zero and opening buy deals when the indicator values rise above zero, in case this fall or rise coincide with the Moving Average direction. The thick and thin histograms correspond to the values of MACD and OsMA. If a histogram is above 0, the indicator value is greater than 0. If it is below, the indicator value is

This indicator displays the moment when the DeMarker oscillator crosses its smoothed value. If the DeMarker oscillator crosses its smoothed value, it is a signal of a trend change. The signal is given after the end of the formation of the candle. The signal is confirmed when the price crosses the high/low of the bar on which the signal was given. The indicator does not redraw.
Custom Parameters: DeM_Period (>1) - DeMarker indicator period; MA_Period - period for smoothing DeMarker indicator va

Introduction
"Smart money" is money invested by knowledgeable individuals at the right time, and this investment can yield the highest returns.
The concept we focus on in this indicator is whether the market is in an uptrend or downtrend. The market briefly takes a weak and reversal trend with "Minor BoS" without being able to break the major pivot.
In the next step, it returns to its main trend with a strong bullish move and continues its trend with a "Major BoS". The "order bloc
The presented indicator marks signals on the price chart with arrows in accordance with the data of the T3 Momentum AM indicator. The indicator gives a signal and sends a notification to the mobile terminal and email. The indicator is part of a series of indicators - T3 Line AM, T3 Momentum AM, T3 Candles AM, T3 Signal AM . For a better understanding of the operation of each of the indicators, it is recommended to start working with them by using them together on one chart. The T3 Momentum AM

The presented indicator is the author's implementation of the idea embodied in the Alligator indicator, which has already become a classic. The proposed product allows you to visually demonstrate the direction of price movement, temporary price rollbacks and zones of multidirectional price movement. Namely: The indicator lines go up and diverge from each other - a strong bullish trend; The indicator lines go down and diverge from each other - a strong bearish trend; The indicator lines go up but
This indicator displays the signals based on the values of the classic DeMarker indicator on the price chart. The DeMarker indicator can be used for determining the overbought or oversold areas on the chart. Reaching these levels means that the market can soon turn around, but it does not give signal, as in a strong trend the market can stay in the overbought or oversold state for quite a long time. As with most oscillators, the signals are generated when leaving these areas. This indicator all

Overview
The Volume SuperTrend AI is an advanced technical indicator used to predict trends in price movements by utilizing a combination of traditional SuperTrend calculation and AI techniques, particularly the k-nearest neighbors (KNN) algorithm.
The Volume SuperTrend AI is designed to provide traders with insights into potential market trends, using both volume-weighted moving averages (VWMA) and the k-nearest neighbors (KNN) algorithm. By combining these approaches, the indicat

Introduction
The Price Action, styled as the "Smart Money Concept" or "SMC," was introduced by Mr. David J. Crouch in 2000 and is one of the most modern technical styles in the financial world. In financial markets, Smart Money refers to capital controlled by major market players (central banks, funds, etc.), and these traders can accurately predict market trends and achieve the highest profits.
In the "Smart Money" style, various types of "order blocks" can be traded. This indicator
The indicator analyzes the divergence of the current price with the Laguerre filter data. Indicator signals: Blue dot - short-term transactions to buy an asset are allowed. Red dot - short-term transactions to sell the asset are allowed. A big blue signal - if the price breaks the high of the bar on which the signal was given - a medium-term buy trade is opened. A big red signal - if the price breaks the low of the bar on which the signal was given - a medium-term sell trade is opened. The indic
This indicator displays the moment when the MFI oscillator crosses its smoothed value. If the MFI oscillator crosses its smoothed value, it is a signal of a trend change. The signal is given after the end of the formation of the candle. The signal is confirmed when the price crosses the high/low of the bar on which the signal was given. The indicator does not redraw.
Custom Parameters: MFI_Period (>1) - MFI indicator period; MA_Period - period for smoothing MFI indicator values; MA_Method - me
The indicator analyzes the divergence of the current price with the Laguerre filter data. The indicator does not re-paint on formed bars. To confirm the indicator signal, wait till the price exceeds the High (for buying) or Low (for selling) of the bar, at which the indicator changed its color. The indicator is easy to apply and configure. It can be used as an element of any trend-following strategy. Configured parameters: T_Price - price for trend calculation; D_Price - current price against w
The indicator identifies the strength of the trend based on the points where the DeMarker indicator exceeds the overbought and oversold levels. The indicator does not redraw. This indicator:
Suitable for all markets; Not redrawn; Intuitive and simple; It can be useful for both beginners and experienced traders; Allows you to identify market entry points where there is a high probability of a significant price movement sufficient for a successful transaction; Settings: Ind_Period (>1) - peri

This indicator displays the moment when the TTF oscillator crosses the zero value, and the moment when the TTF oscillator crosses its smoothed value. Crossing the zero value by the TTF oscillator is a buy/sell signal. If the TTF oscillator crosses its smoothed value, it is a signal of a trend change. The signal is given after the end of the formation of the candle. The signal is confirmed when the price crosses the high/low of the bar on which the signal was given. The indicator does not redraw.
RFTL dpl AM - (Referense fast trend line - detrended price line) indicator built on the principle of searching for discrepancies between the current real price and the calculated trend value. RFTL - a digital filter that calculates the reference line, the overcoming of which by the current price is considered a change in the short-term trend. Indicator signals: Small red dot - the price continues to fall; Small blue dot - the price continues to rise; Big red dot - the price starts to fall; Big b

Intro to APAMI, PROfessional edition Trace exactly how far prices trend between two price levels with fractional pip precision, while qualifying price movement between the same price levels.
Completely automate when trends change direction and volatility, without any lag . This is possible because the Accurate Price Action Measurement Indicator (APAMI) actually does what no other indicator can: measure price distance between two points and simultaneously qualify the price action that occurs
This indicator displays linear regression data of financial instrument prices for two different periods. The user has the ability to select the prices at which the calculation is made. The position of the histogram above zero indicates an increase in prices. The location of the histogram below zero indicates a fall in prices. On fully formed chart bars, the indicator is not redrawn. At the same time, the indicator values at 0 bar (the current bar, the bar that has not finished forming yet) may

Accurate Gold インジケーターは、経験レベルに関係なく直感的で使いやすいユーザーフレンドリーなツールです。このインジケーターは、ゴールド市場のM5タイムフレームで正確なシグナルを探しているトレーダーを対象に設計されています。このインジケーターは、価格の動きと出来高ダイナミクスを分析するために高度な数学的アルゴリズムを使用し、正確な買いと売りのシグナルを生成します。このインジケーターの特長的な要素、リペイントしない性質を含め、トレーダーには市場の逆転の可能性に対する貴重な洞察を提供し、情報を元にした意思決定を可能にします。チャート上での視覚的な表示、聞こえるアラート、およびプッシュ通知により、ユーザーエクスペリエンスが向上し、正確性と信頼性を求めるゴールドトレーダーのツールキットに貴重な追加となります。 $ XX - 期間限定で、最初の5人 のサポーターは XX ドルで提供されています。 ( % 売り切れ)
$88 - ローンチ価格は88ドルです 。
$88 + X ($100) – 価格は5回の購入ごとに$100ずつ増加します。 MT4の信号 は

This multicurrency indicator is the Lite version of the Cosmic Diviner Reversal Zone Pro indicator. The indicator is based on original formulas for analyzing the volatility and price movement strength. This allows determining the overbought and oversold states of instruments with great flexibility, as well as setting custom levels for opening buy or sell orders when the overbought or oversold values of the instruments reach a user-defined percentage. A huge advantage of Reversal Zone Lite is the
This indicator displays DeMarker oscillator data for two different periods. The position of the histogram above zero indicates an increase in prices. The location of the histogram below zero indicates a fall in prices. On fully formed chart bars, the indicator is not redrawn. At the same time, the indicator values at 0 bar (the current bar, the bar that has not finished forming yet) may change. Thus, the indicator values at 0 bar should be ignored.
- Sale subject to all conditions:
Indica

EZT_Ichimoku_MTF
Multitimeframe Ichimoku indicator. Display up to 4 different Ichimoku on the chart. Every line of every ichimoku is customizable, you can turn off/on or choose different thickness or color. You can choose to see only the cloud in multiple ichimokus.
Optional info panel to identify the different Ichimokus. Works the same way like the original Ichimoku indicator.

KT Forex Volume shows the buying and selling volume of a currency pair in the form of a colored histogram. The volume is made of buying and selling transactions in an asset. In FX market: If the buying volume gets bigger than the selling volume, the price of a currency pair would go up. If the selling volume gets bigger than the buying volume, the price of a currency pair would go down.
Features Avoid the bad trades by confirming them using the tick volume data. It helps you to stay on the si
The Rapid indicator is a ready binary options trading system . The system is designed for trading on a five-minute interval with the 15-minute expiration and with the payout at least 85%, it is designed for traders using web terminals and MetaTrader 4 platform. Available financial instruments: EURUSD, EURCHF, GBPUSD, GBPJPY, USDJPY and XAGUSD. This is a counter-trend system, i.e. it waits for the price reversal of a traded asset. The indicator signals are not redrawn, they appear after the close

ベルマウイピンバー
または(BPB)は、チャート上でピンバーの価格アクションパターンを見つけるインジケーターです。ピンバーは「ピノキオバー」のショートカットです。これは、高い上部または下部の影と、ハンマー、逆ハンマー、ハンギングマン、シューティングスター、ドラゴンフライ同事、墓石同事などの非常に小さなボディを持つ日本のローソク足に代わる古典的なバーパターンです。 。 Bermaui Pin Barsインジケーターは、次のステップで説明できる式に応じてこのパターンを見つけます。
最初に、BPBはろうそくの本体の中心を計算します(= [開く+閉じる] / 2)。 次に、BPBは、体の中心とろうそくの間の距離が低いことを検出します。 最後のステップは、ステップ2の結果をろうそくの範囲で割ることです。 ろうそくの本体の中心がろうそくの高さまたは低さに近すぎる場合、BPBはピンバーパターンを検出し、ユーザーに警告します。 ベルマウイピンバーフォーミュラ : https://www.mql5.com/en/blogs/post/729139 以下を追加して、Bermauiピンバーの機能を強
DPPD(Dynamic Price Percent Deviation)は、「安く買って高く売る」というルールに従うシンプルでありながら効果的な指標です。 インジケーターは、電子メール、アラート、およびMQL IDプッシュ通知を送信できます。また、個別の個人通知を任意の偏差レベルに設定する可能性もあります。 個別の通知には、個別のコメントを追加できます。 なぜDPPDは動的なのですか?静的な点からの偏差は測定されないためです。偏差は、所定の平均からの価格偏差としてパーセントで測定されます。 あらゆる時間枠の推奨設定は200日移動平均です。これは、一般的なコンセンサスによると、大きな変動と傾向の線ですが、他の設定も機能する可能性があり、適切に使用すれば非常に効果的です。 インディケータはいつでもトレーダーに価格が与えられた平均よりどれだけ低いか高いかを知らせます。 インディケータはすべての時間枠で機能し、任意のタイプの価格と任意の移動平均方法を使用できます。 インジケーターのレベルはそれぞれ10%偏差に設定されており、極端な偏差を簡単に特定できます。一般的に、最良の売買機会は10%か

Entry and Exit indicator simplifies the trading process by automatically providing the entry price and the take profit price with the appropriate stop loss. The indicator constantly monitors the market for the right entry conditions and send outs signals via push notifications to the trader's mobile phone or pc as desired. Hence a trader do not need to watch the chart all day but only act when signals are sent. This indicator is built around the 'H4 Engulfing System' and the 'Triple Stochastic S

この指標のアイデアは、RSIをろうそくの形で描画し、それを価格チャートと比較して売買シグナルを生成することです。指標は私の発明ではありません。私は数年前にインターネット上でそれを設立しました。コードを更新し、アラート機能を追加し、BermauiUtilitiesグループのツールを追加しました。
インディケータはローソク足を引くために使用されるすべての価格のRSIを計算します(始値、高値、安値、終値のRSI)。それらの最も高いものを使用してRSIキャンドルの高い芯を描画し、最も低いものを使用してRSIキャンドルの低い芯を描画します。 RSIキャンドルのボディは高値と安値の間にあります。オープンのRSIがクローズのRSIよりも低い場合、RSIキャンドルは強気と見なされます。オープンのRSIがクローズのRSIよりも高い場合、RSIキャンドルは弱気と見なされます。
どうやって使うのですか
RSIキャンドルインジケーターでトレンドラインブレイクアウトをトレードすることができます。これは、勢いが価格をリードするため、価格チャートのトレンドをリードします。 RSIキャンドルインジケーターに任意

または、 B ermaui A verage C onvergence D ivergence Cloud は、トレンドの方向を示し、その強さをパーセントで測定するオシレーターです。 BACDクラウドの計算は次のとおりです。 1-2つの指数移動平均を計算します。それらの1つは他よりも高速です。最初の(速い)と2番目の(遅い)と呼びます
2-それらの間の中心を見つけます。ここで、Center MA =(Fast + Slow)/ 2
3-次のようにBACDラインを計算します。BACD= 100 *(高速/中央MA)
4-BACDの指数移動平均であるBACD信号線を計算します。式は次のようになります。BACDSignal= EMA(BACD)
5-チャートからBACDシグナルラインを非表示にします。
6- BACDヒストグラムラインを計算します。これは、BACDラインとその信号ラインの差です。 (注:BACDヒストグラムは、ヒストグラムではなく線としてチャートに描画されます。)
7-(BACD Line> BACD Histogram Line)の場合、

または CKC。
この指標は、Chester W. Keltner(1909–1998)によって記述された古典的な10日間の移動平均ルールに応じて機能します。すべてのパラメーターはデフォルトでクラシックバージョンのケルトナーシステムに設定されていますが、ユーザーは必要に応じてパラメーターを変更できます。 重要な情報
CKCマニュアルを読む: https://www.mql5.com/en/blogs/post/736577 CKCエキスパートアドバイザーの例: https://www.mql5.com/en/blogs/post/734150
Keltner ChannelFormulaについて
1.標準価格(=(高+低+終値)/ 3)から単純移動平均として中心線を計算します。
2.同じ期間と中心線の計算方法を使用して、高値と安値の平均差である平均日次範囲(ADR)を計算します。
3.ケルトナー購入ライン=センターライン+ ADR。
4.ケルトナーセルライン=センターライン–ADR。
Keltner10日移動平均ルール
ケルトナーの公式は、チャート上に2つの

The Slope Scanner is a Multi-Currency, Multi-Timeframe scanner of The Slope indicator. It calculates the slope of the price, and displays its direction for each symbol and each timeframe on a display board. Check Video Below For Live Trading Demonstration. Get a 7-Day Free Trial Version: Click Here (Full Access to The Indicator for 7 Days) Key Features: Allows you to see Multiple Murrency signals from one chart Calculates the slope of the Pair on All Timeframes Get a Currency Slope Strength
This indicator displays candle prices on the chart, colored according to the data of a linear regression of various prices (at the user's choice) for a selected period of time. The user has the option to select two different price types and two different time periods. The indicator will display the moments of coincidence of the directions of the linear regression.
Usage: After the full formation of a candle colored in the opposite color to the previous candle, place a stop order at the high /

Description The indicator determines the appearance of the bars that signal of a reversal of current local moods and plays a beep. It also paints these bars in accordance with the bullish and/or bearish priority. You can select the color for bullish and bearish moods.
Inputs Sound_Play - a flag that allows the sound notification.
Use Detection of the reversal bar can be a signal to perform appropriate trading activities. The indicator can be used for manual or automated trading in an Expert

This indicator colors candles in accordance with the projected price movement. The analysis is based on the values of the classic ADX. If the DMI+ line is above the DMI- line - the candlestick is painted in color that signals a price growth; If the DMI+ line is below the DMI- line - the candlestick is painted in color that signals a price fall. The indicator does not redraw on completed candlesticks. The forming candlestick can change its color depending on the current data. Thus, it is recommen

The indicator accurately identifies a short-term trend both on trend and flat markets. The confirmation of the signal is the overcoming by the price of the high/low of the bar on which the signal was given. Signals are given on fully formed bars and are not redrawn. Calculations are based on the system of Moving Averages. The indicator is highly sensitive. Use it together with other technical analysis indicators.
Settings: Sensitivity - amount of bars for the indicator calculation (1 or higher

This indicator displays the moment when the TTF oscillator crosses the zero value, and the moment when the TTF oscillator crosses its smoothed value. Crossing the zero value by the TTF oscillator is a buy/sell signal. If the TTF oscillator crosses its smoothed value, it is a signal of a trend change. The signal is given after the end of the formation of the candle. The signal is confirmed when the price crosses the high/low of the bar on which the signal was given. The indicator does not redraw.
This indicator displays the moment when the TTF oscillator crosses the zero value, and the moment when the TTF oscillator crosses its smoothed value. Crossing the zero value by the TTF oscillator is a buy/sell signal. If the TTF oscillator crosses its smoothed value, it is a signal of a trend change. The signal is given after the end of the formation of the candle. The signal is confirmed when the price crosses the high/low of the bar on which the signal was given. The indicator does not redraw.

Automatic redrawing of Trend Supports and resistances levels and Possible Wedge pattern formation to indicate price breaking of Rising Wedge (signal SELL) or price breaking of falling Wedge (signal BUY) Very simple and smart indicator ALERTS AND MOBILE NOTIFICATIONS availavle !!! you can edit the calculation bars of the bars count for formation of the trend lines and the initial shift from current price Smaller values for bars /shift inputs when using Higher Time frames (D1-H4) and the reverse
One of the standard ways to determine the direction of price movement at a particular moment is to calculate a linear regression for the values of such a price over a certain period of time. This indicator displays a line on the price chart based on the values of the linear regression of the selected price for the selected period of time. The indicator is as simple as possible and can be used within any trading strategy. The indicator is not redrawn on fully formed bars. Settings: Ind_Period - T

Squat bar.
One of the signals of the "Trade Chaos" system of Bill Williams.
It is calculated based on the difference in price changes and tick volume.
Strengthens the signal of the "Bearish/Bullish Divergent Bar (First Wiseman)" if it coincides with it or is nearby.
Tested in comparison with the original program "Investor's Dream".
For more effective development of the system, read and see the materials of Bill Williams.
In the settings you can choose the color and width of bar. (Widt

3つの周期のCommodity Channel Index(CCI)から現在の騰落を判断し、色分けでパネル状に表示します。 3つの周期は、第1周期(最小周期)に対して乗ぜられる補正係数によって第2、第3が変更されます。 さらに、それぞれのCCIはATR(Average True Range)でバラツキを修正して表示されます。 3つのCCIのうち、2つが揃ったときにTrend_1、3つすべてが揃ったときにTrend_2を表示します。
//--- Bollinger Bandsのバンド幅が極端に狭くなったところでSqueezを表示します。 Bands周期及びBandsDeviation(偏差)、ならびにバンド幅の過去最大と過去最小に於ける許容偏差を調整することで、 Squeez強度の表示を変更できます。 //--- Up矢印およびDown矢印表示は、 Squeezが発生しているときには表示されません。 Squeez終了時点のTrend_1状況、Trend_2発生の状況に応じ表示されます。
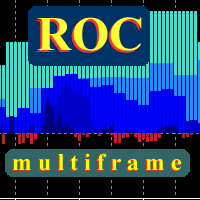
This is a true Price Rate-of-Change multi-timeframe indicator. It shows the charts of various timeframes in a single window converting them to the time scale used to perform trades. You are able to select both higher and lower timeframes, as well as change the main trading timeframe. You will always see all the lines of the indicator on the right scale. Two color scheme variants are available: with color change when crossing zero, and without. You can also define the data display style (lines or

Introduction
This indicator alerts you when certain price levels are reached. The alert can be on an intrabar basis or on a closing price basis. It will also send alerts when one forms, including via e-mail or push notification to your phone . It's ideal for when you want to be notified of a price level being reached but don't want to have to sit in front of your chart all day.
Input Parameters
DoAlert: if set to true a desktop pop-up alert will appear from your MetaTrader terminal whe

At the very least, this indicator is able to entertain you. It builds a moving line based on interpolation by a polynomial of 1-4 powers and/or a function consisting of a sum of 1-5 sine curves. Various combinations are possible, for example, a sum of three sine curves about a second order parabola. The resulting line can be extrapolated by any of the specified functions and for various distances both as a single point at each indicator step (unchangeable line), and as a specified (re-painted) f

Professional Trend Indicator Ti indicator is based on its own oscillator and shows you trend changes .
Indicator includes adjustable Polynomial and MAs channels , Trend lines and Oscillator filter with whom you can adjust the spread of indicator.
You can run many instances, for all time frames at once, is very fast and has a built-in " slider history testing " technology and “ Error control ”.
Program operates in 2 automatic modes:
1. Slider mode
Turns on when attaching the indicator to th

Индикатор Price Bars and Chart Patterns основан на трех баровых паттернах: Double Key Reversal Bar Popgun Multiple Inside Bar Индикатор Price Bars and Chart Patterns выставляет значки на покупку - зеленый цвет, и на продажу - красный цвет. Значки выставляются согласно сформированным баровым моделям после их подтверждения. Индикатор Price Bars and Chart Patterns работает на всех тайм-фреймах.Входные параметры отсутствуют. Индикатор Price Bars and Chart Patterns самостоятельно проделывает р
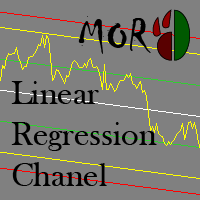
This indicator is designed for plotting the linear regression channel. For convenience, it has multiple operation modes and drawing of data from the selected timeframe.
Input parameters Price - the price to be used for calculation and plotting the upper and lower boundaries of the channel PriceHighLow - the value of bar's High and Low PriceOpenClose - the value of bar's Open and Close Mode - indicator operation mode Static - the linear regression channel is always plotted starting from BarStar
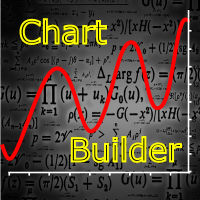
The indicator is designed for easy construction of synthetic charts based on data of various financial instruments. It will be useful both arbitrage and pair trading, as well as for analysis purposes. Its main advantage is simplicity and clarity. Each chart is given as a common mathematical formula. For example, if you want to plot the spread (difference) between EURUSD and GBPUSD with coefficients 4 and 3, then set the following formula: EURUSD * 4 - GBPUSD * 3 The resulting chart is shown in t
The indicator shows when every market session starts and finishes in colored frame box. It includes the Stop Hunt Boxes which shows pockets of liquidity, found at places where traders put their stop losses on existing positions. Contains EMA crossover alert on 50 EMA , 200 EMA and 800 EMA . It can be used in many Forex strategies and for easier observe of the chart.
Indicator parameters NumberOfDays - period of drawing the frames, default is 50 days; Draw_asian_box - draw the box of Asian ses

This indicator is designed to scan all pairs and symbols, for all selected time frames, to find a cross of moving averages. The 4 Moving Average Strategy
The scanner has 4 moving averages: - 2 moving averages to define the trend - 2 moving averages are used to find the right moment to send an alert
If the fast trend MA is above the slow trend MA, than it is considered as a bullish market and it will only provide bullish alerts. If the fast trend MA is lower then the slow trend MA, it is consi

Price Predictor is an indicator that shows precise price reversals taking into account a higher time frame and a lower time frame candle patterns calculations it is great for scalping and swing trading . Buy and sell arrows are shown on the chart as for entry signals. BIG Arrows indicates the trend - SMALL Arrows signal a trade (BUY/SELL) - A Green BIG UP Arrow with a support green line indicates a Bull Market : wait for buy signal - A Green SMALL Up Arrow after a BIG green arrow is
This indicator displays signals on the price chart when the closing price crosses the standard moving average line, as well as when the moving average changes its direction. The indicator does not redraw. Signals are shown on fully formed candles. The indicator can send notifications of its signals to the terminal and email. Custom Parameters: MA_Period - moving average period; MA_Shift - moving average shift relative to the price chart; MA_Price - price for which the moving average is calculat
MetaTraderマーケットは、開発者がトレーディングアプリを販売するシンプルで便利なサイトです。
プロダクトを投稿するのをお手伝いし、マーケットのためにプロダクト記載を準備する方法を説明します。マーケットのすべてのアプリは暗号化によって守られ、購入者のコンピュータでしか動作しません。違法なコピーは不可能です。
取引の機会を逃しています。
- 無料取引アプリ
- 8千を超えるシグナルをコピー
- 金融ニュースで金融マーケットを探索
新規登録
ログイン