YouTubeにあるマーケットチュートリアルビデオをご覧ください
ロボットや指標を購入する
仮想ホスティングで
EAを実行
EAを実行
ロボットや指標を購入前にテストする
マーケットで収入を得る
販売のためにプロダクトをプレゼンテーションする方法
MetaTrader 4のための無料のエキスパートアドバイザーとインディケータ - 51
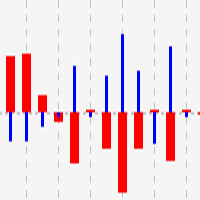
This indicator shows close to close price movements of the current symbol and an other as a histogram. It visualizes correlation between two symbols to help avoid counterproductive trading, diversify risk, etc. Attach it to the current chart as many times as many correlated symbols you want to take into consideration, and specify them in the OtherSymbol input field. The wide red histogram shows the movements of the reference (other) symbol, and the narrow blue histogram shows the movements of th
FREE

The Mad Trailer Expert Advisor by KALIFX
The Mad Trailer is a simple and aggressive expert advisor for MT4, developed by KALIFX. This EA automatically manages and adjusts stop-losses according to your preferences, ensuring your trades are protected as the market moves in a favorable direction.
Key Features:
- Automatic Trailing Stop-Loss: Unlike static stop-losses, the Mad Trailer EA dynamically trails your stop-loss a certain distance below the current market price, helping
FREE
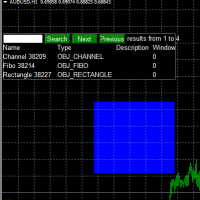
Use this software to browse through all objects within the chart and look at them comfortably. Also, you can look at the list of global variables and search and delete them . The same you can do with charts and indicators. You can search in objects names and object descriptions to find the object you are interested in. This is definitely an improvement to what is available in Mt4. You type what you are interested in , then press Search button. You can move to next and previous search results. No
FREE

Change Symbol of all charts with a single click. Place this file in Scripts folder to make it work. Enter your desired chart and me and apply this script to any chart. It will change all charts to that particular chart.
For any help - telegram - @binaryguruofficial
Feel free to use this free script. May god bless you with big profits Good Luck for your trading. Regards : Binary Guru
FREE

IMP
The Panel presents a number of indicators in abbreviated form: 2 oscillators, 2 trend and 1 volume indicator. Location - upper left corner.
Indicators values and colors can be customized by the user. Combined with other market analysis, can greatly improve trading results. This Indicator is a suitable tool for beginners and professional traders as one.
Metta Trader 4 Indicator Version _1.0
FREE

Slow T3 MA Trend indicator derived from T3 moving averages. This indicator is part of the T3 Cloud MA indicator and is posted here on its own. Buying/Selling opportunities above/below line. The MA line can also be used as dynamic support/resistance for more aggressive entries. Use default values for best settings. The number of look back bars is user defined. This indicator can be used in combination with other strategies such as price action. Suitable for all time frames.
FREE

Fast Position Copier - Reciver Tool This is Fast and Simple position copier from MT4-----> MT4.
Copying positions requires two bots : Master/Slave. Master ( Sender Position ) Slave ( Reciver Position) This is a Master version (Sender) and you need to download a Slave version from HERE . This tool is suitable for using to copy positions and manage them from a MetaTrader on one or more MetaTraders located on a server or computer. MetaTraders must be installed side by side.
FREE

The presented indicator is the author's implementation of the idea embodied in the Alligator indicator, which has already become a classic. The proposed product allows you to visually demonstrate the direction of price movement, temporary price rollbacks and zones of multidirectional price movement. Namely: The indicator lines go up and diverge from each other - a strong bullish trend; The indicator lines go down and diverge from each other - a strong bearish trend; The indicator lines go up but
FREE
Operations Monitor It is a simple but powerful monitor, which allows not to use the Terminal to have a cleaner chart.
Informs about all the operations opened in that Asset: Number of Open Operations Lost / profit Account Percentage Volume operated Colors: RED: the sum of operations is lost BLUE: the sum of operations is in profits Fonts: Allows change the font size.
FREE

The indicator allows you to trade binary options. The recommended time frame is М1 and the expiration time is 1 minutes. The indicator suitable for auto and manual trading. A possible signal is specified as a arrows above/under a candle. You should wait until the candle closes! Arrows are not re-painted Trade sessions: London and New York section Currency pairs: AUD/CAD Working time frame: M1 Expiration time: 1 minute The indicator also shows good results when using the martingale strategy - "Ma
FREE
WONNFX iSTATS - information indicator showing profit/loss on your MT4 account (pips, lots, currency, percentage) current profit profit for today profits for the current week profits for the current month profit for the current quarter profit for the current year
A convenient format for displaying statistics of your trading account in real time. (the indicator can be installed on any MT4 terminal chart)
FREE
The indicator analyzes the divergence of the current price with the Laguerre filter data. The indicator does not re-paint on formed bars. To confirm the indicator signal, wait till the price exceeds the High (for buying) or Low (for selling) of the bar, at which the indicator changed its color. The indicator is easy to apply and configure. It can be used as an element of any trend-following strategy. Configured parameters: T_Price - price for trend calculation; D_Price - current price against w
FREE
This indicator allows to hide CCI oscillator (on all MT4 timeframes) from a date define by the user, with a vertical line (Alone) or a panel (with "Hidden Candles"). Indicator Inputs: Period Apply To Information on "Commodity Channel Index" indicator is available here: https://www.metatrader4.com/en/trading-platform/help/analytics/tech_indicators/commodity_channel_index ************************************************************* Hey traders!! Give me your feeds! We are a community here and
FREE
The indicator analyzes the divergence of the current price with the Laguerre filter data. Indicator signals: Blue dot - short-term transactions to buy an asset are allowed. Red dot - short-term transactions to sell the asset are allowed. A big blue signal - if the price breaks the high of the bar on which the signal was given - a medium-term buy trade is opened. A big red signal - if the price breaks the low of the bar on which the signal was given - a medium-term sell trade is opened. The indic
FREE

Product Overview
This tool is discretionary trading aid that executes a one-time entry when the conditions are set.
Action after the newest bar is fixed (opening action)
For example, there is no need to worry about being pruned by the shadow of the same price before that if you set it in the condition of when the closing price was broken.
It is not possible to set complicated conditions, and it is not designed for continuous automatic trading, but since it works after the time period
FREE
This demo EA only sends text messages to a predefined Telegram channel ( there is no need to confiure telegram ). The messages can be customized to show information about the trading activity. Also it shows the daily account PnL. Several instances of this EA can be used simultaneously from the same MT4 terminal but ensure that each one has different EA ID number (setting B16) I have tested this EA with forex symbols but it should work fine with any MT4 symbol (e.g. indexes, commodities, stocks,
FREE

Photocopy MT4 is an Copier of transactions through Telegram channel. Will help you instantly publish your trade in Telegram channel or copy trades from Telegram channel. The utility can work in two directions by receiving signals in MT4 and transmitting signals to Telegram . No more missed deals No more panic Capital Management Ease of use
You can use it for:
Copying your own deals through Telegram channel (via the Internet); Copying trades from MT5 to MT4 and vice versa. Propagation of sig
FREE
This indicator displays candle prices on the chart based on moving average data. That is, the opening price is the opening price of the moving average, the closing price is the closing price of the moving average, and so on. This approach allows you to visualize the average price changes, eliminate the "noise" and get a picture more suitable for evaluation and decision making. The indicator does not redraw on fully formed bars. At the same time, the indicator can change its data on the zero bar
FREE
Standard deviation of returns is a popular way to view how the return of one bar relates to history. By knowing that you can better understand the magnitude of any return. The signal is calculated by taking the prior periods returns, adjusting for volatility of the returns of the last twenty periods, and dividing by the standard deviation. It is displayed in a separate panel as a histogram.
FREE
This is application readymade scanner for the traders, you can scan your watch list symbols, explanation timeinterval is the refresh rate of the symbols column height is the number of the symbols you want to scan, high1 and high2 are the comparison of the last two candles low1 and low2 are the comparison of the last two candles l1 is the last candle and l2 is the previous candle. other things are self explanatory, you can message me for any explanation, this indicator is more than worth 300US
FREE

This script was created for the best and easiest manual trading execution with automatic money management and TP/SL prices. Magic number included. Use the Buy, Sell, Stop and Limit scripts for a complete manual trading execution system. Parameters are self-explanatory. Take Profit and Stop Loss are measured in points for 5-digit brokers and pips for 4-digit brokers.
FREE

Utility for show on charts the visual informations about: - a vertical line at start of each bar of selected timeframe - a vertical line at start of each day - a vertical line at start of each week - vertical lines at start / end of trading sessions selected - bid / ask prices, spread, money value for each point (of 1 standard lot) and last tick time recived" You can enable / disable each information and set the color for each line
FREE

TopstepFX Max Lots Calculator was built to help traders in the TopstepFX Trading Combine monitor their cumulative open position size across all products. While using it, the chart window that is running the Expert Advisor will automatically display the total cumulative position size, for all products being traded. Additionally, it will warn traders when their max position size has been reached.
FREE

The indicator accurately identifies a short-term trend both on trend and flat markets. The confirmation of the signal is the overcoming by the price of the high/low of the bar on which the signal was given. Signals are given on fully formed bars and are not redrawn. Calculations are based on the system of Moving Averages. The indicator is highly sensitive. Use it together with other technical analysis indicators.
Settings: Sensitivity - amount of bars for the indicator calculation (1 or higher
FREE

This indicator displays candle prices on the chart, colored in accordance with the data of the FATL digital filter built on closing prices. The indicator has no configurable parameters. Allows you to effectively follow the short-term trend. Usage: After the full formation of a candle colored in the opposite color to the previous candle, place a stop order at the high / low of such a candle. When the price overcomes such a high/low, a position will be opened. With the full formation of a candle p
FREE
DF Osc AM - this is an indicator that marks the moments when the price direction changes. The indicator uses adaptive digital filters for analysis. Digital filters are (simplified) a way to smooth data. Unlike traditional moving averages, a digital filter will be more effective in most cases. The indicator does not redraw, the signal is generated after the candle is completed. It is optimal to use the indicator signals as signals to open a trade when the price overcomes the maximum or minimum o
FREE

Risk Management Panel is unique to tool calculate your risk quickly and place trades based on your account money. There are two options for the user Account Equity Account Balance Tools like these is specially useful when you have to take a quickly decision about your trade but dont have the time to calculate the risk. It works with magic number. So the advantage is a trade placed by this panel could be manipulated by the other expert advisors as well
FREE
Digital filters are (simplified) a way to smooth data. Unlike traditional moving averages, a digital filter will be more effective in most cases. The presented indicator displays in a separate window in the form of a line the data of several (optional) digital filters built at different (optional) prices. The presented indicator is a simplified version of the Digital Filters AM indicator. The indicator does not redraw on fully formed bars. The indicator allows you to effectively follow the trend
FREE
The presented indicator displays a trend line and support/resistance line on the price chart. A change in the direction of the trend line indicates a change in the medium-term trend. A trend line above the support line is a buy signal. A trend line below the resistance line is a sell signal. Specific rules of using the indicator are set out in the comments to it.
FREE
The indicator displays in the form of a histogram the difference between the current price and the price for the previous period. A similar method of market analysis is used in the classic Momentum indicator. At the same time, the presented indicator uses the primary data smoothing by the Laguerre filter, which allows maintaining the sensitivity of the indicator and minimizing the "noise". The indicator signals are: Histogram crossing 0. Change of signal line direction. The histogram crossing th
FREE
The Change Chart Timeframe EA is a powerful tool that provides users with the ability to effortlessly modify and customize chart timeframes according to their trading strategies and personal preferences. You can select individual charts to modify or apply changes to all charts simultaneously, saving valuable time and effort. This EA is just a tool to help with your auto trading. It doesn't open any trades, so nothing happens if you backtest it. Any setting marked with "(pro)" will use its
FREE

* The product for MT5 converted using "BRiCK TradeByArrow MT4" is here. BRiCK is a simple and versatile utility.
By combining Experts, Indicators and utilities like the Lego block, various trading styles can be realized. "TradeByArrow" is Utility that executes order processing when an arrow object is created on the chart.
Combined with Indicator which outputs arrow object, it can be used like Expert.
Parameter
[ArrowName] EntryBuy: Arrow object name for buy order (partial match) Entr
FREE

This Expert Advisor alerts users when the price crosses the chart lines. Horizontal and trend lines can be processed. Number of lines is not limited. Parameters prefix of signal line – prefix for the names of the objects (lines) processed by the indicator. If left empty, all horizontal and trend lines are processed. price Mode – bid or ask. timeout – crossing alert timeout. number of repeats – number of crossing alert repeats. number of comment lines – self-explanatory.
FREE

Pattern Finder Demo is the free version of Pattern Finder , a MULTICURRENCY indicator that scans the entire market seeking for candlestick patterns in 15 different pairs/currencies all in one chart! This demo has all the functionality of the version on payment except the number of patterns at disposal that are lowered to 4 only (from 62). You can also filter the scanning by following the trend by a function based on exponential moving average.
Indicator parameters Alerts ON/OFF: Alert on scree
FREE

ClosureMaster Utility closes all orders and offers 7 additional modes. If you have dozens or even hundreds of orders and need to close them all or some of them selectively by comment, magic number, buy only, sell only, if Stop Loss is not set, only profitable or losing trades, then ClosureMaster Utility can take care of this task.
External parameters:
Close all Losing trades Close all Profitable trades Close all orders without Stop Loss Close Buy orders only Close Sell orders only Close by Mag
FREE

Currency Pair Information
Useful indicator to have the following information on the chart: 1. Asset Name 2. Current Spread 3. Current ATR of the actual time frame 4. Time to close of the candle
It is located at the top right of the chart. If you request it, I can add the parameterization of the location of the information.
Other tools:
AMS Forex System
hockfx Price Alert Pro
hockfx
FREE
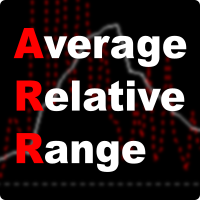
ARR indicator is similar to ATR but it returns percent range in relation to open price of given bar. It is mostly useful for cryptocurrency symbols where ATR ranges from years ago can't be directly compare with current values. First buffer (red dotted line) represents percent range of single bar and second buffer (white solid line) represents simple average of defined number of last bars. Only one input, PERIOD relates to number of bars used for average calculation (in default equals to 14).
FREE

The Stock Exchange One Sessions Hours version 2.00
This indicator facilitates observing the currency pair's quotations during subsequent parts of the stock exchange session live. Before the session starts, a rectangle is drawn on the chart but not filled in with color. It means the extent of the session duration. Before the first bar enters the rectangle of the session, a sound signal or pop-up window will notify us that the session will just start. When the price graph crosses the edge of th
FREE
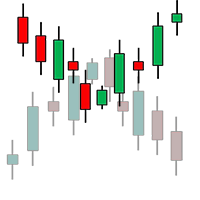
Th3Eng Chart shadow indicator is a tool helps you to display another symbol on the current symbol in candles style or line. You can type the second symbol name in the setting and select the drawing mode { candles or line }. Also, the indicator displays the spread and current price of both pairs on the left top side corner of the chart.
setting: 1- Symbol: Insert The second symbol name. 2- Drawing mode: Choose the draw mode from (Candles or line). 3- Show spreads: true\false to display the pri
FREE

***IMPORTANT: This free indicator works with the paid for Strong Weak Forex Expert Advisor. The EA also depends on the following custom indicators: Strong Weak Heiken Ashi Strong Weak Parabolic Strong Weak Values Strong Weak Indicator Download them for free in the Market. The EA will not work without it. These are all custom indicators which the Strong Weak Forex Expert Advisor relies on to generate trading signals. If you have any problems with installation send me a message.
FREE

チャート下に表示されるテキストボックスから、Slackに投稿するツールです。 w/Imgのボタンからは、チャート画像も送ることができます。
チャートに線やマーク、コメントなどを書いても、その画像が投稿されます。
使い方は簡単。 メッセージを入力し、SENDボタンでメッセージの投稿、w/IMGボタンでメッセージ+画像の投稿を行うことができます。 どんな使い方ができるか、人それぞれですが、Slackでコミュニケーションをされている方であれば、チャート画像を一発送信できるので便利だと思います。
*Slack API"のTOKENをパラメタに設定しますので、取得する必要があります。
ストラテジーテスターでも動作を確認できます。
FREE

日常の取引から抜け出し、魔法の世界に少しの間飛び込む機会があります。私はあなたの注意を引くためにゲームを提示します-カードトリック。 mql言語では、エキスパートアドバイザー、インジケーター、スクリプトだけでなく、そのような小さなゲームも作成できます。 私はトレーダーでありプログラマーであるだけでなく、自由な時間にカードトリックを見せたいと思っています。それが起こったので、お気に入りのトリックの1つをデジタル化することにしました。焦点に多くのメンタリズムが含まれていることを考えると、それは簡単ではありませんでした。 トリックは、珍しいカードのデッキによって示されます。これらは優れた紙のカード「ロシア風」です。 1903年2月に冬宮殿で開催された、コートボールの参加者の衣装を繰り返した、衣装を着た人物が描かれたこのトランプのデッキ。カードのスケッチは、1911年にドイツのカードゲームDondorf(Frankfurt am Main)の工場で開発されました。王、婦人、ジャックの服は17世紀のスタイルで作られています。エース-古代ロシアの武器と鎧に囲まれた盾の画像。カード自体はサンクトペテ
FREE

功能 勾选需要显示的内容,(当前版本包括当前K线倒计时,市场信息)并显示到图表右下角。
显示格式参数 fontsize 字体大小
c 颜色 font 字体类型
自定义显示的内容 参数 Symbol candle time left SPREAD DIGITS STOPLEVEL LOTSIZE LOTSIZE TICKSIZE SWAPLONG SWAPSHORT STARTING EXPIRATION TRADEALLOWED MINLOT LOTSTEP MAXLOT SWAPTYPE PROFITCALCMODE MARGINCALCMODE MARGININIT MARGINMAINTENANCE MARGINHEDGED MARGINREQUIRED FREEZELEVEL CLOSEBY_ALLOWED
FREE

The purpose of this new version of the MT4 standard indicator provided in your platform is to display in a sub-window multiple timeframes of the same indicator. See the example shown in the picture below. But the display isn’t like a simple MTF indicator. This is the real display of the indicator on its timeframe. Here's the options available in the FFx indicator: Select the timeframes to be displayed (M1 to Monthly) Define the width (number of bars) for each timeframe box Alert pop up/sound/ema
FREE

This script is a part of the Sounder_TopBottomLevels product which is intended to alarm the trader by sound when a Symbol's price goes above or below certain level(s). One of the product's features is a handy operation. You manage the levels by dragging lines on the chart with the mouse. Another feature is an optional Windows application which shows the chart that currently alarms the trader. And the sounds are customizable which may be useful for office with a number of the terminals running
FREE
This indicator displays candle prices on the chart, colored according to the data of a linear regression of various prices (at the user's choice) for a selected period of time. The user has the option to select two different price types and two different time periods. The indicator will display the moments of coincidence of the directions of the linear regression.
Usage: After the full formation of a candle colored in the opposite color to the previous candle, place a stop order at the high /
FREE

The information panel shows market information about the selected symbol, which is hidden from the eyes of the trader. You can change the color of the panel panel, the color of the text on the panel. It can be moved around the screen. Available in two languages (Russian and English). Data: Symbol - symbol names; Point - Point size in quote currency; Spread - Spread in pips; Stop Level - The minimum acceptable stop loss / take profit level in pips; Lot Size - The contract size in the base curre
FREE
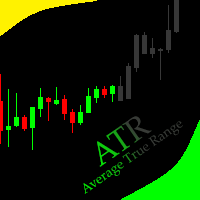
This indicator allows to hide ATR oscillator (on all MT4 timeframes) from a date define by the user, with a vertical line (Alone) or a panel (with "Hidden Candles"). Indicator Inputs: Period Information on "Average True Range" indicator is available here: https://www.metatrader4.com/en/trading-platform/help/analytics/tech_indicators/average_true_range ************************************************************* Hey traders!! Give me your feeds! We are a community here and we have the same
FREE
This indicator allows to hide RSI (on all MT4 timeframes) from a date define by the user with a vertical line (Alone) or a panel (with "Hidden Candles" utility). Indicator Inputs: Period Apply To Information on "Relative Strength Index" indicator is available here: https://www.metatrader4.com/en/trading-platform/help/analytics/tech_indicators/relative_strength_index ************************************************************* Hey traders!! Give me your feeds! We are a community here and we
FREE

GBP INDEX
The Currency Index Project is ONE part of a thorough Forex study. Many people do not know the theoretical basis that drives currency exchange rates to move on the market. With this set of tools you will be able to have a more complete view of the entire market by analyzing not only the single currency of an exchange, but all the exchange rates that make up that currency by looking at a single window!
The indicator faithfully represents the real index of a single currency present in
FREE
RSI Signalz ---------------------------------------------------------------------------------------------------------------------------------------------------------------------------------------------------------------------------------------------------------------------------------------------------------------------- NOW FREE FOR EVERYONE! TUNABLE IN THE INPUT SETTINGS - ENJOY :)
(IT DOES NOT TRADE FOR YOU. THIS IS TOO JUST HELP WITH MANUAL TRADING)
Fully Automated EA for marking good
FREE

The indicator marks bars with a simple trend definition“ each subsequent high above/below the previous one and each subsequent low above/below the previous one ”. Charles Dow
Formula:
Max – The current maximum Min – The current minimum MaxK – Maximum per period MinK – Minimum per period Min>MinK & Max>=MaxK – Symbol on top Max<MaxK & Min<=MinK – The symbol on the bottom
Input parameter:
Number of bars in the calculated history Period for current timeframe The distance to the symbo
FREE

If you want to test the functionality of this tool, you can do it trough this DEMO version, that is restricted to work only on EURUSD and USDJPY currency pairs. Full version is available here: https://www.mql5.com/en/market/product/29243/ This EA was originally coded as a back up tool for my personal trades as all of us (Or at least the ones who have left an order open and went to sleep) have experienced the frustration that involves waking up, check the trades and see that in some of them the
FREE
This indicator colors candles in accordance with the projected price movement. The analysis is based on the values of the classic Stochastic Oscillator. If the main line of the Stochastic Oscillator is above the signal line and above the oversold level - the candlestick is painted in color that signals a price growth; If the main line of the Stochastic Oscillator is below the signal line and below the overbought level - the candlestick is painted in color that signals a price fall. The indicator
FREE
If you need to follow more than 1 open position , you would ike to use this simple TrailingStop EA.
Input 1 You have 4 options to set the TrailingStop , Follow the positions of the graph's symbol. Follow a position that has a given ticket number. Follow the positions that has a given Magic number. Follow All the positions. Input 2 Ticket Number ( if 2nd option is selected as input 1) Input 3
Magic Number ( if 3rd option is selected as input 1) Input 4
Trailing Stop amount in Pips Input 5
FREE

インジケーターには、現在のサーバー時間と、現在のバーがチャート上で閉じるまでの時間が表示されます。 情報は、トレーダーが取引セッションを開始するために、ろうそくが閉じるのを待っているときに、ニュースリリースの瞬間に非常に便利です。 フォントサイズと色は、チャートテンプレートに合わせて調整できます。
設定: テキストの色-表示テキストの色 テキストサイズ-表示テキストのサイズ
あなたが指標について肯定的なフィードバックを残すなら、私は非常に喜んでいます。 あなたの武器で見たい他の指標やその他のツールを議論に書いてください。 新しいロボットの更新とリリースを逃さないように友人として私を追加-> Dmitrii Korchagin
市場で私の他の製品を参照してください-> 私の製品
私のロボットはすぐにリリースされますが、その間に、それがどのように取引されるかを見てください-> Hewer Signal
FREE

The Close script is a simple tool that allows traders to close their trades by three methods. Just run the script and choose the close method.
Closing methods Symbol - Allows closing all open trades for a specific symbol. All_Trades - Allows closing all open trades. Magic_Number - Allows closing all open trades according to their magic number. Recommendation AutoTrading functions must be activated. If the AutoTrading function is disabled, the script will not work. EA should be stopped
FREE

Trades Viewer Free supports EURUSD only. Trades Viewer is a trading helper app for a serious trader. It offers several important data like day range, 22 days average range and predefined PL. It draws trades history and current open positions on a chart. It has a detail panel for viewing a particular trade with just a click on that trade. All these make it very convenient and straightforward to view your entry/exit positions and thus improve your trading system. Features Profit/loss of the curren
FREE

Introducing the Server Time Indicator — an indispensable tool for traders seeking precision and efficiency in their MetaTrader 4 platform. Server Time Indicator updates dynamically based on market activity or on every tick to optimize memory and resource usage. In instances where the financial markets are inactive or closed, the indicator will refrain from providing real-time updates to ensure accurate representation of current market conditions. This approach safeguards against any mis
FREE

This is a demo version of CyberTrader Assistant tool. In demo version you cannot change lots value (it is set to the minimal value for the given symbol) and price rounding function for pending orders is unavailable This tool simplifies routine trading tasks (like opening market orders, setting up pending orders, closing of all orders and orders by parameter), helps to control losses by use of break even stop and trailing stop, and adds a little bit of cyber punk edge to your trading
Control El
FREE

Using hotkeys, you can create graphic objects of different drawing styles and different colors on the active chart. You can change the formatting styles for graphics. You can choose default drawing styles, or set them in the advisor properties selection window. Going to the graph, when creating graphic objects, the color, line type and line thickness are selected automatically. Drawing styles for graphical objects will depend on the current timeframe where drawing will be performed. Please watch
FREE

TickConverter
ティックチャートコンバータ スクリプトのバージョン このスクリプトは、オフラインチャート用のティック履歴データを作ります。 1バーあたりのティックボリュームを設定することができます。また、このスクリプトは、バーの作成速度を監視しています。
入力パラメータ: バー内のティック数 変換するバーの最大数 スプレッドの無視を有効にする ヒストリバーのHighとLowを省略する 表示調整のために数字を省略 1pip単位の表示を有効にする 速度を平均するバーの数 バー速度ラベルを有効にする 速度ラベルの色 オフラインチャートのリフレッシュレート(ミリ秒)
使用法: パラーメータをセットします。 M1またはM5チャートにこのスクリプトを添付します。 履歴データファイルには、シンボルの末尾に接尾辞「T」が付いています。 [ファイル]メニューから履歴ファイルを開きます。 オフラインチャートはリフレッシュレート設定で再描画されています。 オフラインチャートが自動的に更新されない場合は、このスクリプトを添付されている同じチャートに再度添付します。
FREE
The indicator draws angulation lines on a chart. These lines can help make decision on whether to enter the market or stay out of it. It is used to filter the signal "The First Wise Man" described in Bill Williams' strategy. Angulation in this indicator is displayed for any bar that is formed after Alligator's mouth is crossed (not only for reversal). Settings: Show angulation lines . Show info - show additional details (angulation degree, calculation points, number of bars). Minimal angle to fi
FREE
This is an indicator that works as a plug-in for Control-adora and lets you set buy limit (bl) or sell limit (sl) orders when a trigger level is reached. This could be useful when you want for example wait until the price breaks support or resistance level and then place a limit order to take advantage of this breakout with a better price. In order to use this indicator, after placing the indicator on the chart with the Control-adora expert working on it, just add 2 Price Labels or trend lines a
FREE

This indicator is a combination of classic trend indicator and signals of the fast digital filter. The indicator has no configurable parameters. The signals are displayed on completed bars and are not redrawn. It shows high efficiency on periods greater than 1 hour. The usage principle is intuitive - trade in the direction shown by the fan of moving averages. Enter once the price exceeds the High/Low of the bar where the signal was formed. Exit on the opposite conditions.
FREE
Update:ver1.53 (2023/08/16) ・概要と必要環境 手動発注もしくは他ツール等からの発注に対し、指値発注予約の複製を生成します。こちらは「発注操作の簡易化」に特化したものになります。発注判断となる分析は、資料を漁る、経験則を導く、他の分析ツールやEAを併用する等、利用者ご自身で頑張ってください。なお、ver1.28より、「決済後、自動で再発注する」機能が実装されました。(有償版でのみ有効化できます)
・導入と導入後の操作 導入そのものは簡単です。「自動売買可能なEA」として、適当なチャートにて動作させるだけです。(チャートの対象相場は問いません。このEAは、チャートを見ていません)。あとは、「このEAでのローカルコピー以外の発注」があれば、それに応じて「損失が出た場合に備えての追加取引の予約」という形で、指値発注が自動生成されます。 導入操作上の注意として、「本EAを、複数のチャートで動作」はできません。EAがチャート自体を見ておらず、注文状況だけを見ているため、複数のチャートで動かす意味もありません。また、ターミナルとEAの設定として「自動売買」を許可しな
FREE

Script risk management, which calculates for you the potential profit, possible loss, risk percentage, on the entire account and for each instrument. Shows where stop-losses and take-profits are not set.
Each line summarizes the number of open transactions for a specific instrument and calculates the percentage of loss from the total deposit. Beyond the line, the final calculation of the balance is summarized, if all transactions are triggered by stop loss; Potential loss, as the sum of all s
FREE

Script to load on chart the orders, starting from "Signal history report" downloaded from MQL5. If you found a good signal on "Signals" section of this site and you want to see the history orders on chart, you can do it, following this steps: - Download the csv file of history orders - Copy file in the common folder - Launch the script and set the input that are: - Report type (MT4 or MT5) - File name - Delimiter (default is ;) - Name of symbol to load (if symbol on file is for example EURUSDi,
FREE

VisualTicks_EA is an Expert Advisor dedicated to the VisualTicks chart.
Works ONLY on the VisualTicks chart.
Is a tool that lets you open and close transactions directly on the VisualTicks chart.
There is only one parameter in EA settings:
magic - next EA number. If you use more than one VisualTicks_EA on MT4, you must enter a different magic number.
After starting VisualTicks_EA, the following buttons will appear on the chart:
Open BUY - opens one BUY transaction of a specified lot si
FREE

Основное удобство донного индикатора в том, что он не назойлив как большинство, он хорошо показывает среднюю цену на текущем графике. индикатор информирует о количестве открытых позиций по текущему инструменту, а так же по всем открытым инструментам в том числе. при расчете средней цены учитывает комиссию и свопы, показывает чистую цену. Отображается на графике внизу экрана, есть возможность менять цвет и размер шрифта.
FREE
MetaTraderプラットフォームのためのアプリのストアであるMetaTraderアプリストアで自動売買ロボットを購入する方法をご覧ください。
MQL5.community支払いシステムでは、PayPalや銀行カードおよび人気の支払いシステムを通してトランザクションをすることができます。ご満足いただけるように購入前に自動売買ロボットをテストすることを強くお勧めします。
取引の機会を逃しています。
- 無料取引アプリ
- 8千を超えるシグナルをコピー
- 金融ニュースで金融マーケットを探索
新規登録
ログイン