YouTubeにあるマーケットチュートリアルビデオをご覧ください
ロボットや指標を購入する
仮想ホスティングで
EAを実行
EAを実行
ロボットや指標を購入前にテストする
マーケットで収入を得る
販売のためにプロダクトをプレゼンテーションする方法
MetaTrader 4のための無料のエキスパートアドバイザーとインディケータ - 9

Quantum nest is a robot advisor using trade hedging. Refers to trend advisers, working on a quantum variable system.. The Expert Advisor applies security varnishing orders and fixes the profit with only a positive balance. Suitable for any style of trading, scalping, medium and long-term trading. It is possible to use martingale in trade. The Expert Advisor works on all market instruments of the MT4 platform. ATTENTION! First of all, before work, it is necessary to optimize the adviser on your
FREE

The indicator defines the buy and sell arrows with high performance and consistent results. Suitable for trend trading or following the trend. Automatic analysis of market opportunities ; Help traders earn more from their investments;
Never repaints, recalculates or backpaints signals; This is FREE demo version of the indicator and works only on "GBP USD M5" . The demo version does not work on SUFFIX OR PREFIX brokers ! Forex Trend Commander All details about the indicator here :
FREE

SAAD Scalper is fully automated EA and handles two strategies at same time with its unique style to make most of trades profitable. The EA scalps pips by its strong Entry strategy. Trades that are not successful to scalp are handled in a different and unique way of martingale. It includes two options to deal with open trades. Pending Order Martingale (It helps to reduce Draw Down) Market Order Martingale It works on multiple currency pairs simultaneously and best results found for EURUSD, GBPUSD
FREE
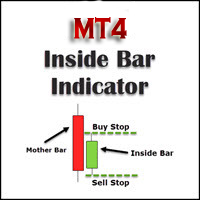
This inside bar indicator MT4 is suitable if you are doing inside bar trading. So what this MT4 inside bar indicator does is identifies inside bars for you as they form on your charts. Inside bar is a famous trading pattern in which the bar carry higher low and lower high compared with the previous bar, also known as mother bar. With, a lesser time frame like the 1 hour chart, daily inside bar chart will sometimes appears to be similar to a triangle pattern.
Inputs AlertOn - enable alerts Ema
FREE

AI トレンド インジケーターは、金融市場のトレンドの方向を正確に判断するために、高度なニューラル ネットワーク テクノロジーを使用して作成された革新的な取引インジケーターです。 このインジケーターは、価格動向の詳細な分析に基づいた直感的で有益な意思決定ツールをトレーダーに提供します。
主な特徴:
トレンド予測のためのニューラル ネットワーク: AI トレンド インジケーターは、膨大な量の履歴データでトレーニングされた強力なニューラル ネットワークを使用します。 このネットワークは、価格変動の隠れたパターンとトレンドを特定することができ、トレンドの方向性を正確に予測します。
多次元分析: このインジケーターは、さまざまな時間間隔と要因を考慮して価格データの多次元分析を実行し、価格変動の方向についてより完全かつ信頼性の高い予測を作成できます。
トレンドのグラフィカル表示: AI トレンド インジケーターは、ユーザーに現在のトレンドをグラフィカルに表示し、意思決定プロセスをより直感的かつ明確にします。 さまざまなカラーコードとマーカーにより、現在の市場状況を明確に視覚的に
FREE

Super MACD es un asesor experto avanzado diseñado para operar en el mercado financiero, centrándose en la estrategia del Moving Average Convergence Divergence (MACD). Este asesor ofrece la posibilidad de personalizar los niveles de Take Profit y Stop Loss en todas las operaciones, brindando así un control preciso sobre la gestión de riesgos y ganancias.
Parámetros recomendados Eur Usd M5 Características destacadas de Super MACD: Indicador MACD Optimizado: Super MACD utiliza una versión altamen
FREE
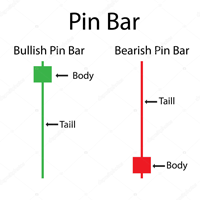
Pin bar pattern is characterized by a long upper or lower wick with a small body relative to the size of the wick with little to no lower or upper shadows. Pin bars are not to be traded in isolation , but need to be considered within the larger context of the chart analysis. A pin bar entry signal, in a trending market, can offer a very high-probability entry and a good risk to reward scenario.
Inputs MinimumTailPips- Minimum size of Tail in pips; TailBodyCandle- means how many times Tail gre
FREE

Circuit Expert Advisor. EA uses arbitrage system of entering both direction of the market. In addition EA has built in Filter Engine for triggering the trades. All trades covered by fixed Stop Loss & Take Profit. No Grid, No Martingale, Works with high spread. This EA operates only once per bar opening. Fast methods of strategy testing and optimization are valid. User can test / optimize by model: (control point) / (open prices only) developed, tested and optimized on " Vantag
FREE

LT Gzeta EA MT4 is an expert advisor that works based on simple support resistance, chart pattern and ATR calculations. This EA is a free version of Zeta EA MT4 because the main strategy is same. Using this EA, pair AUDUSD in time frame H4 is the best performance.
If you want to get much better result, high recommended to use Zeta EA MT4, because it has better function and better performance.
Zeta EA MT4 has good performance at all pairs, period H1 since 2017, january until 2023, december
ht
FREE

The indicator displays crossing zero level by Moving Average of Oscillator (OsMA) in the form of arrows. The this is a multi-timeframe indicator, and it displays signals from other timeframes. The indicator notifies about a signal by means of a pop-up Alert window, or sending notification to e-mail.
Parameters Time-frame - select timeframe to show indicator signals. Fast EMA Period - fast EMA. This is an exponential moving average from a price with a short period. Slow EMA Period - slow EMA. T
FREE

The EA will only remain free for a short time.
After that the price will change to -> 50$
Additionally
For every User leaving a Comment and Review i will provide Set-Files for different Symbols . Only comment and review my EA and send me a quick message.
After that i will provide you a link will all the Set-Files and important informations.
Quantum Nexus Pro
Quantum Nexus Pro is a scalping and hedging algorithm designed for traders who want to improve their trading strategies.
It us
FREE

The " Countdown Candle Timer " indicator is a visual tool for the MetaTrader 4 platform that displays an accurate countdown of the time remaining until the next candle on the chart. It provides real-time information about the remaining duration of the current candle, allowing traders to track time precisely and optimize their trading decision-making. The indicator can be customized in terms of color, font size, and position on the chart, providing flexibility and convenience to the user. You can
FREE

Whether trading stocks, futures, options, or FX, traders confront the single most important question: to trade trend or range? This tool helps you identify ranges to either trade within, or, wait for breakouts signaling trend onset.
Free download for a limited time! We hope you enjoy, with our very best wishes during this pandemic!
The issue with identifying ranges is some ranges and patterns are easy to miss, and subject to human error when calculated on the fly. The Automatic Range Identi
FREE

本指标 基于 Zigzag 基础上... 增加了: 1.增加了箭头指示,使图表更鲜明 2.增加了价格显示,使大家更清楚的看清价格. 3.增加了报警等设置,可以支持邮件发送 原指标特性: 1.基本的波段指标构型. 2.最近的2个ZIGZAG点不具有稳定性,随着行情而改变,(就是网友所说的未来函数) 3.原指标适合分析历史拐点,波段特性,对于价格波动有一定的指导性.
Zigzag的使用方法一 丈量一段行情的起点和终点 (1)用ZigZag标注的折点作为起点和终点之后,行情的走势方向就被确立了(空头趋势); (2)根据道氏理论的逻辑,行情会按照波峰浪谷的锯齿形运行,行情确立之后会走回撤行情,回撤的过程中ZigZag会再次形成折点,就是回撤点; (3)在回撤点选择机会进场,等待行情再次启动,止损可以放到回撤的高点。 一套交易系统基本的框架就建立起来了。 Zigzag的使用方法二 作为画趋势线的连接点 趋势线是很常见的技术指标,在技术分析中被广泛地使用。 但一直以来趋势线在实战中都存在一个BUG,那就是难以保证划线的一致性。 在图表上有很多的高低点,到底该连接哪一个呢?不同的书上画趋势线的方
FREE

It is a system with many options to help each user find their own settings. There are possibilities to use a filter based on two averages, as well as the choice of whether the system will work at certain hours of the market. The default settings are tested for the eurusd pair. I would recommend that each user do their own testing and find settings that suit their preferences. This is not a ready-made system that you will use without working on it. But it is a good tool to build each user a strat
FREE

YOU CAN NOW DOWNLOAD FREE VERSIONS OF OUR PAID INDICATORS . IT'S OUR WAY OF GIVING BACK TO THE COMMUNITY ! >>> GO HERE TO DOWNLOAD
The Volatility Ratio was developed by Jack D. Schwager to identify trading range and signal potential breakouts. The volatility ratio is defined as the current day's true range divided by the true range over a certain number of days N (i.e. N periods). The following formula is used to calculate the volatility ratio: Volatility Ratio (VR) = Today's True Range/T
FREE

Alan Hull's moving average, more sensitive to the current price activity than the normal MA. Reacts to the trend changes faster, displays the price movement more clearly. Color version of the indicator. Improvement of the original version of the indicator by Sergey <wizardserg@mail.ru>. Suitable for all timeframes.
Parameters Period - smoothing period, recommended values are from 9 to 64. The greater the period, the smoother the indicator. Method - smoothing method, suitable values are 0, 1, 2
FREE

Multi Divergence Indicator for MT4 - User Guide Introduction Overview of the Multi Divergence Indicator and its capabilities in identifying divergences across multiple indicators. Importance of divergence detection in enhancing trading strategies and decision-making. List of Indicators RSI CCI MACD STOCHASTIC AWSOME MFI ACCELERATOR OSMA MOMENTUM WPR( Williams %R) RVI Indicator Features Indicator Selection: How to enable/disable specific indicators (RSI, CCI, MACD, etc.) for divergence detection.
FREE
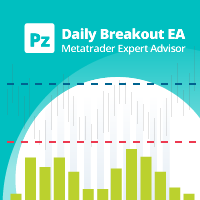
This EA trades daily breakouts placing bidirectional pending orders using the last day's trading range, provided these price levels have not been yet tested. It offers many trading behaviors and flexible position management settings, plus a martingale and inverse martingale mode. [ Installation Guide | Update Guide | Troubleshooting | FAQ | All Products ] Easy to use and supervise Customizable break-even, SL, TP and trailing-stop Works for ECN/Non-ECN brokers Works for 2-3-4-5 digit symbols Impl
FREE

Currency Strength Matrix (CSM) is an indicator that will show you the current strength of the major currencies in several timeframes, allowing you to sort the currencies for strength and spot possible trading setups. This indicator is ideal for scalping and in all those events of sudden big moves.
How does it work? The CSM compares the value of the current moving average with the same moving average in the previous candle for all the 28 pairs and all 9 timeframes, producing a Matrix of Strengt
FREE

This automated DOJI BAR FINDER INDICATOR can be utilized to manage trades and identify potential areas of support and resistance for both buying and selling. It is designed to identify zones for Sell/Buy trades and can be effectively used in conjunction with other indicators, such as order block indicators, and more. Currently designed for MT4, it will later be adapted to function on MT5. We also offer the opportunity to customize the robot according to your trading strategy. https://t.me/FXTSPr
FREE

Features:
This is a slope indicator for TMA Bands indicator. It calculates slope of the center line. It supports 3 types of TMA Bands: TMA True (Non-repaint) Fast Line TMA (Repaints) TMA+CG (Repaints) It will help you determine whether price is Trending or Ranging based on the Threshold you set. Download extra TMA Indicators for strategy here: https://www.mql5.com/en/blogs/post/758718
How It Works: You can set the Slope Threshold for indicating Buy/Sell heightened levels. Suppose we set Thr
FREE
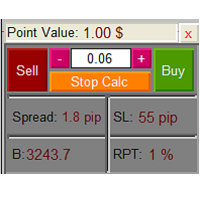
The Lot Calculation FJD is an expert for risk management for Meta Trader 4. This expert calculates the value of lot size for every position based on Trader’s given balance, Risk, and Stop loss. This expert is really user friendly, and calculates lot size with just a few clicks which helps traders specially the scalpers to open a position as quick as possible with respect to the Risk management.
The following inputs can be changed by the user: 1. Percentage of Risk per Trade (RPT %) 2. Balance
FREE

こちらのインジケーターはシンプルなトレンドラインのインジケーターです。 上側のトレンドラインは、過去のローソク足60足分の最高値と、過去のローソク足30足分の最高値、 下側は 過去のローソク足60足分の最安値と、過去のローソク足30足分の 最安値を結ぶトレンドラインです。 ※トレンドラインの線の色は白色となっております。
注意事項 上記の構成で作成されているインジケーターですので、過去のローソク足60足分と30足分の最高値、最安値が同じローソク足の場合、 トレンドラインは引かれませんので、ご注意くださいませ。
よくあるシンプルな構成のインジケーターとはなりますが、もしそれでもよろしければご利用ください。 良いトレードを!!
FREE

ゴールドエンジェルのEAへようこそ
とても安定した利益が見込めるEAです。
おすすめです。
ロジックは簡単です。
BANDインジケータを使用しています。バンドを価格がハズレた場合に、フラグがONになります。まだエントリーはしません。
そして価格の動きを注意深くモニターします。
価格がバンドの中に戻り、センターラインにタッチしたときに、順張りでエントリーします。シンプルですが、トレントが安定しているときは利益が大きいです。
特にXAUUSDにベストマッチします。
ただし、タイムフィルターを使うことが条件です。
ヨーロッパ時間や、ニューヨーク時間帯は、大きなボラティリティのため、利益がでません、タイムフィルターを使ってボラティリティの小さい時間帯を設定してください。
ストップロスは、逆のシグナルを使います。
またTPはトレーリングストップでクローズします。
また利益がマイナスでクローズした場合は、次のロットをあげます。設定で変更可能です。
FREE
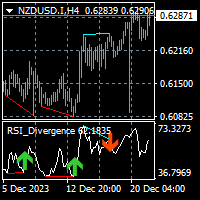
The indicator shows/alerts divergences of RSI indicator. note: You can check the free EA here that utilizes this indicator. repaint and lag issue Divergence indicators are usually repaint and lagging in their nature. You may have experienced in trading when you see a divergence on chart but the divergence continues further or just disappear. pivots_period input The smaller this value is the more and faster signals are generated. The greater this value you will have less and late signals. displa
FREE

Current indicator shows the trading sessions for the major financial centres: London New York Tokyo Sydney There are available two types of displaying zones: in sub window below the chart and on the chart. When the subwindow is selected, the sessions are shown in the form of bars. If the sessions are shown on the main chart, they are displayed in the form of lines at the open price of the session that may also act as a support and resistance for further price action during the trading day. The
FREE

このエキスパートアドバイザーは取引を行いませんが、マーケットウォッチ内のシンボル全体をスキャンし、異なる時間枠で各株を 1 つずつスキャンし、最後に、どの時間枠のどのシンボルが強力な巻き込みローソク足を持っているかを示します。
さらに、MA 期間と RSI の上限と下限を定義でき、どのタイムフレームのどのシンボルが調整済み移動平均を超えるか、また、どのタイムフレームのどのシンボルが調整移動平均の上限または下限を超えるかが表示されます。 RSI。
Kono ekisupātoadobaizā wa torihiki o okonaimasenga, mākettou~otchi-nai no shinboru zentai o sukyan shi, kotonaru jikan-waku de kaku kabu o 1-tsu zutsu sukyan shi, saigo ni, dono toki-waku no dono shinboru ga kyōryokuna makikomi rōsoku ashi o motte iru ka o shimeshimasu.
FREE

Peak Trough Analysis is the great tool to detect peaks and troughs in your chart. Peak Trough Analysis tool can use three different peaks and troughs detection algorithm. The three algorithm include the orignal Fractals Indicator by Bill Williams, the Modified Fractals indicator and ZigZag indicator. You can use this peak and trough analysis tool to detect the price pattern made up from Equilibrium Fractal-Wave process. For further usage, there are good guide line on how to use this peak trough
FREE

Multi Time Frame Indicator acts as a Scanner based on the Ichimoku Trading System. The outcome is displayed on a board. This helps you to make "at a glance" a mental picture of the System without having to open the chart. Up to 10 Currencies can be watched. Scanned elements And Legend "KUMO Futur" - Green : The Kumo Futur is Bullish. "KUMO Futur" - Red : The Kumo Futur is Bearish. "PRICE Cross KJ" - Green : The Price is Above the Kijun Sen. "PRICE Cross KJ" - Red : The Price is Below the Kijun
FREE
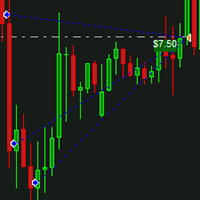
IceFX DrawProfit indicator can efficiently help those traders who want to see on the chart all closed positions output: profit or loss. If you set DrawProfit on your chart managed by an Expert Advisor (EA), you will clearly see its performance by its profits & losses.
Main Features: Draws closed order lines Draws profit/loss of closed orders in currency Sums orders by candles MagicNumber filter for EAs Comment filter
Input parameters: ShowProfitLabels : show profit of orders with a label Pro
FREE

Download the free USDJPY version here.
MACD Indicator The Moving Average Convergence and Divergence (MACD) is a trend following momentum indicator which shows the relationship between two moving averages that we chose and configure them on the indicator. The MACD is calculated by subtracting the 26-period exponential moving average and the 12 period D.A.M. These are the default parameters when you put the MACD indicator on the charts, and the period is usually 9 which means the last 9 candle
FREE

Dear Friend.. I share with you this simple Expert Adviser .. it is full automatic this Expert Adviser following the trend of the pair you install on or any stocks or indices , it is works like that: - when the trend on H4 chart show a start of up trend the expert will wait till the 15M & 1H charts show an up trend the EA will open a buy order directly , and do the same for down trend and open a sell order the buy or sell order lot size and take profit and stop loss will measured manually by
FREE

Introducing the TrendSurfer Collection: Ride the Waves of Forex Success
Are you tired of navigating the unpredictable waters of the forex market alone? Do you wish there was a way to surf the waves of currency trading with confidence and ease? Look no further than the TrendSurfer Collection—a revolutionary automated trading system designed to turn the tide in your favor.
TrendSurfer Collection gives you free access to one of the many profitable Expert Advisors from my TrendSurfer series.
FREE

Kelter Channel is a technical indicator designed to find overbought and oversold price areas, using a exponential moving average and ATR. And it implements a particularly useful twist: you can plot the bands of a higher timeframe in the current chart. [ Installation Guide | Update Guide | Troubleshooting | FAQ | All Products ] Find overbought and oversold situations Read data from higher timeframes easily The indicator displays data at bar opening The indicator is non-repainting Trading implica
FREE

The GapRev Forex EA
Watch here how to set the bot https://www.youtube.com/watch?v=2wCzTFIGNp4&feature=youtu.be This EA is created to work on all Time Frames and all Currency Pairs. Different settings possible SL and TP Trailing Stop Martingale The Ea is very good for longterm Growth Works best on higher Time Frames as there will be more data collected.
It works as well on cent accounts.Please trade carefully and responsibly.
Thank you and happy trading
FREE

Introducing ICT Reaction Levels, a reliable indicator designed to plot key levels on your chart. Unlike classical support and resistance, these levels are derived from significant highs and lows observed on higher timeframes, such as the weekly and monthly periods. The indicator provides a valuable tool for traders seeking to identify critical price levels based on historical price reactions.
ICT Reaction Levels analyzes price action on the specified timeframe, using special inputs to determi
FREE

Have you ever wanted to be able to catch a trend just as it is beginning? This indicator attempts to find the tops and bottoms of a trend. It uses in-built indicators and studies their reversal patterns. It cannot be used on its own it requires Stochastic(14) to confirm signal. Red for sell, Blue for buy. There are no parameters required just attach to a chart and it is ready to go. Check out other great products from https://www.mql5.com/en/users/augustinekamatu/seller A Winning Trading Stra
FREE

アカウントエクイティ保護ツールは、アカウントエクイティを保護するための必須ツールです。アカウントが複数の自動取引プログラムを同時に実行している場合、特に夜寝ている間にブラックスワンイベントや取引プログラムの障害が発生した場合、予期せぬ損失を被る可能性があります。このツールはこれらの問題を回避するのに効果的です。
設定は非常に簡単で、保護したい金額を入力するだけです。現在のアカウントエクイティに基づいて適切な設定をすることをお勧めします。設定が完了したら、「OK」をクリックしてプログラムのインターフェースに入り、「実行」をクリックします。右側に笑顔のアイコンが表示されることで、プログラムが正常に実行されていることがわかります。
アカウントのエクイティが設定された保護値を下回ると、すべてのチャートが即座に閉じられ、取引プログラムも停止します。同時に、すべての注文が削除され、アカウントは一切のリスクにさらされなくなります。
Equity Protect free MT4: https://www.mql5.com/en/market/product/115514 Equity
FREE

RSI With Alert
Relative strength index (RSI) indicator is a popular technical indicator in the family of oscillators.
RSI oscillates between 0 and 100 and traders use it to spot overbought and oversold states in the market.
Typically, a value above 70 means that the instrument is overbought and due to a retracement. A value below 30 means that the trading instrument is oversold.
RSI indicator strategies
This indicator allows you to get notifications when some conditions trigger. You c
FREE

Due to policy changes in MQL5.com, we cannot continue our free trial program here. However, you can request to test our EA in live account though here . Ophiuchus is the 13th zodiac and it is also the name for this EA as 13 is the key elements for this trading strategy. Trading Strategy
The following are the main characteristic of this EA. Martingale based strategy. Only open more trades when it is on the right direction. earn small profit for each trades but a lot of volume everyday. Profit
FREE
Like most things that work in trading, it's really simple. However, it's one of the most powerful tools I have that makes entries of many systems much more precise.
In its essence, it measures the recent volatility against the medium-term average. How does it work? Markets tend to be prone to strong trending movements when relative volatility is low and tend to be mean-reverting when relative volatility is high.
It can be used with both mean-reversion systems (like the Golden Pickaxe) an
FREE

The indicator synchronizes eight types of markings on several charts of one trading instrument.
This indicator is convenient to use in conjunction with "Multichart Dashboard" or other similar assistant that allows you to work with several charts at the same time.
"Multichart Dashboard" can be found under the link on my youtube channel.
Settings:
enable vertical line synchronization
enable horizontal line synchronization
enable Trend Line synchronization
enabling Fibonacci Retracement
FREE
Number one rule to investing is to protect your capital. Never worry about trading without stop loss or take profit with Auto S/L T/P. Auto S/L T/P will automatically add your preset default stop loss and take profit to any order on the chart it's installed. Be sure to enable auto trading in order for the EA to work.
Entering a trade on the go from your mobile is breeze with Auto S/L T/P running on the chart on your desktop. Just enter a trade and your default stop loss and take profit will be
FREE

This is the free version of the Supply&Demand + Trendline + Trend tool. This version works only with EURCHF! You find the full version here: https://www.mql5.com/en/market/product/67274
PAAIOS stands for Price Action All In One Solution. And that is the purpose of the Indicator. It should give you a tool to improve your trading decisively because you get the crucial information at a glance. The indicator simplifies the search for strong signals. It shows trend lines, demand and s
FREE

The market profile indicator provides with an X-Ray vision into market activity, outlining the most important price levels, value area and control value of the daily trading session. [ Installation Guide | Update Guide | Troubleshooting | FAQ | All Products ] Easy to understand and use Understand market dynamics easily Automatic timeframe selection Identify zones of trading value and discard others It is useful in all market conditions Effective for any trading strategy It implements three color
FREE

Welcome to Phoenix EA Generator MQL4! Welcome to the freedom of setting the rules and creating your own EA. Our mission is to provide you the tools you need to build your winning strategy. If you are tired of using EAs with unknown algorithms, if you have trading ideas you want to build, test and optimize, if you want an EA that is only watching the market and notifying you when certain conditions are met - than Phoenix EA Generator is the EA you are looking for. The EA has 2 modes : "Make trade
FREE

このプログラムは、複数の時間枠の分析をより便利にします。
同じシンボルを表示するために、異なる時間枠同期チャートのすべてのチャートを同期するのに役立ちます。 同じ特定の期間と同期図面オブジェクトすべてのチャートに同時に表示
このエディションでは、すべてのチャートを同期できるオブジェクトタイプは6つだけです。
描画オブジェクトタイプのサポート:垂直/水平線、近似曲線、長方形、矢印、フィボナッチリトレースメント
追加機能:トレンドラインアラート 価格がトレンドラインに触れたときにアラートを受け取りたい場合は、説明フィールドにトレンドラインのプロパティに「alert」という単語を入力するだけです。 価格がそのトレンドラインに達すると、MT4にアラートメッセージがポップアップ表示され、MT4アプリを介して通知を受け取ります
使い方>> https://youtu.be/NEHUW7v1h1c
問題を報告するか、最新バージョンの更新に従ってください。
ウェブサイト: www.RookieTraders.com LineID:@RookieTraders
FREE

Necessary for traders: tools and indicators Waves automatically calculate indicators, channel trend trading Perfect trend-wave automatic calculation channel calculation , MT4 Perfect trend-wave automatic calculation channel calculation , MT5 Local Trading copying Easy And Fast Copy , MT4 Easy And Fast Copy , MT5 Local Trading copying For DEMO Easy And Fast Copy , MT4 DEMO Easy And Fast Copy , MT5 DEMO 「協力QQ:556024」 「協力wechat:556024」 「協力メール:556024@qq.com」 トレンドインジケーター、 波動標準の自動計算 、 MT5バージョンの波動標準
FREE

The RSI Divergence Indicator is a powerful tool designed to identify potential reversals in the market by spotting discrepancies between the Relative Strength Index (RSI) and price movement. Divergences can be a significant indication of an impending trend change, either from bullish to bearish or vice versa. This indicator is built for making the task of identifying potential trade opportunities more straightforward and efficient.
Features: Automatic Detection: The indicator scans the chart
FREE

This is a trend indicator.
Timeframe: any Symbol: any Color meaning: blue: long trend, up trend red: short trend, down trend yellow: market trend is changing Feature: 1, very easy to use, obvious signal, profitable 2, suitable to work on charts of any timeframe 2, all type of alerts 3, standard data buffers, can be easily implanted into any EA program. 4, all color customizable.
wish you like it :)
FREE
パーシャルクローズアンドトレイル-アシスタントEA。ロールバック中にポジションの一部を閉じます(ロットの一部を閉じます)。 EAは、価格が最初に利益の方向に移動し、次に戻ってきたときに、部分的なクローズで収益性の高いポジションをクローズします。 完全な説明 +PDF 購入する方法
インストールする方法
ログファイルの取得方法 テストと最適化の方法 Expforex のすべての製品 EAは位置を監視します。 価格が利益の方向に移動する場合、eaは距離を置いてロールバック価格の最初のレベルを確立します。 価格が利益の方向に動き続ける場合、このレベルの利益はこのレベルのロールバックを変更し続けます。 価格が指定されたポイント数に戻ると、eaはポジションの一部をクローズします。 EAは、ポジションの次の部分がクローズされる次の価格レベルを設定します。 EAには、ポジションの一部がクローズされたときのストップロスのTrailingStopが含まれています。 EAは、ポジション全体がクローズされる限り機能し続けます。 ストラテジーテスターでエキスパートアドバイザー
FREE

This indicator tool provides mini charts, with adjustable symbol/tf that can be dragged into place. Lightweight operation with multiple mini charts are supported.
Chart features: adjustable symbol and tf draggable multiple mini charts color styling and font sizing, foreground/background colors candle coloring candle styles; candles, bars, line, high-low channel
zoom in/out
FREE

Clock GMT Live には、ブローカーについて詳しく知るために必要なすべての情報が含まれています。私が何の gmt を使用しているのか、または私のブローカーがどの gmt を使用しているのか疑問に思ったことは何度もありますが、このツールを使用すると、両方の GMT をリアルタイムで知ることができます。 ブローカーと現地時間の時間オフセット、ブローカーのpingも常に知ることができます 時間帯に置くだけで情報が得られる
買収ごとに価格が上昇します。これにより、独自の戦略を持つ人がほとんどいないように保護します 私の他の開発はここで見ることができます
正確なタイミングは、取引において重要な要素になる可能性があります。 現時点で、ロンドン証券取引所またはニューヨーク証券取引所はすでに開いていますか、それともまだ閉じていますか? FX取引の営業時間の開始時間と終了時間はいつですか? 手動でライブで取引するトレーダーにとって、これは大きな問題ではありません。 さまざまなインターネット ツール、金融商品の仕様、および時間自体を使用して、自分の戦略で取引する適切な時期をすばやく確認
FREE

zGold is an Expert Advisor built, designed and configured to be used with Gold/XAUUSD . The system uses custom Trend algorithms to find key entry points into the market and executes them once the right criteria is met and it uses a mixture of Indicators and Price Action. The Expert Advisor also has a custom filtering algorithm to disregard false signals and work around possible market reversals. To combat spread related issues the closing strategy is based around account profits, totals and cur
FREE

One Click Close MT4 is an EA which allows you close orders quickly. EA display on chart two buttons. The first button "Close All Positions" is using to close all opened orders. The second button "Close Profit Positions" is using to close only profitable orders. EA is closing orders for all available symbols, not only for chart symbol. In EA params you can set distance from upper chart frame (Y Offset) and from left chart frame (X Offset). For installation EA it is only need to copy One Click Clo
FREE

Time your Entry and Exits with Average True Range (ATR) Trailing Stops ATR Trailing Stops are primarily used to protect capital and lock in profits on individual trades but they can also be used, in conjunction with a trend filter, to signal entries. The indicator will help make your calculation of stop loss easier as it will be visually aiding you in choosing where to put your stoploss level on the chart by calculating the current value of ATR indicator. For those who are unfamiliar with ATR, i
FREE
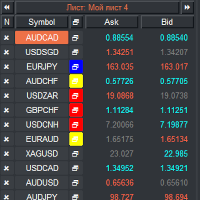
VRウォッチリストとリンカー - 端末用スクリーナーアプリケーション メタトレーダー 。最も興味深くテクニカルな金融商品を見つけやすくなります。このスクリーナーは、bybit、モスクワ取引所、アメリカン取引所、外国為替および暗号通貨市場、金属市場などの取引所での取引にトレーダーによって使用され、またプロップ会社の取引にも使用されます。金融商品の選択は手動で行われます。スクリーナーは、MetaTrader ターミナルで開いているチャートを接続し、金融商品を変更するときに各チャートのデータを個別に表示します。 設定、設定ファイル、デモ版、説明書、問題解決方法は、以下から入手できます。 > [ブログ]
レビューを読んだり書いたりできるのは、 [リンク]
のバージョン 【メタトレーダー5】 スクリーナーを使用すると、トレーダーは最もテクニカルな金融商品を見つけ、流動性が低くリスクの高い商品の取引を除外することができます。スクリーナーを使用すると、ティッカー付きのシートを簡単かつ迅速に作成および変更したり、シートにティッカーをすばやく追加および削除したりできます。すべてのチャート上のト
FREE
NOTE: THIS IS DEMO VERSION Yoy can only replay in 1 week ago and replay for 20 bars. BUY FULL VERSION : https://www.mql5.com/en/market/product/73798 __________________________________________________ This EA - Tool allow you replay bar in Meta Trader 4 for back test. This Tool can back test in multi timeframe in only one chart. This Tool is very useful for Price action trader. It can work with Indicators, some indicators cannot works. Main feature: Candlestick forward and backward to Backte
FREE

The Heikin Ashi indicator is our version of the Heikin Ashi chart. Unlike competitor products, this indicator offers extensive options for calculating Heikin Ashi candles. In addition, it can be displayed as a classic or smoothed version.
The indicator can calculate Heikin Ashi with moving average by four methods: SMA - Simple Moving Average SMMA - Smoothed Moving Average EMA - Exponential Moving Average LWMA - Linear Weighted Moving Average
Main features The indicator shows Heikin
FREE
Scalper Mars EA uses intraday scalping strategy. The Expert Advisor uses standard indicators MACD, RSI, EMA in its trading, does not use martingale and an order grid. A stop order is placed near local extrema, if it does not exceed the maximum value specified by the MaxStopLoss parameter. The EA uses take profit equal to the stop. The Expert Advisor is influenced by news releases. Requirements Recommended for work on the M1 timeframe. It can be traded on any currency pairs, when calculating resu
FREE

BIG CANDLE ALERT https://www.mql5.com/en/users/earobotkk/seller#products P/S: If you like this indicator, please rate it with 5 stars in the review section, this will increase its popularity so that other users will be benefited from using it. This indicator draws a bullish and bearish vertical line inside a candle whenever the size of a candle body exceeds the minimum size specified in the input. INPUT Bullish Candle Color: choose the color of your choice. Bearish Candle Color: choose the co
FREE

Trading Keys is an advanced and easy to use risk calclator. Features: Drag and drop visual lines to take profit/stop loss/ entry levels. Risk calculation based on account balance / quity percentage per trade. Profit protection and trailing toggle button Auto break even toggle button Risk calculation for prop firms based on drawdown level How to setup your Trading Keys? Add trading keys to your chart Setup the parameters Save the chart as default template "Default.tpl" How to use Trading keys? C
FREE
This indicator was created based on a multi-time trend monitoring system by combining several trend signals into 1 signal in the panel. This indicator is also equipped with an alert feature. Try to master how to reveal Fibo Weasel Candle Break Reetes to make it easier to use this indicator. for entry we only monitor the signal in the top left corner for the ongoing trend as a trading reference For the risk reward reference, we use the Fibo Weasel withdrawal reference which is in the same direct
FREE
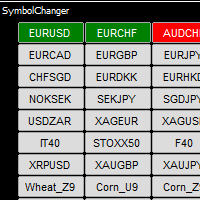
Symbol Chart Changer is an indicator/utility that offers you the option to switch between symbols and timeframes. You can choose any symbol and timeframe on the same chart with just a few clicks. In addition, this indicator also shows the profit of the symbol through the color of the buttons. For MT5: Symbol Chart Changer for MT5 Features
All symbols selected in MarketWatch, that allow you to monitor your favorite instruments on the same chart. Works smoothly on any symbol/instrument, accou
FREE

INFOPadはMetaTrader 4ターミナルで選択された通貨ペアに関する情報を作成する情報パネルです。 この指標には5つの機能があります。 選択したシンボルの主および主な情報を表示します。売値、スプレッド、ストップレベル、スワップ、ティック値、コミッション価格。 SL目標とTP目標(確立されたストップロスとテイクプロフィットのポイント数、ドル額)の将来の目標を示します。 今日、週、月、年、選択した通貨の総利益などの期間に受け取った利益が表示されます。 それは現在のオープンポジション、そのロット(ボリューム)、ポジション数、ポイントでのポジションの利益、ドル、パーセントを表示します。 オープンディールのチャートに追加情報を表示します。それはストップロスを示し、利益レベルとこれらのストップレベルの目標を取ります。 トランザクションがシンボルに対して開かれたとき、トランザクションが閉じられたとき、トランザクションが変更されたときに、ログファイルに情報を書き込みます。 取引の開始時、取引の終了時、取引の変更時にサウンドファイルを再生します。 トランザクションを開くとき、トランザクション
FREE
This EA trades using the RSI Indicator. It offers many trading scenarios and flexible position management settings, plus many useful features like customizable trading sessions, a martingale and inverse martingale mode. [ Installation Guide | Update Guide | Troubleshooting | FAQ | All Products ] Easy to use and supervise It implements three different entry strategies Customizable break-even, SL, TP and trailing-stop Works for ECN/Non-ECN brokers Works for 2-3-4-5 digit symbols Trading can be NF
FREE

速度の抵抗ラインは傾向および抵抗ラインを定めるための強力な用具である。 この指標は、チャートの極値と特別な数式を使用して線を構築します。 指標は、トレンドの方向とピボットポイントを決定するために使用することができます。
<---------------------------->
指標パラメータ:
"Depth of search" -チャートの極端な検索の深さ(バー単位) "Back step of search" -極端な間の最小距離(バー単位) "Deviation of price" -同じタイプの両極端間の許容価格差 "Line color" -対応するインデックスを持つ線の色 "Line style"-対応するインデックスを持つラインスタイル "Line width"-対応するインデックスを持つ線幅 <---------------------------->
あなたは本の中でより多くの情報を見つけることができます"エドソン*グールドによる希少な著作のコレクション"またはプライベートメッセージで私
<------------------
FREE

The robot opens one Buy and one Sell position as soon as it is loaded onto the desired symbol. Regardless of the market direction, it closes the profitable position and multiplies the losing position by the coefficient specified in the robot settings to open a new position. The average cost of all opened positions is determined based on their lot weights. Then, the profit ratio specified in the robot settings is added to this average cost, and positions in the same direction are closed with a pr
FREE

Round Numbers Levels indicator for MT4 Round Numbers indicator is a simple but useful indicator to draw 00 and 50 price levels in your chart.
These levels act as supports and resistances, and therefore should be taken into account when trading.
These levels can be used as profit targets or entry points.
Inputs of the indicator are:
TGridColor00: color to be used for xx00 levels GridStyle00: line style to be used for xx00 levels GridWidth00: line width to be used for xx00 levels GridCol
FREE
MetaTraderマーケットはトレーダーのための自動売買ロボットやテクニカル指標を備えており、 ターミナルから直接利用することができます。
MQL5.community支払いシステムはMetaTraderサービス上のトランザクションのためにMQL5.comサイトに登録したすべてのユーザーに利用可能です。WebMoney、PayPal または銀行カードを使っての入金や出金が可能です。
取引の機会を逃しています。
- 無料取引アプリ
- 8千を超えるシグナルをコピー
- 金融ニュースで金融マーケットを探索
新規登録
ログイン