
かぎ足チャート用インジケーター

イントロダクション
"ポイント・フィギュアチャート用インジケーター"という記事は、ポイント・フィギュアチャートを作成するプログラミング方法の一つを紹介しています。このチャートは、19世紀から知られています。しかし、これは昔からある唯一のチャートではありません。金融市場の古くからある別の表現として、かぎ足チャートがあります。このチャートは以前の記事にて紹介されています。
株式交換 - 19世紀の日本になじみのない金融機関が1878年5月に設立されました。それは、今日では東京証券取引所として知られています。このイベントは、かぎ足チャートの作成において大きな役割を担っていました。西欧諸国は、Steve NIsonの"Beyond Candlesticks: New Japanese Charting Techniques Revealed"が出版された1994年以降にかぎ足チャートを知るようになりました。
日本語の「かぎ」は、チャートが生まれた当時に使用されていたL時のキーを意味します。また、名前の修正版として– "キーチャート"があります。Steve Nisonの"Beyond Candlesticks"では、チャートの代替名を見つけることができます;価格帯チャート、フックチャート、チェインチャートなどです。
このチャートの特別な点は何でしょうか?主な特徴は、価格を一つに残した時間軸を無視する点です(日本のロウソク足、バーや線と異なります。)したがって、そのチャートは、最も重要なものを残し、重要でない価格の変動は隠すのです。
そのチャートは、マーケットの状況に応じて、線を取り替えるYangとYingを代表します。市場が同方向に進んだ場合、その線は、新しい価格帯に達します。しかし、もしマーケットが定義された量に達した場合、カギ線は、新しいコラム内、逆の方向に描かれます。すでに定義されている量はポイントか(現在の通貨ペアに用いられます)、現在の価格のパーセント率に設定されています。線の太さは、最も近いHighか、Lowに基づいて変わります。
1. チャートの〇
EURUSD、10月8日から11日までのHIの履歴データを使用しましょう。
15ポイントの逆の出発点による標準の画像生成の例が図1にて表示されています:
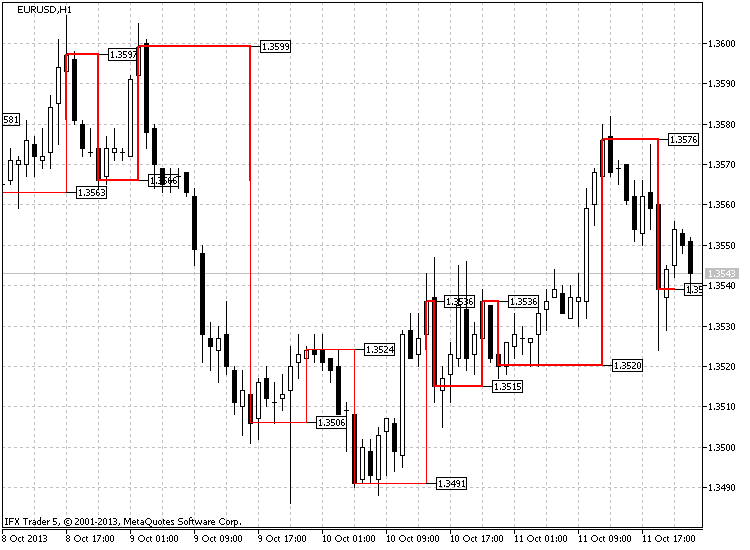
図1. カギチャート、EURUSD H1
ご覧の通り、価格は17:00から下がり始めました。降下移動は、21:00まで続いています。22:00に、その価格は1.3566から上に動き、1.3574にて終了します。言い換えれば、価格は11ポイントを渡します。これは、リバースにおいては十分ではないですが、新しいLowは達っせられていません。次の新しい二時間にて、その価格は直線移動を始め、最終的に(10月9日)1:00に強い上方への移動があり、それは25ポイントからなる1.33591にて終了しています。これは、価格が逆にあがったことを意味します。
上方へのトレンドは以下の時間続きます。その価格は、太いYang線を補強する1.3599に達します。03:00時に、その価格は1.3578まで落ちクローズします。それは、以前のHigh(1.3599-1.3578)から21ポイントあります。これは、リバースに十分以上のものです。その線は降下しますが、形は保ちます(太いYang線)
16:00までその価格は降下し、最後に、最小値近くまで突破し、Yang線からYin線に変更します。以前言及されていた1.3566のLow値は、突破価格として機能します。その価格は、Yin線として移動し続け、10/10 14:00にY1.3524のHigh値を突破し、Yang線に変わります。この例は、どのようにかぎ足チャートが形成されるかについて紹介しました。
2. かぎ足インジケーターチャート化の原則
現在のタイムフレームからインジケーターを独立させるために、インジケーターが形成されるはずであったタイムフレームのデータをコピーし、取得したデータを用いてインジケーターを作成しなければなりません。
これにより、かぎ足チャートの技術的分析の境界を拡大し、シングルチャートにて同時にいくつかのタイムフレームを調査できるようになります。このインジケーター自体は、個別のウィンドウに位置していますが、メインチャートに表示することもできます。言い換えれば、基礎的な形成は、インジケーターウィンドウにて実行されるということです。インジケーターは、メインチャートにコピーされ、価格やタイムマークが描画されます。(設定に基づきます。)
以前述べられた通り、インジケーターは、標準・修正版の両方でチャートを描写します。標準版は、上記にて紹介されています。それでは、修正版を見てみましょう。
新しいアイディアかはわかりませんが、そのようなバージョンは聴いたことがありませんでした。追加のフィルターの考えは、リバースポイントだけではなく、チャートの動きもフィルタリングされます。言い換えれば、その価格は新しいHighやLowが形成されるよう、特定の距離を移動します。一般的に、価格がどこに動いても、まず特定の距離をカバーします。その後、トレンド継続かリバースなのかが定義されます。
図2は、どのようにその原則が作動するかを示します。修正版チャートは、青色で、標準版は赤色で表示されています。ご覧の通り、修正版は、価格の変化に反応し、大半のマイナーなシグナルをフィルタリングします。
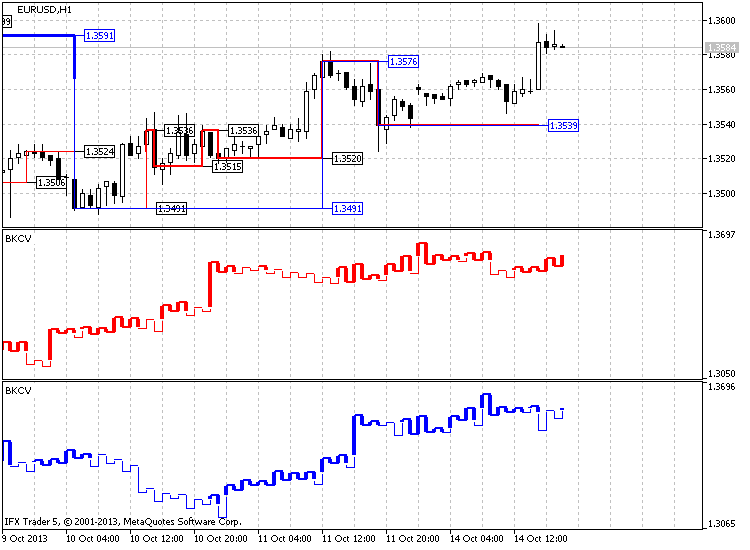
図2. かぎ足チャートの作成の標準(赤)・修正(青)バージョン
かぎ足チャートとは別に、インジケーターは、インジケーターウィンドウとメインチャートの両方に追加の要素を提供します。
設定に応じて、そのマークはインジケーターにセットすることができます。これらのマークはリバース価格のデータを提供しています。同じ機能は、価格レベルを用いて実装でき、それは各チャートのリバース時やインジケーター形成時に用いられる価格レンジにて分配します。色は、3つのバージョンにてセットできます:リバースの種類(アップかダウン)、線の種類(YinかYang)、色の変更なしの3つです。
リバース価格マークは一時的なものも含めてメインチャートにて提供されています。これらのマークはシングルカラーかもしれませんし、YinかYang線の色に応じて変更するかもしれません。
インジケーターのコードは、グローバル変数を通して違いに連絡を取る関数を用いて実装されます。
そのコードは、3つの主な関数と追加の11の関数に分けられます。計算の主な負担や基礎的なグラフィックの形成のバッファー入力、追加のバッファー配列はインジケーターウィンドウのかぎ足チャートの形成の関数に依存しています。そのほかの二つの関数は、データの提供を担当しています:最初の関数は時間データをコピーし、別の関数は選択されたタイムフレームのバーごとの価格に関するデータをコピーします。
残りの補助関数は、すべてのものの形成やオブジェクトの削除、インジケーターのアンロード、インジケーターオブジェクトの削除、リバースパラメーターの計算、メインチャート、インジケータウィンドウでのマークの描写、「トレンド線」のグラフィカルオブジェクトの作成、メインチャートへのかぎ足の描写、インジケーターの形成を始めるための新規バーの到着の定義などを担当しています。
3. インジケーターのコードとアルゴリズム
インジケーターのコードと形成におけるアルゴリズムを詳しく見ていきましょう。そのコードはとても大きく、初心者プログラマーが理解するにはかなり難しいです。その関数はグローバル変数を通して違いに連絡を取り合い、コードをより複雑にしています。記事のこの部分では、それぞれの関数とコードを個別に説明します。まず、インジケーターの設定を紹介します。初期関数をコピーしているデータに関する明確化、リバースパラメーターの計算、カギ足チャートの形成における関数とその他の補助関数を紹介します。
3.1. インジケーター入力パラメーター
そのコードは、12のバッファーと8のインジケーターグラッフィクの形成と、個別ウィンドウでのインジケーターの宣言により始まります。まずは、"histograms"と6つの "lines"を含めて8つのグラッフィクの形成が用いられている理由を定義しましょう。それぞれの"histogram"は各自の垂直線を作成します。その線のうちの一つはYin線を担当し、そのほかのものはYang線を担当します。
その場合は、各線にそれらのうちの3つがあり、「線」においてより複雑になります。これは、最初のポイントの近くにて描かれているその他のポイントがある場合、その線が描画されるという事実によるものです。言い換えれば、違いに類似した二つの線を描くための、二つの"line"グラフィカルオブジェクトを必要とします。しかし、もしこれらのラインが必要なポイントをスキップするために必要であれば、その他の二つとローテーションする3番目の線が必要です。
これは、図3にて説明されており、二つの「線」のグラフィカルオブジェクトが用いられた際に何が起こるかを見ることができます。
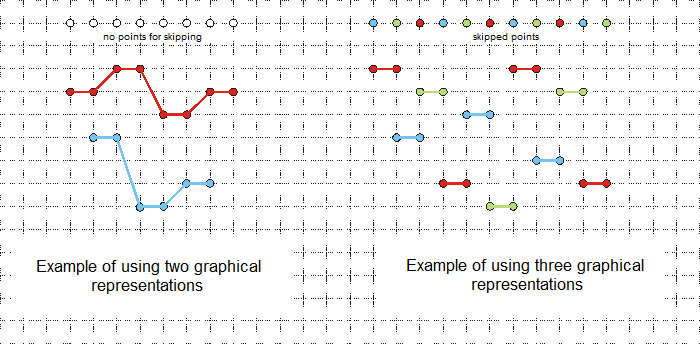
図3. 2、3つの「線」のオブジェクトを用いて、「肩」と「腰」の線を表示する例
それでは、設定メニューが作成されました。5つの列挙型があります(入力パラメーターにて詳しく見ていきます。)
最初の入力パラメーター「Period」は、オブジェクトの形成が実行される機関であり、チャートの更新機関である「period_to_redraw」が後に続きます。そして最後の時間パラメーターは「start_data」で、オブジェクトの作成が始まる時刻を示します。
これらのパラメーターは、チャートの作成や追加のラベリングに続きます:
- kagi_type – ユーザーによって定義されるチャート形成種類、標準か修正版か:
- price_type – 形成にて用いられる価格の種類:Close, Open, High, Low;
- type_doorstep – 用いられるリバースの種類:ポイントとパーセンテージ;
- doorstep – リバース値(上記のパラメーターに依存するポイント・パーセンテージ値にて明記されます);
- color_yin – インジケーターウィンドウのYin 線の色
- color_yang – インジケーターウィンドウでのYang線の色;
- width_yin – インジケーターウィンドウでのYin線の幅;
- width_yang – インジケーターウィンドウでのYang線の幅;
- levels_on_off – 価格レベルがインジケーターウィンドウにて描画されるか否かについて;
- levels_type – インジケーターウィンドウでの価格レベルの種類. 選択できる二つの値があります;各リバース値か、価格レンジの間の値です;
- levels_number – インジケーターウィンドウの価格レベル数;
- levels_change_color – 価格レベル線の色の変更を供します;オプションとして、上方か下方のリバース、YingとYang線、色無しがあります;
- levels_first_color – 価格レベルの最初の色;
- levels_second_color – 価格レベルの二番目の色;
- label_1 – インジケーターウィンドウのチャートのリバース価格用ラベル;
- label_1_number – インジケーターウィンドウで表示されたラベル数;
- label_1_color – インジケーターウィンドウの価格ラベルの色;
- label_2 – メインチャートの価格ラベル;
- label_2_color – メインチャートのラベル色;
- time_line_draw – メインチャートのリバース時間の線;
- time_separate_windows – メインチャートのリバース時間の線の継続;
- time_line_change_color – YinかYang線のリバースラベルに依存する時間線の色の変更を行います。
- time_first_color – メインチャートの時間線の最初の色;
- time_second_color – メインチャートの時間線の二番目の色;
- kagi_main_chart – かぎ足がメインチャートに描かれるべきか否かについて;
- color_yin_main – メインチャートでのYin線の色;
- color_yang_main – メインチャートのYang線の色
- width_yin_main – メインチャートのYin 線の幅;
- width_yang_main – メインチャートのYang線幅;
- magic_numb – オブジェクトの作成やその削除に用いられるマジック数、シングルチャートにていくつかのインジケーターを起動するためのインジケーター名におけるマジック数。
これらのパラメーターは、インジケーターバッファーや、価格と時間の値を保持する補助バッファー、補助変数(top_data, bars_copied, bars_copied_time, copy_history, copy_time)、どのYinやYang線にてチャートの動きに変化が起こったかについてのデータを保持するデータ、その変化の時間と価格、中央価格の宣言などが続きます、(YinがYangに変わった場合など)最後に、「a」チャートの変化の数に関するデータを持つ最も使用されるグローバル変数の一つが宣言されます。
//+------------------------------------------------------------------+
//|                                                         BKCV.mq5 |
//|                                   Azotskiy Aktiniy ICQ:695710750 |
//|                          https://www.mql5.com/ru/users/Aktiniy |
//+------------------------------------------------------------------+
//--- Build Kagi Chart Variable
#property copyright "Azotskiy Aktiniy ICQ:695710750"
#property link      "https://www.mql5.com/ja/users/Aktiniy"
#property version   "1.00"
#property description "Build Kagi Chart Variable"
#property description " "
#property description "This indicator makes drawing a chart Kagi as a matter of indicator window, and in the main chart window"
#property indicator_separate_window
#property indicator_buffers 12
#property indicator_plots   8
//--- plot Yin
#property indicator_label1  "Yin"
#property indicator_type1   DRAW_HISTOGRAM2
#property indicator_color1  clrRed
#property indicator_style1  STYLE_SOLID
#property indicator_width1  1
//--- plot Yin1
#property indicator_label2  "Yin1"
#property indicator_type2   DRAW_LINE
#property indicator_color2  clrRed
#property indicator_style2  STYLE_SOLID
#property indicator_width2  1
//--- plot Yin2
#property indicator_label3  "Yin2"
#property indicator_type3   DRAW_LINE
#property indicator_color3  clrRed
#property indicator_style3  STYLE_SOLID
#property indicator_width3  1
//--- plot Yin3
#property indicator_label4  "Yin3"
#property indicator_type4   DRAW_LINE
#property indicator_color4  clrRed
#property indicator_style4  STYLE_SOLID
#property indicator_width4  1
//--- plot Yang
#property indicator_label5  "Yang"
#property indicator_type5   DRAW_HISTOGRAM2
#property indicator_color5  clrRed
#property indicator_style5  STYLE_SOLID
#property indicator_width5  2
//--- plot Yang1
#property indicator_label6  "Yang1"
#property indicator_type6   DRAW_LINE
#property indicator_color6  clrRed
#property indicator_style6  STYLE_SOLID
#property indicator_width6  2
//--- plot Yang2
#property indicator_label7  "Yang2"
#property indicator_type7   DRAW_LINE
#property indicator_color7  clrRed
#property indicator_style7  STYLE_SOLID
#property indicator_width7  2
//--- plot Yang3
#property indicator_label8  "Yang3"
#property indicator_type8   DRAW_LINE
#property indicator_color8  clrRed
#property indicator_style8  STYLE_SOLID
#property indicator_width8  2
//--- Enumerations as input data (for more attractive setting)
//--- Kagi charting type
enum kagi_type_enum
  {
   classic=0,  // Classic
   modified=1, // Modified
  };
//--- Type of the price used for construction
enum price_type_enum
  {
   c=0, // Close
   o=1, // Open
   h=2, // High
   l=3, // Low
  };
//--- Type of the used reversal
enum type_doorstep_enum
  {
   point=0,   // Point
   procent=1, // Percent
  };
//--- Type of levels location
enum levels_type_enum
  {
   cor=0, // Cornering
   equ=1, // Equal distance
  };
//--- Level colors change type (works when "Type of levels location"="Cornering")
enum levels_change_color_enum
  {
   up_down=0,  // Up & Down
   yin_yang=1, // Yin & Yang
   no=2,       // Don't change
  };
//--- input parameters
input ENUM_TIMEFRAMES period=PERIOD_CURRENT;                // Calculation period to build the chart
input ENUM_TIMEFRAMES period_to_redraw=PERIOD_M1;           // Refresh period chart
input datetime start_data=D'2013.07.10 00:00:00';           // Start time to build the chart
input kagi_type_enum kagi_type=classic;                     // The type to build Kagi chart
input price_type_enum price_type=c;                         // Price used to build chart
input type_doorstep_enum type_doorstep=point;               // Type calculate doorstep
input double   doorstep=25;                                 // Doorstep reversal
input color    color_yin=clrRed;                            // Color Yin line (indicator window)
input color    color_yang=clrRed;                           // Color Yang line (indicator window)
input char     width_yin=1;                                 // Width Yin line (indicator window)
input char     width_yang=2;                                // Width Yang line (indicator window)
input bool     levels_on_off=false;                         // Draw level (indicator window)
input levels_type_enum levels_type=cor;                     // Type of drawing levels (indicator window)
input uint     levels_number=6;                             // Number of levels  (indicator window)
input levels_change_color_enum levels_change_color=up_down; // Type change color of levels (indicator window)
input color    levels_first_color=clrBeige;                 // The first color of level (indicator window)
input color    levels_second_color=clrCoral;                // The second color of level (indicator window)
input bool     label_1=true;                                // Draw price label on (indicator window)
input uint     label_1_number=10;                           // The number of labels (indicator window)
input color    label_1_color=clrGreenYellow;                // The color of labels (indicator window)
input bool     label_2=true;                                // Draw price label on (main chart)
input color    label_2_color=clrGreenYellow;                // The color of labels (main chart)
input bool     time_line_draw=true;                         // Draw a timeline reversal (main chart)
input bool     time_separate_windows=false;                 // Draw a timeline reversal on indicator window
input bool     time_line_change_color=true;                 // Different color timeline on the Yin and Yang lines (main chart)
input color    time_first_color=clrRed;                     // The first color of timeline (main chart)
input color    time_second_color=clrGreenYellow;            // The second color of timeline (main chart)
input bool     kagi_main_chart=true;                        // Draw Kagi on main chart (main chart)
input color    color_yin_main=clrRed;                       // Color Yin line (main chart)
input color    color_yang_main=clrRed;                      // Color Yang line (main chart)
input char     width_yin_main=1;                            // Width Yin line (main chart)
input char     width_yang_main=2;                           // Width Yang line (main chart)
input long     magic_numb=65758473787389;                   // The magic number for drawing objects
//--- indicator buffers
double         YinBuffer1[];
double         YinBuffer2[];
double         Yin1Buffer[];
double         Yin2Buffer[];
double         Yin3Buffer[];
double         YangBuffer1[];
double         YangBuffer2[];
double         Yang1Buffer[];
double         Yang2Buffer[];
double         Yang3Buffer[];
//--- additional variables
double Price[]; // Buffer for storing the copied price data
double Time[];  // Buffer for storing the copied time data
//---
datetime stop_data;      // Current time
int bars_copied=0;       // Number of the already copied bars from the initial date
int bars_copied_time;    // Number of the already copied bars having the initial date
bool copy_history=false; // Price history copying result
bool copy_time=false;    // Time history copying result
//---
datetime time_change[];      // Array for writing the time when the chart movement started changing (up or down)
char time_line[];            // Array for storing the data on what line (Yin=0 or Yang=1) direction has changed
double time_change_price[];  // Array for writing the chart movement change price
double time_central_price[]; // Array for writing the average price during the chart movement change

uint a=0; // Variable for building the chart, number of chart reversals is fixed
3.2. インジケーターの初期化関数
次は、インジケーターの初期化関数です。インジケーターバッファーやそのインデックス化(主に時系列としてです;カギ足チャートはメインのチャートよりも短いので、後ろ向きに描く方が良いです)はここで明記されます。また、スクリーンに表示されていない値がセットされます( EMPTY_VALUE = -1)
それでは、インジケーター名を割り当て、正確性を表示しましょう。以前述べた通り、マジック数は名前に追加されます。これは、ChartWindowFind()関数の正確な処理を提供するために実行されます。さもなければ、インジケーターウィンドウにて描かれたグラフィカルオブジェクトは、最初に起動されるインジケーターにて表示されます。(もしシングルチャート上のいくつかのインジケーターが使用された場合です。)
次に、名前をチャート線に割り当て、インジケーターウィンドウの現在の数値の表示を禁止し、YinとYang線の色と幅を設定、インジケーターウィンドウにて表示される価格レベルの数値を設定します。
//+------------------------------------------------------------------+
//| Custom indicator initialization function                         |
//+------------------------------------------------------------------+
int OnInit()
  {
//--- indicator buffers mapping
   SetIndexBuffer(0,YinBuffer1,INDICATOR_DATA);
   ArraySetAsSeries(YinBuffer1,true);
   SetIndexBuffer(1,YinBuffer2,INDICATOR_DATA);
   ArraySetAsSeries(YinBuffer2,true);
   SetIndexBuffer(2,Yin1Buffer,INDICATOR_DATA);
   ArraySetAsSeries(Yin1Buffer,true);
   SetIndexBuffer(3,Yin2Buffer,INDICATOR_DATA);
   ArraySetAsSeries(Yin2Buffer,true);
   SetIndexBuffer(4,Yin3Buffer,INDICATOR_DATA);
   ArraySetAsSeries(Yin3Buffer,true);
//---
   SetIndexBuffer(5,YangBuffer1,INDICATOR_DATA);
   ArraySetAsSeries(YangBuffer1,true);
   SetIndexBuffer(6,YangBuffer2,INDICATOR_DATA);
   ArraySetAsSeries(YangBuffer2,true);
   SetIndexBuffer(7,Yang1Buffer,INDICATOR_DATA);
   ArraySetAsSeries(Yang1Buffer,true);
   SetIndexBuffer(8,Yang2Buffer,INDICATOR_DATA);
   ArraySetAsSeries(Yang2Buffer,true);
   SetIndexBuffer(9,Yang3Buffer,INDICATOR_DATA);
   ArraySetAsSeries(Yang3Buffer,true);
//--- add the buffer for copying data on prices for calculation
   SetIndexBuffer(10,Price,INDICATOR_CALCULATIONS);
//--- add the buffer for copying data on bar open time for construction
   SetIndexBuffer(11,Time,INDICATOR_CALCULATIONS);

//--- set what values are not to be drawn
   for(char x=0; x<8; x++)
     {
      PlotIndexSetDouble(x,PLOT_EMPTY_VALUE,-1);
     }
//--- set the indicator's look
   IndicatorSetString(INDICATOR_SHORTNAME,"BKCV "+IntegerToString(magic_numb)); // Indicator name
   IndicatorSetInteger(INDICATOR_DIGITS,_Digits); // Display accuracy
//--- assign names to graphical constructions
   PlotIndexSetString(0,PLOT_LABEL,"Yin");
   PlotIndexSetString(1,PLOT_LABEL,"Yin");
   PlotIndexSetString(2,PLOT_LABEL,"Yin");
   PlotIndexSetString(3,PLOT_LABEL,"Yin");
   PlotIndexSetString(4,PLOT_LABEL,"Yang");
   PlotIndexSetString(5,PLOT_LABEL,"Yang");
   PlotIndexSetString(6,PLOT_LABEL,"Yang");
   PlotIndexSetString(7,PLOT_LABEL,"Yang");
//--- prohibit display of the results of the current values for graphical constructions
   PlotIndexSetInteger(0,PLOT_SHOW_DATA,false);
   PlotIndexSetInteger(1,PLOT_SHOW_DATA,false);
   PlotIndexSetInteger(2,PLOT_SHOW_DATA,false);
   PlotIndexSetInteger(3,PLOT_SHOW_DATA,false);
   PlotIndexSetInteger(4,PLOT_SHOW_DATA,false);
   PlotIndexSetInteger(5,PLOT_SHOW_DATA,false);
   PlotIndexSetInteger(6,PLOT_SHOW_DATA,false);
   PlotIndexSetInteger(7,PLOT_SHOW_DATA,false);
//--- set color for Yin line
   PlotIndexSetInteger(0,PLOT_LINE_COLOR,color_yin);
   PlotIndexSetInteger(1,PLOT_LINE_COLOR,color_yin);
   PlotIndexSetInteger(2,PLOT_LINE_COLOR,color_yin);
   PlotIndexSetInteger(3,PLOT_LINE_COLOR,color_yin);
//--- set color for Yang line
   PlotIndexSetInteger(4,PLOT_LINE_COLOR,color_yang);
   PlotIndexSetInteger(5,PLOT_LINE_COLOR,color_yang);
   PlotIndexSetInteger(6,PLOT_LINE_COLOR,color_yang);
   PlotIndexSetInteger(7,PLOT_LINE_COLOR,color_yang);
//--- set Yin line width
   PlotIndexSetInteger(0,PLOT_LINE_WIDTH,width_yin);
   PlotIndexSetInteger(1,PLOT_LINE_WIDTH,width_yin);
   PlotIndexSetInteger(2,PLOT_LINE_WIDTH,width_yin);
   PlotIndexSetInteger(3,PLOT_LINE_WIDTH,width_yin);
//--- set Yang line width
   PlotIndexSetInteger(4,PLOT_LINE_WIDTH,width_yang);
   PlotIndexSetInteger(5,PLOT_LINE_WIDTH,width_yang);
   PlotIndexSetInteger(6,PLOT_LINE_WIDTH,width_yang);
   PlotIndexSetInteger(7,PLOT_LINE_WIDTH,width_yang);
//--- set the number of levels in the indicator window
   IndicatorSetInteger(INDICATOR_LEVELS,levels_number);
//---
   return(INIT_SUCCEEDED);
  }
3.3. データコピー関数
それでは、データコピー関数を詳しく見ていきましょう。
ここにその内の二つがあります。最初のものは、価格のコピー用で、二つ目は、各バーのオープン時刻のコピー用です。両方とも以前宣言されたインジケーターの計算用バッファーの値を保持します。
まず、価格コピー関数を考えてみましょう。関数入力パラメーター;データの保持のための配列、開始・終了時刻をコピーしているデータその関数は、中間配列にコピーされるデータ(バー)の数、中間動的配列、中間配列にコピーされるバーの数のための変数を持ちます。バーの数は、特定の期間のバーの総合数と、以前の関数の呼び出し時にコピーされたバーの数に基づき計算されます。
もしそれが最初のコピーされたデータでない場合、最後にコピーされたバーのデータが更新される必要があります。このために、一つコピーされるバーの数を減らし、新しくコピーされるバーの数を一つ増やします。バーをコピーする準備を行う中間配列のサイズを変更します。
設定に応じて、価格を中間配列にコピーします。コピーがうまくいけば、そのデータは、中間配列からバッファー配列の最後にコピーされ、正の解を関数に割り当て、コピーされるバーの数に関するデータを保持するグローバル変数を更新します。この方法により、コピー時刻を削除するバーのみをコピーできます。
//+------------------------------------------------------------------+
//| Func Copy History                                                |
//+------------------------------------------------------------------+
bool func_copy_history(double &result_array[],
                       datetime data_start,
                       datetime data_stop)
  {
//---
   int x=false; // Variable for answer

   int result_copy=-1; // Number of copied data

   static double price_interim[]; // Temporary dynamic array for storing copied data
   static int bars_to_copy;       // Number of bars for copying

   bars_to_copy=Bars(_Symbol,period,data_start,data_stop); // Find out the current number of bars on the time interval
   bars_to_copy-=bars_copied; // Calculate the number of bars to be copied

   if(bars_copied!=0) // If it is not the first time the data has been copied
     {
      bars_copied--;
      bars_to_copy++;
     }

   ArrayResize(price_interim,bars_to_copy); // Change the size of the receiving array

   switch(price_type)
     {
      case 0:
         result_copy=CopyClose(_Symbol,period,0,bars_to_copy,price_interim);
         break;
      case 1:
         result_copy=CopyOpen(_Symbol,period,0,bars_to_copy,price_interim);
         break;
      case 2:
         result_copy=CopyHigh(_Symbol,period,0,bars_to_copy,price_interim);
         break;
      case 3:
         result_copy=CopyLow(_Symbol,period,0,bars_to_copy,price_interim);
         break;
     }

   if(result_copy!=-1) // If copying to the intermediate array is successful
     {
      ArrayCopy(result_array,price_interim,bars_copied,0,WHOLE_ARRAY); // Copy the data from the temporary array to the main one
      x=true; // assign the positive answer to the function
      bars_copied+=result_copy; // Increase the value of the processed data
     }
//---
   return(x);
  }
次の関数は、時刻データをコピーするものです。別の変数の種類、datetime(Timeバッファー配列にコピーされた際にDoubleに変換される)を扱うので、以前のものとは異なります。別の違いは、コピーされたデータを選択しなくても良いので、Switch()ステートメントは使用しないという点です。
//+------------------------------------------------------------------+
//| Func Copy Time                                                   |
//+------------------------------------------------------------------+
bool func_copy_time(double &result_array[],
                    datetime data_start,
                    datetime data_stop)
  {
//---
   int x=false; // Variable for answer
   int result_copy=-1; // Number of copied data

   static datetime time_interim[]; // Temporary dynamic array for storing copied data
   static int bars_to_copy_time; // Number of bars for copying

   bars_to_copy_time=Bars(_Symbol,period,data_start,data_stop); // Find out the current number of bars on the time interval
   bars_to_copy_time-=bars_copied_time; // Calculate the number of bars to be copied

   if(bars_copied_time!=0) // If it is not the first time the data has been copied
     {
      bars_copied_time--;
      bars_to_copy_time++;
     }
   ArrayResize(time_interim,bars_to_copy_time); // Change the size of the receiving array
   result_copy=CopyTime(_Symbol,period,0,bars_to_copy_time,time_interim);

   if(result_copy!=-1) // If copying to the intermediate array is successful
     {
      ArrayCopy(result_array,time_interim,bars_copied_time,0,WHOLE_ARRAY); // Copy the data from the temporary array to the main one
      x=true; // assign the positive answer to the function
      bars_copied_time+=result_copy; // Increase the value of the processed data
     }
//---
   return(x);
  }
3.4. リバーサルパラメーター計算関数
リバーサルパラメーターがポイント・パーセンテージ変数であるので、インジケーターの設定に基づきリバーサルパラメーターを計算する関数を必要とします。その関数は、一つのパラメーターのみを持ちます - パーセンテージリバースを計算するための価格です。その解に関する変数は、最初にdouble型により初期化され、計算の後、 int型に間接的に変換されます。
これは、浮動小数点が計算にて持ち入られているため、これが行われます。答えはIntger型で表示されます。選択は、if-else構文の関数にて実装されます。その比較は、外部のinput変数(インジケーターパラメーター)により直接実行されます。ポイントの計算は、簡単な方程式によって実行されます。最初に、価格の持つポイントの合計数が定義されます。それから、特定されたパーセンテージがこの数に基づいて計算され、返される変数に割り当てられます。
//+------------------------------------------------------------------+
//| Func Calculate Doorstep                                          |
//+------------------------------------------------------------------+
int func_calc_dorstep(double price)
  {
   double x=0; // Variable for answer
   if(type_doorstep==0) // If the calculation is to be performed in points
     {
      x=doorstep;
     }
   if(type_doorstep==1) // If the calculation is to be performed in percentage
     {
      x=price/_Point*doorstep/100;
     }
   return((int)x);
  }
3.5. メインの関数 - かぎ足チャートの描画
メイン関数 - インジケーターウィンドウでのかぎ足チャートの描画の処理に必要なすべての関数をすでに紹介しています。その関数の入力パラメーターは、データ配列からなります。それらのうち二つは、上記で紹介された計算バッファー、他のすべては、インジケーターグラフィカルオブジェクト形成用バッファーの配列です。
チャートの作成におけるデータの保持に必要な変数は、その関数内にて宣言されています。そのチャートはforループステートメントを用いて作成されるので、以前のデータを渡し終えた時点でのデータが必要です。これは6つの変数によって実現されます:line_move - データを渡したときに価格が移動する地点です、line_gauge - 線の幅です - Yin・Yang線になります、price_1・price_2 - 以前・現在の価格です price_down_price_up - 「肩・腰」における価格です。ご覧の通り、price_1は、この変数がループの最初の比較前の計算に関するものなので、コピーされる価格の配列の最初の要素とすぐに等しくされますます。
AS_SERIESインデックス化フラッグをインジケーターグラフィカル形成用のバッファー配列が所持しているので、逆の順番で格納される必要があります。このために、適切なサイズを持つ時間配列が実装されます。時間や線の種類、「肩」・「腰」に関するデータを保持するグローバル変数は、リバーサル価格と同様に変換されます。
次にすべての配列は「empty」変数で格納されます。(-1)これは二つの小さいループを用いて行われます。シングルループにてすべてを結合することができます。しかし、その二つを用いることで、すべての実行されるアクションがより明確になります。一方、実行時間は変わりません。言い換えれば、グラフィカルバッファーや計算時間は、個別に格納されます。
すべての変数が宣言され、変換・格納されましたので、メインループを作動させることができます。(計算は短時間で実行されますが)とても大きく、以前コピーされたデータをすべてスキャンします。
そのループは、すべてのコピーされるバーを通過し、必要な宣言された配列を今後扱うために格納していきます。まずは、ループにて用いられるすべての配列を定義しましょう;
- yin_int_1 - 垂直のYin線価格の一番目の値(もしそれが描写され、チャートが下方に動くなら、これは価格の上方の値です。上方に動くなら、逆となります。)
- yin_int_2 - 垂直のYin線の価格の二番目の値(上向きの線が描かれれば、これは上方の値です。下向きの線であれば、逆となります。)
- yang_int_1 - Yang線価格の一番目の値;
- yang_int_2 - 垂直Yang線価格の二番目の値;
- lin_yin - 水平なYin線の値(Yin線でのリバース価格);
- lin_yang - 水平なYang線の値(Yang線でのリバース価格);
- time_change - チャートリバーサルの時間(肩と腰の形成);
- time_line - Yin = 0かYang =1の間の線;
- time_central_price - 中央価格値、Yin線がYang線に変わる、もしくはその逆が起こる際の価格;
- time_change_price - リバース価格値、その変数はYinやYang線の種類に依存しない共通のものです。
価格バッファーから現在分析された価格値がif-else構文にてさらなる比較のために各ループを通過する前にprice_2_variableに渡されます。その後、コピーされるデータのバッファー配列がステップごとに分析され、上記で言及されている配列が格納されます。各if-else構文は条件に応じて特定のアクションを実行します:チャートの線の方向や線の見た目などです。それから、移動の条件(価格が特定のポイント数渡すかどうか)が、形成の種類(標準版か修正版)に応じて、チェックされます。
もしすべてが良好であれば、新しい変数が再度割り当てられるか、定義されます。その線の種類(YinかYang)は最初に定義されます。移動や以前のアクションに応じて、その後の分配が実行されます。
二つの可能な価格の動きがあります;
- 価格が上がる;
- 価格が下がる;
それぞれの方向にアクション4種類あります:
- 一つ前の線がYinで、上に動いた;
- 一つ前の線がYangで、上に動いた;
- 一つ前の線がYinで、下に動いた;
- 一つ前の線がYangで、下に動いた;
したがって、チャートの最初の動きの二つの定義とは別に8つのケースがあります。
その後、メインのループが終了します。バッファーの再割り当てや格納は、メインループにて定義され、「a」変数が記述されているかぎ足チャートの数からなる、小さいループのチャートを作成するために実行されます。上方と下方への価格の値と垂直線の分配に関して、すべてシンプルになっています:シンプルリバーサルが実行されます。言い換えれば、一つ前に取得された主要な値(インデックス0、1、2、3を持つ配列)は、バッファーの最後の値に渡されます(「a」インデックスを持つ要素、 а,а-1,а-2,а-3...がエンド値として使用されます)。リバース線が互いにくっつかないよう、switchステートメントを用いるローテーションが上に述べられた通り実行されます。
かぎ足チャートにおける主な関数の作業は完了です。
//+------------------------------------------------------------------+
//| Func Draw Kagi                                                   |
//+------------------------------------------------------------------+
void func_draw_kagi(double &array_input[],
                    double &arr_yin_1[],
                    double &arr_yin_2[],
                    double &arr_yin_lin1[],
                    double &arr_yin_lin2[],
                    double &arr_yin_lin3[],
                    double &arr_yang_1[],
                    double &arr_yang_2[],
                    double &arr_yang_lin1[],
                    double &arr_yang_lin2[],
                    double &arr_yang_lin3[],
                    double &arr_time[])
  {
//---
   a=0; // Variable for the chart construction fixing the number of chart reversals
   char line_move=0; // Previous price direction 1-up, -1-down
   char line_gauge=0; // Previous look of the line 1-thick yang, -1-thin yin
   double price_1=0,price_2=0; // Auxiliary variables for defining the price movement
   double price_down=-99999,price_up=99999; // Auxiliary variables for storing the reversal price values
   price_1=array_input[0];
//--- auxiliary arrays for the initial data storing before the reversal (transferring to the buffers)
   double yin_int_1[];
   double yin_int_2[];
   double lin_yin[];
   double yang_int_1[];
   double yang_int_2[];
   double lin_yang[];
//--- change the sizes of dynamic arrays
   ArrayResize(yin_int_1,bars_copied);
   ArrayResize(yin_int_2,bars_copied);
   ArrayResize(yang_int_1,bars_copied);
   ArrayResize(yang_int_2,bars_copied);
   ArrayResize(lin_yin,bars_copied);
   ArrayResize(lin_yang,bars_copied);
//--- time data storing arrays
   ArrayResize(time_change,bars_copied_time);
   ArrayResize(time_line,bars_copied_time); // Look of the line Yin = 0 or Yang = 1
   ArrayResize(time_change_price,bars_copied_time);
   ArrayResize(time_central_price,bars_copied_time);
//--- assign -1 (not displayed) value to the transferred buffers
   for(int z=0; z<bars_copied; z++)
     {
      arr_yin_1[z]=-1;
      arr_yin_2[z]=-1;
      arr_yin_lin1[z]=-1;
      arr_yin_lin2[z]=-1;
      arr_yin_lin3[z]=-1;
      arr_yang_1[z]=-1;
      arr_yang_2[z]=-1;
      arr_yang_lin1[z]=-1;
      arr_yang_lin2[z]=-1;
      arr_yang_lin3[z]=-1;
     }
//--- equate -1 (not displayed) value to the arrays
   for(int z=0; z<bars_copied; z++)
     {
      yin_int_1[z]=-1;
      yin_int_2[z]=-1;
      lin_yin[z]=-1;
      yang_int_1[z]=-1;
      yang_int_2[z]=-1;
      lin_yang[z]=-1;
      time_change[z]=-1;
      time_line[z]=-1;
      time_change_price[z]=-1;
      time_central_price[z]=-1;
     }
//--- function's main loop
   for(int z=0; z<bars_copied; z++)
     {
      price_2=array_input[z];
      //--- first, let's define the initial market direction
      //--- first THIN DESCENDING line
      if(((price_1-price_2)/_Point>func_calc_dorstep(price_2)) && line_move==0)
        {
         yin_int_1[a]=price_1;
         yin_int_2[a]=price_2;

         line_move=-1;
         line_gauge=-1;

         price_1=price_2;

         time_change[a]=(datetime)arr_time[z];
         time_line[a]=0;
        }
      //--- first THICK ASCENDING line
      if(((price_1-price_2)/_Point<-func_calc_dorstep(price_2)) && line_move==0)
        {
         yang_int_1[a]=price_1;
         yang_int_2[a]=price_2;

         line_move=1;
         line_gauge=1;

         price_1=price_2;

         time_change[a]=(datetime)arr_time[z];
         time_line[a]=1;
        }
      //--- price moves DOWN
      //--- if the price moved DOWN before that, the line is THIN
      if(line_move==-1 && line_gauge==-1)
        {
         if(((price_1-price_2)/_Point>func_calc_dorstep(price_2)) || (kagi_type==0 && (price_1-price_2)/_Point>0))
           {
            yin_int_2[a]=price_2;

            line_move=-1;
            line_gauge=-1;

            price_1=price_2;

            time_change[a]=(datetime)arr_time[z];
            time_line[a]=0;
           }
        }
      //--- if the price moved DOWN before that, the line is THICK
      if(line_move==-1 && line_gauge==1)
        {
         if(((price_1-price_2)/_Point>func_calc_dorstep(price_2)) || (kagi_type==0 && (price_1-price_2)/_Point>0))
           {
            if(price_2<price_down) // If the thick line crossed the lower shoulder when moving downwards
              {
               yin_int_1[a]=price_down;
               yin_int_2[a]=price_2;

               yang_int_2[a]=price_down;

               line_move=-1;
               line_gauge=-1;

               price_1=price_2;

               time_change[a]=(datetime)arr_time[z];
               time_central_price[a]=price_down;
               time_line[a]=0;
              }
            else //if(price_2>=price_down) // If the thick line has not crossed the lower shoulder when moving downwards
              {
               yang_int_2[a]=price_2;

               line_move=-1;
               line_gauge=1;

               price_1=price_2;

               time_change[a]=(datetime)arr_time[z];
               time_line[a]=1;
              }
           }
        }
      //--- if the price has moved UPWARDS before that, the line is THIN
      if(line_move==1 && line_gauge==-1)
        {
         if((price_1-price_2)/_Point>func_calc_dorstep(price_2))
           {
            a++;
            yin_int_1[a]=price_1;
            yin_int_2[a]=price_2;

            lin_yin[a]=price_1;

            line_move=-1;
            line_gauge=-1;

            price_up=price_1;

            price_1=price_2;

            time_change[a]=(datetime)arr_time[z];
            time_line[a]=0;
            time_change_price[a]=lin_yin[a];
           }
        }
      //--- if the price has moved UPWARDS before that, the line is THICK
      if(line_move==1 && line_gauge==1)
        {
         if((price_1-price_2)/_Point>func_calc_dorstep(price_2))
           {
            a++;
            if(price_2<price_down) // If the thick line has crossed the lower shoulder when moving downwards
              {
               yin_int_1[a]=price_down;
               yin_int_2[a]=price_2;

               yang_int_1[a]=price_1;
               yang_int_2[a]=price_down;

               lin_yang[a]=price_1;

               line_move=-1;
               line_gauge=-1;

               price_up=price_1;

               price_1=price_2;

               time_change[a]=(datetime)arr_time[z];
               time_line[a]=0;
               time_change_price[a]=lin_yang[a];
               time_central_price[a]=price_down;
              }
            else//if(price_2>=price_down) // If the thick line has not crossed the lower shoulder when moving downwards
              {
               yang_int_1[a]=price_1;
               yang_int_2[a]=price_2;

               lin_yang[a]=price_1;

               line_move=-1;
               line_gauge=1;

               price_up=price_1;

               price_1=price_2;

               time_change[a]=(datetime)arr_time[z];
               time_line[a]=1;
               time_change_price[a]=lin_yang[a];
              }
           }
        }
      //--- the price moves UP
      //--- if the price has moved UPWARDS before that, the line is THICK
      if(line_move==1 && line_gauge==1)
        {
         if(((price_1-price_2)/_Point<-func_calc_dorstep(price_2)) || (kagi_type==0 && (price_1-price_2)/_Point<0))
           {
            yang_int_2[a]=price_2;

            line_move=1;
            line_gauge=1;

            price_1=price_2;

            time_change[a]=(datetime)arr_time[z];
            time_line[a]=1;
           }
        }

      //--- if the price has moved UPWARDS before that, the line is THIN
      if(line_move==1 && line_gauge==-1)
        {
         if(((price_1-price_2)/_Point<-func_calc_dorstep(price_2)) || (kagi_type==0 && (price_1-price_2)/_Point<0))
           {
            if(price_2>price_up) // If the thin line has not crossed the upper shoulder when moving upwards
              {
               yin_int_2[a]=price_up;

               yang_int_1[a]=price_up;
               yang_int_2[a]=price_2;

               line_move=1;
               line_gauge=1;

               price_1=price_2;

               time_change[a]=(datetime)arr_time[z];
               time_central_price[a]=price_up;
               time_line[a]=1;
              }
            else//if(price_2<=price_up) // If the thin line has not crossed the upper shoulder when moving upwards
              {
               yin_int_2[a]=price_2;

               line_move=1;
               line_gauge=-1;

               price_1=price_2;

               time_change[a]=(datetime)arr_time[z];
               time_line[a]=0;
              }
           }
        }

      //--- if the price has moved DOWNWARDS before that, the line is THICK
      if(line_move==-1 && line_gauge==1)
        {
         if((price_1-price_2)/_Point<-func_calc_dorstep(price_2))
           {
            a++;

            yang_int_1[a]=price_1;
            yang_int_2[a]=price_2;

            lin_yang[a]=price_1;

            line_move=1;
            line_gauge=1;

            price_down=price_1;
            price_1=price_2;

            time_change[a]=(datetime)arr_time[z];
            time_line[a]=1;
            time_change_price[a]=lin_yang[a];
           }
        }

      //--- if the price has moved DOWNWARDS before that, the line is THIN
      if(line_move==-1 && line_gauge==-1)
        {
         if((price_1-price_2)/_Point<-func_calc_dorstep(price_2))
           {
            a++;
            if(price_2>price_up) // If the thin line has crossed the upper shoulder when moving upwards
              {
               yin_int_1[a]=price_1;
               yin_int_2[a]=price_up;

               yang_int_1[a]=price_up;
               yang_int_2[a]=price_2;

               lin_yin[a]=price_1;

               line_move=1;
               line_gauge=1;

               price_down=price_1;
               price_1=price_2;

               time_change[a]=(datetime)arr_time[z];
               time_line[a]=1;
               time_change_price[a]=lin_yin[a];
               time_central_price[a]=price_up;
              }
            else //if(price_2<=price_up) // If the thin line has not crossed the upper shoulder when moving upwards
              {
               yin_int_1[a]=price_1;
               yin_int_2[a]=price_2;

               lin_yin[a]=price_1;

               line_move=1;
               line_gauge=-1;

               price_down=price_1;
               price_1=price_2;

               time_change[a]=(datetime)arr_time[z];
               time_line[a]=0;
               time_change_price[a]=lin_yin[a];
              }
           }
        }

     }
//--- function's main loop
//--- assign actual values to drawing buffers
   uint y=a;
//--- auxiliary variables for storing data on filling the current buffer
   char yin=1;
   char yang=1;
   for(uint z=0; z<=a; z++)
     {
      arr_yin_1[z]=yin_int_1[y];
      arr_yin_2[z]=yin_int_2[y];

      switch(yin)
        {
         case 1:
           {
            arr_yin_lin1[z]=lin_yin[y];
            arr_yin_lin1[z+1]=lin_yin[y];
            yin++;
           }
         break;
         case 2:
           {
            arr_yin_lin2[z]=lin_yin[y];
            arr_yin_lin2[z+1]=lin_yin[y];
            yin++;
           }
         break;
         case 3:
           {
            arr_yin_lin3[z]=lin_yin[y];
            arr_yin_lin3[z+1]=lin_yin[y];
            yin=1;
           }
         break;
        }

      arr_yang_1[z]=yang_int_1[y];
      arr_yang_2[z]=yang_int_2[y];

      switch(yang)
        {
         case 1:
           {
            arr_yang_lin1[z]=lin_yang[y];
            arr_yang_lin1[z+1]=lin_yang[y];
            yang++;
           }
         break;
         case 2:
           {
            arr_yang_lin2[z]=lin_yang[y];
            arr_yang_lin2[z+1]=lin_yang[y];
            yang++;
           }
         break;
         case 3:
           {
            arr_yang_lin3[z]=lin_yang[y];
            arr_yang_lin3[z+1]=lin_yang[y];
            yang=1;
           }
         break;
        }
      y--;
     }
//---
  }
3.6. 「トレンド線」グラフィカルオブジェクトを作成するための関数
「トレンド線」グラフィカルオブジェクトを作成する関数を詳しく見てみましょう。その関数はメインチャートにてかぎ足を描くために必要です。
その関数はとてもシンプルです。"トレンド線"を作成するために必要な入力パラメーターを含んでいます:オブジェクト名や一番目と二番目の価格、時間ポイント、線幅・色などです。その関数は、グラフィカルオブジェクトの作成用の関数やグラフィカルオブジェクトの属性を変化させる6つの関数を含んでいます。
//+------------------------------------------------------------------+
//| Func Object Create Trend Line                                    |
//+------------------------------------------------------------------+
void func_create_trend_line(string name,
                            double price1,
                            double price2,
                            datetime time1,
                            datetime time2,
                            int width,
                            color color_line)
  {
   ObjectCreate(0,name,OBJ_TREND,0,time1,price1,time2,price2);
//--- set the line color
   ObjectSetInteger(0,name,OBJPROP_COLOR,color_line);
//--- set the line display style
   ObjectSetInteger(0,name,OBJPROP_STYLE,STYLE_SOLID);
//--- set the line width
   ObjectSetInteger(0,name,OBJPROP_WIDTH,width);
//--- display in the foreground (false) or background (true)
   ObjectSetInteger(0,name,OBJPROP_BACK,false);
//--- enable (true) or disable (false) the mode of continuing the line display to the left
   ObjectSetInteger(0,name,OBJPROP_RAY_LEFT,false);
//--- enable (true) or disable (false) the mode of continuing the line display to the right
   ObjectSetInteger(0,name,OBJPROP_RAY_RIGHT,false);
  }
3.7. メインチャートにかぎ足を描画する
複数回以前のものに適用される次の関数は、メインチャートでのかぎ足の作成のための関数です。以前紹介したかぎ足チャート形成のメインの関数にて格納されたグローバル変数が入力変数として使用されます:リバース価格の配列(「肩」と「腰」)、変化と中央価格の配列、リバース時間配列(リアルタイムに配置され、[z-1]配列インデックスがリバースの開始をマークするために使用されます)、リバースが起こった線の種類のための配列などです。
その関数はループを含んでいます。そのループは、二つの部分に分かれます;垂直と水平な線の描画です。一つ目のものについても二つに分かれています;線の変化を考慮した垂直線(中央価格を変化させます)と変化の欠乏です。渡された「トレンド線」オブジェクト作成関数のパラメータに注意してください。
名前付けは、繰り返し実行されます。オブジェクト名は、マジック数より始まります。(特定のインジケーターオブジェクトを削除するのに必要です)その種類は固定されており、最後にインデックスが割り当てられます。そのインデックスはループが毎回通過されるたびに更新されます。
//+------------------------------------------------------------------+ //| Func Kagi Main Chart | //+------------------------------------------------------------------+ void func_kagi_main_chart(double &price[], // Shoulder prices array double ¢ral_price[], // Array of the prices of passing through the shoulders datetime &time[], // Current location time array ([-1] - start of shoulder) char &type_line_end[]) // Line type by the start of shoulder formation { //--- start of the loop for(uint z=1; z<=a; z++) { //--- check for the pass conditions (no pass) if(central_price[z]==-1) { if(type_line_end[z-1]==0 && price[z+1]!=-1) { func_create_trend_line(IntegerToString(magic_numb)+"_trend_yin_v"+IntegerToString(z), price[z],price[z+1],time[z],time[z],width_yin_main,color_yin_main); } if(type_line_end[z-1]==1 && price[z+1]!=-1) { func_create_trend_line(IntegerToString(magic_numb)+"_trend_yang_v"+IntegerToString(z), price[z],price[z+1],time[z],time[z],width_yang_main,color_yang_main); } } else //--- check for the pass conditions (pass is present) { if(type_line_end[z-1]==0 && price[z+1]!=-1) { func_create_trend_line(IntegerToString(magic_numb)+"_trend_yin_v"+IntegerToString(z), central_price[z],price[z],time[z],time[z],width_yin_main,color_yin_main); func_create_trend_line(IntegerToString(magic_numb)+"_trend_yang_v"+IntegerToString(z), central_price[z],price[z+1],time[z],time[z],width_yang_main,color_yang_main); } if(type_line_end[z-1]==1 && price[z+1]!=-1) { func_create_trend_line(IntegerToString(magic_numb)+"_trend_yin_v"+IntegerToString(z), central_price[z],price[z+1],time[z],time[z],width_yin_main,color_yin_main); func_create_trend_line(IntegerToString(magic_numb)+"_trend_yang_v"+IntegerToString(z), central_price[z],price[z],time[z],time[z],width_yang_main,color_yang_main); } } //--- check for the pass conditions (pass is present) //--- draw the horizontals if(type_line_end[z-1]==0) { func_create_trend_line(IntegerToString(magic_numb)+"_trend_h"+IntegerToString(z), price[z],price[z],time[z-1],time[z],width_yin_main,color_yin_main); } if(type_line_end[z-1]==1) { func_create_trend_line(IntegerToString(magic_numb)+"_trend_h"+IntegerToString(z), price[z],price[z],time[z-1],time[z],width_yang_main,color_yang_main); } //--- draw the horizontals } }
3.8. 追加のラベルの実装
すでに上記で言及されている通り、そのインジケーターは追加のラベルを実装します。メインチャートにてこれらのラベルを提供する関数を紹介します。ラベルは二つの種類しかありません:"price label"と "vertical label".を経由したリバース価格とリバース時間です。以下のパラメーターは、入力パラメーターとして渡されます:リバースラベルの描画属性や、ラベルの色、リバース時間ラベルの属性、ラベルの色の変化に関する属性などです。
その関数は二つに分かれます:一つ目はタイムラベルに対応し、二つ目は価格ラベルです。その関数の両方はチャートリバースの数("a"変数)により制限されたループから成り立っています。if-else構文がループ前に設定されます。そのステートメントは、インジケーターの設定に応じて描画の必要性をチェックします。
最初のループは時間ラベルを作成し、オブジェクト名の定義はループの最初に実行されます(名前の生成原則は上記ですでに紹介されています。)それから、色は宣言された線の種類の配列に応じて、選択されます(パラメーターがセットされている場合)。その他のパラメーターは線に適用されます。
二番目のループはリバース価格ラベルを担っています。最初に、オブジェクト名が生成されます。それから、時間配列のインデックスの選択は、かぎ足がメインチャートで作成されてるかに応じて、行われます。もし作成されていなければ、ラベルは「空中に」配置され、リバースが起こる場所から十分に明確ではなくなります。"price label"の種類のオブジェクトが生成され、設定されます。
//+------------------------------------------------------------------+
//| Func Label Main Chart                                            |
//+------------------------------------------------------------------+
void func_label_main_chart(bool label_print,
                           color label_color,
                           bool time_change_print,
                           bool time_change_color,
                           color time_color_first,
                           color time_color_second)
  {
   if(time_change_print==true)
     {
      for(uint z=1; z<=a; z++)
        {
         string name=IntegerToString(magic_numb)+"_time_2_"+IntegerToString(z);
         //--- create an object of a vertical line type
         ObjectCreate(0,name,OBJ_VLINE,0,time_change[z],0);
         //--- set the line color
         color color_line=clrBlack;
         if(time_change_color==true)
           {
            if(time_line[z]==0)color_line=time_color_first;
            if(time_line[z]==1)color_line=time_color_second;
           }
         else color_line=time_color_first;
         ObjectSetInteger(0,name,OBJPROP_COLOR,color_line);
         //--- set the line display style
         ObjectSetInteger(0,name,OBJPROP_STYLE,STYLE_SOLID);
         //--- set the line width
         ObjectSetInteger(0,name,OBJPROP_WIDTH,1);
         //--- display on the foreground (false) or background (true)
         ObjectSetInteger(0,name,OBJPROP_BACK,false);
         //--- enable (true) or disable (false) the line display mode in the chart subwindows
         ObjectSetInteger(0,name,OBJPROP_RAY,time_separate_windows);
        }
     }
   if(label_print==true)
     {
      for(uint z=1; z<=a; z++)
        {
         string name=IntegerToString(magic_numb)+"_label_2_"+IntegerToString(z);
         uint numb_time;
         if(kagi_main_chart==true)numb_time=z;
         else numb_time=z-1;
         //--- create a label type object
         ObjectCreate(0,name,OBJ_ARROW_RIGHT_PRICE,0,time_change[numb_time],time_change_price[z]);
         //--- set the label color
         ObjectSetInteger(0,name,OBJPROP_COLOR,label_color);
         //--- set the edging line style
         ObjectSetInteger(0,name,OBJPROP_STYLE,STYLE_SOLID);
         //--- set the label size
         ObjectSetInteger(0,name,OBJPROP_WIDTH,1);
         //--- display on the foreground (false) or background (true)
         ObjectSetInteger(0,name,OBJPROP_BACK,false);
        }
     }
  }
インジケーターウィンドウにラベルをどのようにセットできるか見てみましょう。
インジケーターウィンドウのすべてのラベルは、主に価格のものであり、2種類しかありません;リバース価格ラベルと、価格レベルです。価格レベルの描画には2種類あります:チャートリバース上のものと、チャートの価格帯の距離にあるものです。最初の種類は、二つの方法でレベルの色を変えることができます:線の種類(YinとYang)に依存するか、リバース(上か下)に応じる方法です。
したがって、その関数は二つのループに分かれます:一つ目は、リバース価格ラベルの作成を担当し、二つ目は、価格レベルの指示を扱っています。後者はさらに二つの種類に分かれます;各リバーサルのラベルか、価格帯におけるラベルです。
この関数は、以前のもとは、理解を複雑化させるほどチャートに負担をかけてしまうため、価格ラベルやレベルに制限があるという点で異なります。
この特徴のため、両方のループがインジケーターの設定にて明記された通過回数(価格ラベルとレベル数)により制限されています。そのようなアプローチはリバース数が設定にてセットされた価格ラベルの数よりも小さくなってしまう可能性があるため、危険です。このため、各ループ通過中にリバースの存在が価格ラベルかレベルの描画のためにチェックされます。
唯一の例外は、等しい距離にて、全価格帯に沿って価格レベルを描画するという点です。"Price label"型のグラフィカルオブジェクトの精子絵は、逆の順序で実行されます。つまり、ラベルが現在の日付から過去の日付へと配置されます。同じことが価格レベルにも適用されます:現在の価格レベルが最初に生成され、過去のものが続きます。その例外は、価格レベルで、チャートリバーサルに依存していません。
価格レベルの色の変更が設定に応じて、if-else構文を用いて実行されます。
//+------------------------------------------------------------------+
//| Func Label Indicator Window                                      |
//+------------------------------------------------------------------+
void func_label_indicator_window(bool label_print,         // Draw price labels
                                 bool levels_print,        // Draw levels
                                 char levels_type_draw,    // Type of drawing the levels by reversals or at an equal distance of the entire price range
                                 char levels_color_change) // Change line color
  {
   uint number=a;
   if(label_print==true)
     {
      for(uint z=0; z<=label_1_number; z++)
        {
         if(z<number)
           {
            string name=IntegerToString(magic_numb)+"_label_1_"+IntegerToString(z);
            //--- create label type object
            ObjectCreate(0,name,OBJ_ARROW_RIGHT_PRICE,ChartWindowFind(),(datetime)Time[(bars_copied_time-z-2)],time_change_price[number-z]);
            //--- set the label color
            ObjectSetInteger(0,name,OBJPROP_COLOR,label_1_color);
            //--- set the style of the edging line
            ObjectSetInteger(0,name,OBJPROP_STYLE,STYLE_SOLID);
            //--- set the label size
            ObjectSetInteger(0,name,OBJPROP_WIDTH,1);
            //--- display on the foreground (false) or background (true)
            ObjectSetInteger(0,name,OBJPROP_BACK,false);
           }
        }
     }
   if(levels_print==true)
     {
      if(levels_type_draw==0)
        {
         for(uint z=0; z<=levels_number; z++)
           {
            if(z<number)
              {
               IndicatorSetDouble(INDICATOR_LEVELVALUE,z,time_change_price[number-z]);
               if(levels_change_color==0)
                 {
                  double numb_even=z;
                  if(MathMod(numb_even,2)==0)
                    {
                     IndicatorSetInteger(INDICATOR_LEVELCOLOR,z,levels_first_color);
                    }
                  if(MathMod(numb_even,2)!=0)
                    {
                     IndicatorSetInteger(INDICATOR_LEVELCOLOR,z,levels_second_color);
                    }
                 }
               if(levels_change_color==1)
                 {
                  if(time_line[number-z]==0)IndicatorSetInteger(INDICATOR_LEVELCOLOR,z,levels_first_color);
                  if(time_line[number-z]==1)IndicatorSetInteger(INDICATOR_LEVELCOLOR,z,levels_second_color);
                 }
               if(levels_change_color==2)
                 {
                  IndicatorSetInteger(INDICATOR_LEVELCOLOR,z,levels_first_color);
                 }
              }
           }
        }
      if(levels_type_draw==1)
        {
         double max_price=Price[ArrayMaximum(Price)];
         double min_price=Price[ArrayMinimum(Price,1,ArrayMinimum(Price)-1)];
         double number_difference=(max_price-min_price)/levels_number;
         NormalizeDouble(number_difference,_Digits);
         for(uint z=0; z<=levels_number; z++)
           {
            IndicatorSetDouble(INDICATOR_LEVELVALUE,z,(min_price+(z*number_difference)));
            IndicatorSetInteger(INDICATOR_LEVELCOLOR,z,levels_first_color);
           }
        }
     }
  }
3.9. 以前作成されたグラフィカルオブジェクトの削除
このインジケーターはグラフィカルオブジェクトを豊富に持っています。それらを素早く効率的に削除する方法を考えたいと思います。
この作業は、グラフィカルオブジェクトの削除のための関数によって実行されます。その初期名やオブジェクト名は、関数パラメーターとして使用されます。オブジェクト名は、マジック数を所持し、オブジェクトの型名を持っています。そのプログラムにおける関数の呼び出しは、オブジェクト数によって制限されています。しかし、これはインジケーターの機能に影響を与えません。
//+------------------------------------------------------------------+
//| Func Delete Objects                                              |
//+------------------------------------------------------------------+
void func_delete_objects(string name,
                         int number)
  {
   string name_del;
   for(int x=0; x<=number; x++)
     {
      name_del=name+IntegerToString(x);
      ObjectDelete(0,name_del);
     }
  }
3.10. チャートの作成を開始するための関数
オブジェクトの作成・削除、かぎ足チャートの作成と計算のためのすべての関数を紹介しましたので、新規バーをチェックするための関数を紹介します。その関数は、とてもシンプルで入力パラメーター一つだけ所持しています - 分析期間に関するものです。その関数の答えは、とてもシンプルです。bool型を持っており、新規バーがあるか否かについての答えを持っています。その関数の基礎は、switchステートメントであり、コントロールを期間に応じて異なるステートメントに渡します。
例では、その関数がすべての期間領域をカバーします。また、一つの期間のみでも使用できます。
その関数のアルゴリズムは、IsNewBarコードから取得されています;最後のバーのオープン時刻は、以前定義された時間の値と比較されます。もしその値が異なれば、新しいバーが生じます。その新しい値は、以前定義されたもののように割り当てられ、その関数のレスポンスは正になります。もし最後のバーのオープン時間が以前決定された時間の値と一致していれば、新しいバーが生じておらず、その関数のレスポンスは負になります。
//+------------------------------------------------------------------+
//| Func New Bar                                                     |
//+------------------------------------------------------------------+
bool func_new_bar(ENUM_TIMEFRAMES period_time)
  {
//----
   static datetime old_Times[22];// array for storing old values
   bool res=false;               // analysis result variable
   int  i=0;                     // old_Times[] array cell index
   datetime new_Time[1];         // new bar time

   switch(period_time)
     {
      case PERIOD_M1:  i= 0; break;
      case PERIOD_M2:  i= 1; break;
      case PERIOD_M3:  i= 2; break;
      case PERIOD_M4:  i= 3; break;
      case PERIOD_M5:  i= 4; break;
      case PERIOD_M6:  i= 5; break;
      case PERIOD_M10: i= 6; break;
      case PERIOD_M12: i= 7; break;
      case PERIOD_M15: i= 8; break;
      case PERIOD_M20: i= 9; break;
      case PERIOD_M30: i=10; break;
      case PERIOD_H1:  i=11; break;
      case PERIOD_H2:  i=12; break;
      case PERIOD_H3:  i=13; break;
      case PERIOD_H4:  i=14; break;
      case PERIOD_H6:  i=15; break;
      case PERIOD_H8:  i=16; break;
      case PERIOD_H12: i=17; break;
      case PERIOD_D1:  i=18; break;
      case PERIOD_W1:  i=19; break;
      case PERIOD_MN1: i=20; break;
      case PERIOD_CURRENT: i=21; break;
     }
   // copy the time of the last bar to new_Time[0] cell
   int copied=CopyTime(_Symbol,period_time,0,1,new_Time);

   if(copied>0) // all is well. Data has been copied
      {
      if(old_Times[i]!=new_Time[0])       // if the bar's old time is not equal to new one
         {
         if(old_Times[i]!=0) res=true;    // if it is not the first launch, true = new bar
         old_Times[i]=new_Time[0];        // store the bar's time
         }
      }
//----
   return(res);
  }
3.11. OnCalculate()・OnChartEvent() 関数
記載されているすべての関数は、FuncConsolidationという同じ名前の関数にて、統合されています。この関数は、新しいバーがOnCalculate関数に現れるたびに起動され、OnChartEvent関数から「R」キーが押された時にも起動されます。
そのチャートが生成され、更新される前に、すべてのグラフィカルオブジェクトを削除するための関数が、統合関数にて呼び出されます。オブジェクトがたくさんあり、メインチャートとインジケーターウィンドウの価格ラベル、リバース時間を示す垂直線、Yin・Yang垂直・水平トレンド線に分かれるため、関数の呼び出し数は7です。
履歴データは、時間と価格によってコピーされます。かぎ足チャートの作成のためのメイン関数がその後、開始されます。その後、すべての価格ラベルをメインチャートに貼り付けるための関数とインジケーターウィンドウが呼び出されます。最後に、かぎ足がメインチャートにて生成され、オブジェクト再描画のための関数が開始されます。
//+------------------------------------------------------------------+
//| Func Consolidation                                               |
//+------------------------------------------------------------------+
void func_consolidation()
  {
//--- date of construction end
   stop_data=TimeCurrent();

//--- deleting all graphical objects belonging to the indicator
   func_delete_objects(IntegerToString(magic_numb)+"_label_2_",ObjectsTotal(0,-1,-1));
   func_delete_objects(IntegerToString(magic_numb)+"_label_1_",ObjectsTotal(0,-1,-1));
   func_delete_objects(IntegerToString(magic_numb)+"_time_2_",ObjectsTotal(0,-1,-1));
   func_delete_objects(IntegerToString(magic_numb)+"_trend_yin_v",ObjectsTotal(0,-1,-1));
   func_delete_objects(IntegerToString(magic_numb)+"_trend_yang_v",ObjectsTotal(0,-1,-1));
   func_delete_objects(IntegerToString(magic_numb)+"_trend_h",ObjectsTotal(0,-1,-1));
   func_delete_objects(IntegerToString(magic_numb)+"_trend_h",ObjectsTotal(0,-1,-1));

//--- copy price data to the main buffer
   copy_history=func_copy_history(Price,start_data,stop_data);

//--- display information about the error when copying price data
   if(copy_history==false)Alert("Error of copy history Price");

//--- copy time data to the main buffer
   copy_time=func_copy_time(Time,start_data,stop_data);

//--- display a notification of the error occurred while copying time data
   if(copy_time==false)Alert("Error of copy history Time");

//--- construct Kagi chart in the indicator window
   func_draw_kagi(Price,YinBuffer1,YinBuffer2,Yin1Buffer,Yin2Buffer,Yin3Buffer,
                  YangBuffer1,YangBuffer2,Yang1Buffer,Yang2Buffer,Yang3Buffer,Time);

//--- draw labels on the main chart
   func_label_main_chart(label_2,label_2_color,time_line_draw,time_line_change_color,time_first_color,time_second_color);

//--- draw labels on the indicator chart
   func_label_indicator_window(label_1,levels_on_off,levels_type,levels_change_color);

//--- construct Kagi chart in the main window
   if(kagi_main_chart==true)func_kagi_main_chart(time_change_price,time_central_price,time_change,time_line);

//--- redraw the chart
   ChartRedraw(0);
//---
  }
//+------------------------------------------------------------------+
//| Custom indicator iteration function                              |
//+------------------------------------------------------------------+
int OnCalculate(const int rates_total,
                const int prev_calculated,
                const int begin,
                const double &price[])
  {
//---
   if(func_new_bar(period_to_redraw)==true)
     {
      func_consolidation();
     }
//--- return value of prev_calculated for next call
   return(rates_total);
  }
//+------------------------------------------------------------------+
//| OnChartEvent                                                     |
//+------------------------------------------------------------------+
void OnChartEvent(const int id,         // event ID
                  const long& lparam,   // long type event parameter
                  const double& dparam, // double type event parameter
                  const string& sparam) // string type event parameter
  {
   if(id==CHARTEVENT_KEYDOWN) // Keyboard button pressing event
     {
      if(lparam==82) // "R" key has been pressed
        {
         func_consolidation();
        }
     }
  }
3.12. OnDeinit() 関数
すべてのオブジェクトの削除は、インジケーターディイニシャライゼーション関数にて実行されます。
//+------------------------------------------------------------------+
//| OnDeinit                                                         |
//+------------------------------------------------------------------+
void OnDeinit(const int reason)
  {
//--- delete all graphical objects belonging to the indicator
   func_delete_objects(IntegerToString(magic_numb)+"_label_2_",ObjectsTotal(0,-1,-1));
   func_delete_objects(IntegerToString(magic_numb)+"_label_1_",ObjectsTotal(0,-1,-1));
   func_delete_objects(IntegerToString(magic_numb)+"_time_2_",ObjectsTotal(0,-1,-1));
   func_delete_objects(IntegerToString(magic_numb)+"_trend_yin_v",ObjectsTotal(0,-1,-1));
   func_delete_objects(IntegerToString(magic_numb)+"_trend_yang_v",ObjectsTotal(0,-1,-1));
   func_delete_objects(IntegerToString(magic_numb)+"_trend_h",ObjectsTotal(0,-1,-1));
   func_delete_objects(IntegerToString(magic_numb)+"_trend_h",ObjectsTotal(0,-1,-1));
//--- redraw the chart
   ChartRedraw(0);
  }
それでは、実際にインジケーターを使用してみましょう。
4. 実際にかぎ足チャートを使用する
かぎ足チャートに基づくトレーディング戦略はたくさんあります。それらのうちいくつかを紹介します。
最も人気のある戦略から始めましょう;YangがYin変わる時に売り、逆の場合に買います。これは図4にて示されています:
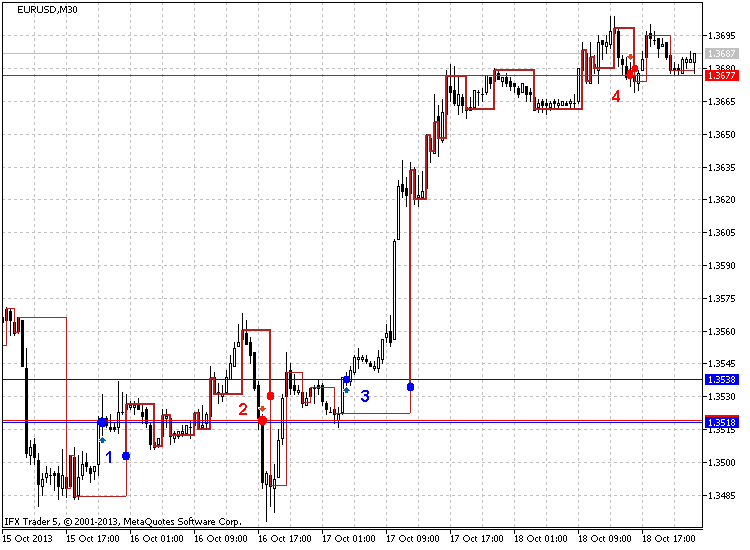
図4. YangがYin変わる時に売り、逆の場合に買う
図4にてご覧の通り(EURUSD M30, 5ポイント)、この戦略は良い結果を示します。その図は、4つのシグナルにおける8ポイントを示し、最初は、ロングポジションが1.3518にてオープンされる必要があり、価格は1日につき42ポイント追加され、1.3560に達するので、1.3518というのは正しいようdです。良い結果を示しています。
次のポイント(2)は1.3519で売ることを推奨しています。ご覧の通り、おおよそ二時間の間、その価格は1.35485のレベルを超えて下がっています
ポイント(3)に移りましょう。ロングポジションは、1.3538にてオープンされ、その価格は、1.3695に達するよう上昇します。したがって、利益は、1日と半日につき157ポイントになります。もちろん、これらは、起こりうる最も高い利益ですが、結果は以前十分よいです。
次のトレーディング戦略は、図5にて示されているトレンド線からの引き下げです。(EURUSD M30, 5ポイント, 10月7-18日)
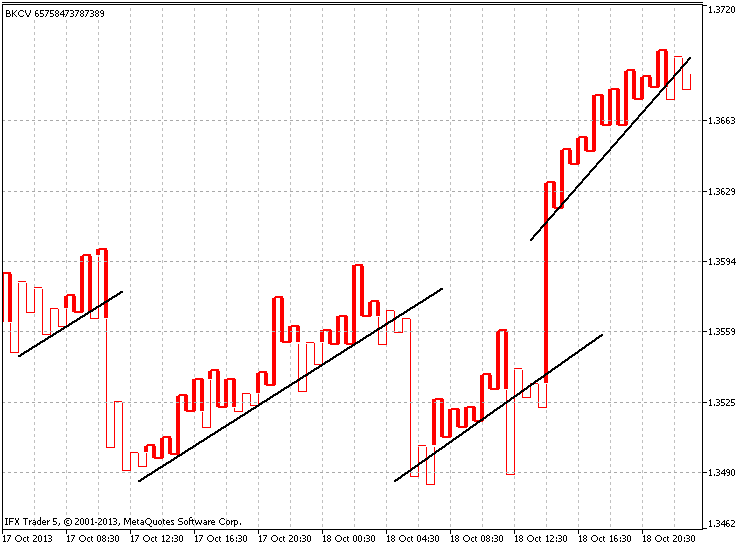
図5. トレンド線からの引き下げ
さらに移動し、以下のチャネルに沿ってトレードを行います。チャネルの検索例は、図6にて紹介されます(EURUSD H1, 5 ポイント)、おおよそ同じ期間です:
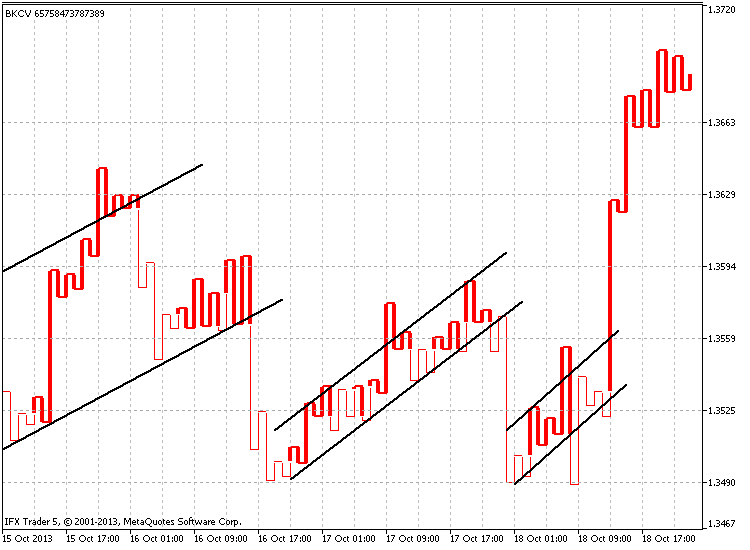
図. 6. チャネルによるトレード
7-10日間継続して上昇する「肩」か、減少する「腰」の出現の後、リバース(降下か上昇)があるという事実に基づく人気の戦略
これは、図7にて示されています。 (GBPUSD H4, 25 ポイント)7月10日ー10月18日
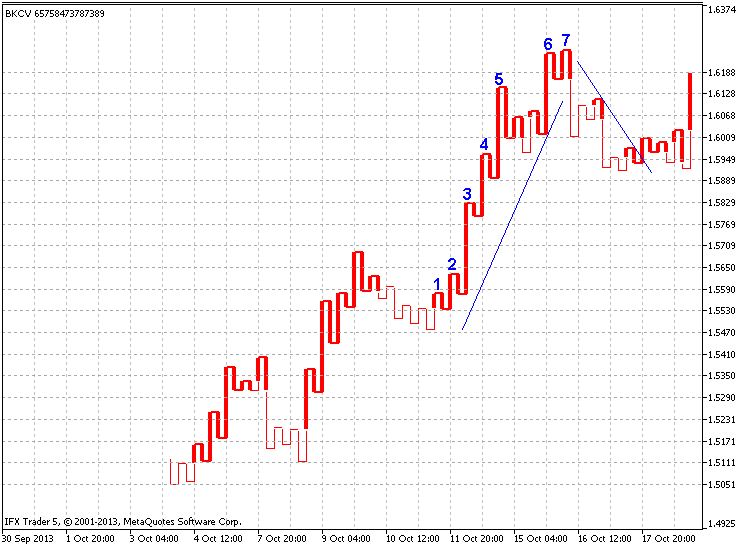
図 7. 7-10日間の「肩」の上昇、「腰」の降下
図をご覧の通り、7つの上昇する「肩」が、以前の上昇の半分(300ポイント)に等しいかなりの降下に続きます。
追加のインジケーターパラメーターを使用する必要性を示すために「価格ラベルによるトレード」戦略を紹介します。価格が買いのために設定した値段を超えた時か、一つ前の価格ラベルを下回った時に市場にエントリーするというものです。
その戦略は、図8に示されています (GBPUSD H4, 30ポイント、修正版):
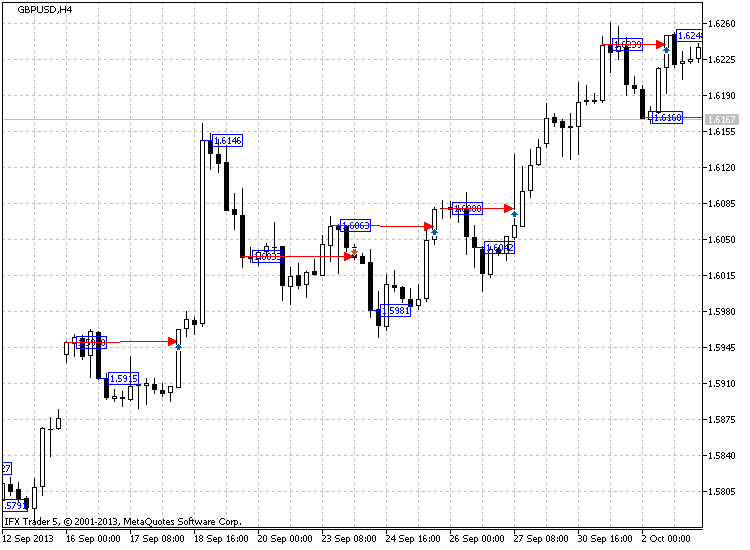
図8. 価格ラベルによるトレード
図8における赤色の矢印は買い・売り時を示します。その矢印は、以前の価格ラベルが突破された地点を示す価格ラベルから移動しています。
時間ラベルは、トレンド方向ポインターとして機能します。時間ラベルの色が線の種類に関連して変化し、YinかYang線の種類がトレンドの方向やリバースを示し、その色が現在の市場の状況を示す手助けをしてくれます。
例えば、図9にて示されている (H4, 1%, 標準型)#IBMのストックチャートを使用してみましょう。
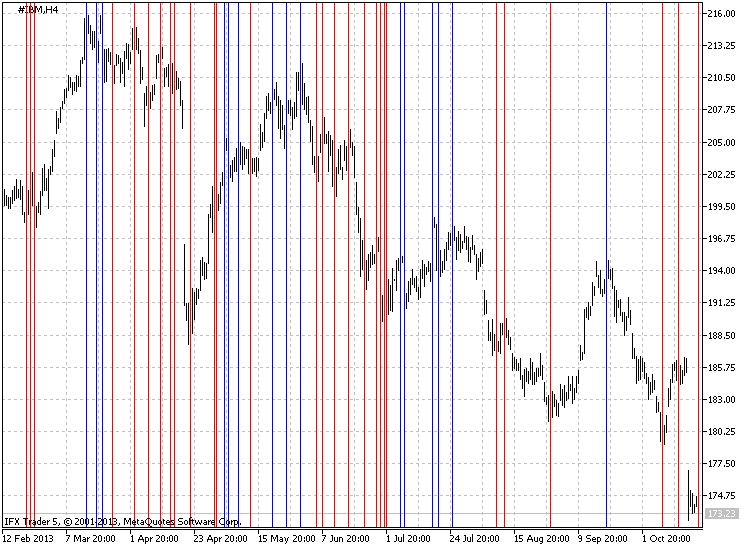
Fig. 9. 時間ラベルを用いたトレンド方向の定義
そのチャートは、青色の線がチャートの頂点に位置し、一方、赤色の線が、底辺に位置していることを示します。
結論
かぎ足チャートは、戦略の基礎やより正確な分析のための補助ツールとして、マーケットのトレードに使用されます。
この記事では、コードやインジケーターの形成のいくつかの特徴を紹介しました。主な目的は停止できるエキストラ機能を持ち、すべての必要な要素を保持するマルチな機能性を持つインジケーターの作成です。
新しいアイディアやインジケーターの改善案を検討したいですし、もしかすれば将来それらを実装できるかもしれません。また、フィードバックを提供してください。インジケーターに関連する質問に答えたいと思います。
この記事は、履歴からチャートを作成するインジケーターの開発に特化したシリーズを続けます。以前の記事は、こちらでご覧になれます。このシリーズは続きますので、また会えるのを楽しみにしています。興味を持っていただきありがとうございました!最適化され安定したコードを作成し、良いトレードができることを願っています。
MetaQuotes Ltdによってロシア語から翻訳されました。
元の記事: https://www.mql5.com/ru/articles/772
 マルチ通貨システム エキスパートアドバイザーの作成
 LinuxにおけるMetaTrader 4
- 無料取引アプリ
- 8千を超えるシグナルをコピー
- 金融ニュースで金融マーケットを探索