
高度適応インディケータ理論および MQL5への実装
はじめに
本稿はJohn F. Ehlers氏の優れた著書2冊を基にしています。それは"Rocket Science for Traders" および "Сybernetic Analysis for Stock and Futures"です。デジタルシグナル処理手法を用い、マーケットサイクル認識に複素数を適用した通常とは異なるマーケット分析方法を読み、このテーマに深く傾倒し、続いてJ.F.Ehlers氏によって紹介されている3つの適応型インディケータをMQL5に実装しようと思い至りました。
本稿では、適応型インディケータの背後にある理論、またそれの MQL5 への実装について述べます。適応型インディケータは非適応型のものと比較されます。
マーケットサイクル測定のための複素数とフェーザ
複素数理論の考え は工学知識のない読者のみなさんにとっては難解なものでしょう。よって、本稿を読む前に複素数の処理に関し、ウィキペディアで 掘り下げて考え、指導書 を一読することをお薦めします。
フェーザ
フェーザまたは 位相ベクトルは、サイクルの偏角および位相を示すベクトルです。オイラー式 によると、正弦波は2つの複素数の合計として表わされます。以下で正弦波サイクルを描写し回転しているフェーザを見てみます。
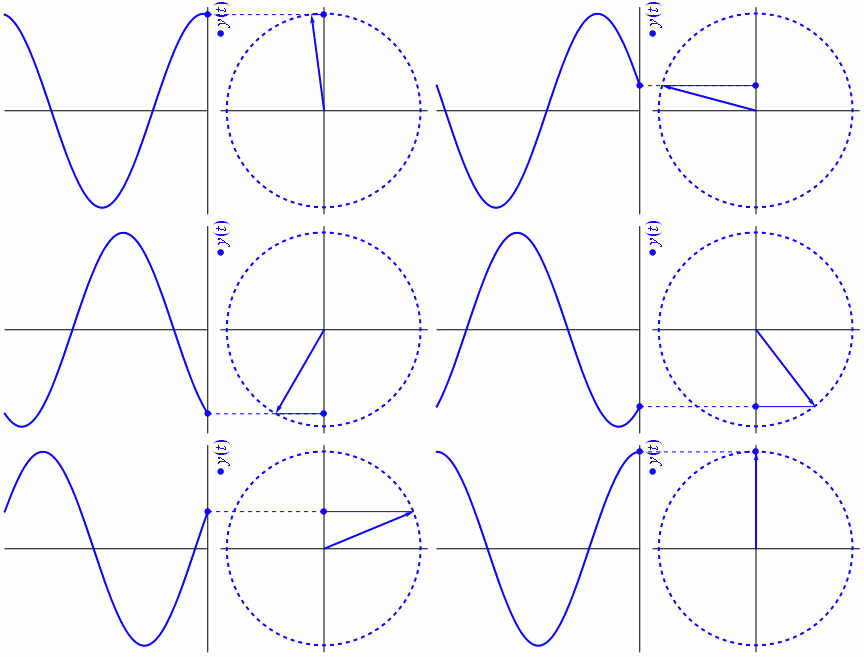
初めてこのアニメーションを見ると、サイクルに対するフェーザの関係を正しく読み取るにはどうすればよいかお困りかもしれません。それを理解するためには、頭を切り替えて、サイクルをアニメーションの左側にある通常波形としてではなく、右側の回転しているフェーザとしてとらえる必要があります。
最初はこれをイメージするのは難しいかもしれませんが、このように考えてはどうでしょうか。フェーザの一周は360°または![]() 弧度で全周期に対しても同じです。フェーザの現在角は円のどの部分(位相)にいるかを指しています。Y 軸は既定位相におけるサイクルの偏角を表します。
弧度で全周期に対しても同じです。フェーザの現在角は円のどの部分(位相)にいるかを指しています。Y 軸は既定位相におけるサイクルの偏角を表します。
フェーザは2つの構成部分に分けることができます。同相コンポーネント(コサイン)および 直角位相コンポーネント(サイン)です。このコンポーネントについて詳細説明は"Rocket Science for Traders" の第6章"Hilbert Transforms"項にあります。ご興味のある方はこの章をじっくり読んでください。
ここでは、適応型インディケータの計算に分析的シグナル(波形)を2つのコンポーネントで構成される複合信号に変換する必要があるという事実にのみ注目します。それではどのようにそれを行うのでしょうか?ヒルベルト変換についてはお話しましたか?実のところ、ヒルベルト変換 がそれを可能にするのです。
サイクル期間の測定
ヒルベルト変換をトレーダーにとって実用的なものとするとめに、John Ehlers氏は著書の中でヒルベルト変換系列を4つのエレメントに分けました。
直角位相コンポーネントに対する式は
![]()
また同相コンポーネントに対する式はは3バー分価格遅延です。
![]()
同相および直角位相コンポーネントを計算したので、現在バーと1本前のバーの位相角から異なる位相計算を導くことができます。現在バーに対する位相は![]() 、また前回バーに対する位相は
、また前回バーに対する位相は ![]() です。三角関数の公式利用
です。三角関数の公式利用
![]()
DeltaPhaseという微分位相に対する式を取得します。
Mr. Ehlers 氏はDeltaPhase変数に追加の制約を加えました。結果は負になることはなく、DeltaPhase は 弧度 <0.1, 1.1> (6~63バーサイクルを意味します)に制約されます実データで計測される DeltaPhase にはノイズが多く、そのため平滑化が必要です。
飛び出しているデータを平滑化する最良の方法はメジアンフィルターで、DeltaPhase の5個のサンプルの中央値がMedianDelta 変数を作成するのです。![]() で除算されたMedianDeltaは 「優勢サイクル」すなわちここで探しているマーケットサイクル計算に対して使用されます。
で除算されたMedianDeltaは 「優勢サイクル」すなわちここで探しているマーケットサイクル計算に対して使用されます。
検証作成中、計測に取り除くべき約0.5のバイヤスがあり、そのバイヤスを取り除くための補正項が追加されているのが判ります。最後に 「優勢サイクル」は それぞれ 0.33と0.15のα値を用いてEMAによって二度平滑化されます。サイクル期間が 6から 40に次第に増加する正弦波に適用されるアルゴリズムのロバスト性を理解するために本を一読されることをお薦めします。
これで理論的知識は得たので MQL5にCyclePeriodインディケータを実装する準備はできました。
周期インディケータ
このインディケータは二つの線で構成されています。サイクルラインはサイクル周期およびトリガーラインを示します。それは基本的にバー1本分遅延したサイクルラインです。"Measuring cycle period"項およびOnCalculate()関数のソースコードの記述に従うなら、どのラインがサイクル期間測定を行うか簡単に相互の関連を示すことができるでしょう。
//+------------------------------------------------------------------+
//|                                                  CyclePeriod.mq5 |
//|                                      Copyright 2011, Investeo.pl |
//|                                               http://Investeo.pl |
//+------------------------------------------------------------------+
#property copyright "Copyright 2011, Investeo.pl"
#property link      "http://Investeo.pl"
#property version   "1.00"
#property indicator_separate_window

#property description "CyclePeriod indicator - described by John F. Ehlers"
#property description "in \"Cybernetic Analysis for Stocks and Futures\""

#property indicator_buffers 2
#property indicator_plots 2
#property indicator_width1 1
#property indicator_width2 1
#property indicator_type1   DRAW_LINE
#property indicator_type2   DRAW_LINE
#property indicator_color1  Green
#property indicator_color2  Red
#property indicator_label1  "Cycle"
#property indicator_label2  "Trigger Line"

#define Price(i) ((high[i]+low[i])/2.0)

double Smooth[];
double Cycle[];
double Trigger[];
//double Price[];
double Q1[]; // Quadrature component
double I1[]; // InPhase component
double DeltaPhase[];
double InstPeriod[];
double CyclePeriod[];


input double InpAlpha=0.07; // alpha
//+------------------------------------------------------------------+
//| Custom indicator initialization function                         |
//+------------------------------------------------------------------+
int OnInit()
  {
//--- indicator buffers mapping
   ArraySetAsSeries(Cycle,true);
   ArraySetAsSeries(CyclePeriod,true);
   ArraySetAsSeries(Trigger,true);
   ArraySetAsSeries(Smooth,true);
   //ArraySetAsSeries(Price,true);

   SetIndexBuffer(0,CyclePeriod,INDICATOR_DATA);
   SetIndexBuffer(1,Trigger,INDICATOR_DATA);

   PlotIndexSetDouble(0,PLOT_EMPTY_VALUE,0.0);
   PlotIndexSetDouble(1,PLOT_EMPTY_VALUE,0.0);

   return(0);
  }
//+------------------------------------------------------------------+
//| Custom indicator iteration function                              |
//+------------------------------------------------------------------+
int OnCalculate(const int rates_total,
                const int prev_calculated,
                const datetime &time[],
                const double &open[],
                const double &high[],
                const double &low[],
                const double &close[],
                const long &tick_volume[],
                const long &volume[],
                const int &spread[])
  {
//---
   long tickCnt[1];
   int i;
   int ticks=CopyTickVolume(Symbol(), 0, 0, 1, tickCnt);
   if(ticks!=1) return(rates_total);
   double DC, MedianDelta;

   Comment(tickCnt[0]);

   if(prev_calculated==0 || tickCnt[0]==1)
     {
      //--- last counted bar will be recounted
      int nLimit=rates_total-prev_calculated-1; // start index for calculations

      ArraySetAsSeries(high,true);
      ArraySetAsSeries(low,true);

      ArrayResize(Smooth,Bars(_Symbol,_Period));
      ArrayResize(Cycle,Bars(_Symbol,_Period));
      //ArrayResize(Price,Bars(_Symbol,_Period));
      ArrayResize(CyclePeriod,Bars(_Symbol,_Period));
      ArrayResize(InstPeriod,Bars(_Symbol,_Period));
      ArrayResize(Q1,Bars(_Symbol,_Period));
      ArrayResize(I1,Bars(_Symbol,_Period));
      ArrayResize(DeltaPhase,Bars(_Symbol,_Period));

      if (nLimit>rates_total-7) // adjust for last bars
         nLimit=rates_total-7;

      for(i=nLimit;i>=0 && !IsStopped();i--)
      {
         Smooth[i] = (Price(i)+2*Price(i+1)+2*Price(i+2)+Price(i+3))/6.0;

         if (i<rates_total-7)
         {
            Cycle[i] = (1.0-0.5*InpAlpha) * (1.0-0.5*InpAlpha) * (Smooth[i]-2.0*Smooth[i+1]+Smooth[i+2])
                      +2.0*(1.0-InpAlpha)*Cycle[i+1]-(1.0-InpAlpha)*(1.0-InpAlpha)*Cycle[i+2];

         } else
         {
            Cycle[i]=(Price(i)-2.0*Price(i+1)+Price(i+2))/4.0;
         }

         Q1[i] = (0.0962*Cycle[i]+0.5769*Cycle[i+2]-0.5769*Cycle[i+4]-0.0962*Cycle[i+6])*(0.5+0.08*InstPeriod[i+1]);
         I1[i] = Cycle[i+3];

         if (Q1[i]!=0.0 && Q1[i+1]!=0.0)
            DeltaPhase[i] = (I1[i]/Q1[i]-I1[i+1]/Q1[i+1])/(1.0+I1[i]*I1[i+1]/(Q1[i]*Q1[i+1]));
         if (DeltaPhase[i] < 0.1)
            DeltaPhase[i] = 0.1;
         if (DeltaPhase[i] > 0.9)
            DeltaPhase[i] = 0.9;

         MedianDelta = Median(DeltaPhase, i, 5);

         if (MedianDelta == 0.0)
            DC = 15.0;
         else
            DC = (6.28318/MedianDelta) + 0.5;

         InstPeriod[i] = 0.33 * DC + 0.67 * InstPeriod[i+1];
         CyclePeriod[i] = 0.15 * InstPeriod[i] + 0.85 * CyclePeriod[i+1];
         Trigger[i] = CyclePeriod[i+1];
      }
     }
//--- return value of prev_calculated for next call
   return(rates_total);
  }
//+------------------------------------------------------------------+

double Median(double& arr[], int idx, int m_len)
{
   double MedianArr[];
   int copied;
   double result = 0.0;

   ArraySetAsSeries(MedianArr, true);
   ArrayResize(MedianArr, m_len);

   copied = ArrayCopy(MedianArr, arr, 0, idx, m_len);
   if (copied == m_len)
   {
      ArraySort(MedianArr);
      if (m_len %2 == 0)
            result = (MedianArr[m_len/2] + MedianArr[(m_len/2)+1])/2.0;
      else
            result = MedianArr[m_len / 2];

   }
   else Print(__FILE__+__FUNCTION__+"median error - wrong number of elements copied.");
   return result;
}
任意のチャートにアタッチすることでそれを検証することができます。それはあらゆる商品、時間枠に対しても動作します。
以下のスクリーンショットをご覧ください。
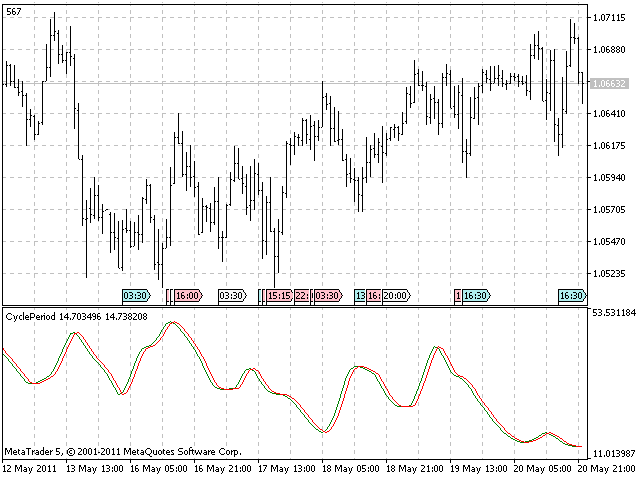
ワークスペースでこのインディケータを用いて新しい種類の適応可能インディケータを実装することができます。マーケットの現在周期に適用するインディケータです。
サイバーサイクルインディケータ
サイバーサイクルインディケータは "Сybernetic analysis for stocks and futures"から取られた高域フィルターです。このフィルターは時系列からサイクルモードコンポーネントだけを残します。
また有限インパルス応答の低域通過フィルターによって平滑化した結果から2本および3本サイクルコンポーネントが抽出されます。
このためのインディケータ MQL5 コードと本に記述のある EFL (トレードステーション)言語から適用される本稿内その他インディケータ
//+------------------------------------------------------------------+
//|                                                   CyberCycle.mq5 |
//|                                      Copyright 2011, Investeo.pl |
//|                                               http://Investeo.pl |
//+------------------------------------------------------------------+
#property copyright "Copyright 2011, Investeo.pl"
#property link      "http://Investeo.pl"
#property version   "1.00"
#property indicator_separate_window

#property description "CyberCycle indicator - described by John F. Ehlers"
#property description "in \"Cybernetic Analysis for Stocks and Futures\""
#property description "This indicator is available for free download."

#property indicator_buffers 2
#property indicator_plots 2
#property indicator_width1 1
#property indicator_width2 1
#property indicator_type1   DRAW_LINE
#property indicator_type2   DRAW_LINE
#property indicator_color1  Green
#property indicator_color2  Red
#property indicator_label1  "Cycle"
#property indicator_label2  "Trigger Line"

#define Price(i) ((high[i]+low[i])/2.0)

double Smooth[];
double Cycle[];
double Trigger[];

input double InpAlpha=0.07; // alpha
//+------------------------------------------------------------------+
//| Custom indicator initialization function                         |
//+------------------------------------------------------------------+
int OnInit()
  {
//--- indicator buffers mapping
   ArraySetAsSeries(Cycle,true);
   ArraySetAsSeries(Trigger,true);
   ArraySetAsSeries(Smooth,true);

   SetIndexBuffer(0,Cycle,INDICATOR_DATA);
   SetIndexBuffer(1,Trigger,INDICATOR_DATA);

   PlotIndexSetDouble(0,PLOT_EMPTY_VALUE,0.0);
   PlotIndexSetDouble(1,PLOT_EMPTY_VALUE,0.0);

   return(0);
  }
//+------------------------------------------------------------------+
//| Custom indicator iteration function                              |
//+------------------------------------------------------------------+
int OnCalculate(const int rates_total,
                const int prev_calculated,
                const datetime &time[],
                const double &open[],
                const double &high[],
                const double &low[],
                const double &close[],
                const long &tick_volume[],
                const long &volume[],
                const int &spread[])
  {
//---
   long tickCnt[1];
   int i;
   int ticks=CopyTickVolume(Symbol(), 0, 0, 1, tickCnt);
   if(ticks!=1) return(rates_total);

   Comment(tickCnt[0]);

   if(prev_calculated==0 || tickCnt[0]==1)
     {
      //--- last counted bar will be recounted
      int nLimit=rates_total-prev_calculated-1; // start index for calculations

      ArraySetAsSeries(high,true);
      ArraySetAsSeries(low,true);

      ArrayResize(Smooth,Bars(_Symbol,_Period));
      ArrayResize(Cycle,Bars(_Symbol,_Period));

      if(nLimit>rates_total-4) // adjust for last bars
         nLimit=rates_total-4;

      for(i=nLimit;i>=0 && !IsStopped();i--)
        {
         Smooth[i]=(Price(i)+2*Price(i+1)+2*Price(i+2)+Price(i+3))/6.0;

         if(i<rates_total-5)
           {
            Cycle[i]=(1.0-0.5*InpAlpha) *(1.0-0.5*InpAlpha) *(Smooth[i]-2.0*Smooth[i+1]+Smooth[i+2])
                     +2.0*(1.0-InpAlpha)*Cycle[i+1]-(1.0-InpAlpha)*(1.0-InpAlpha)*Cycle[i+2];
           }
         else
           {
            Cycle[i]=(Price(i)-2.0*Price(i+1)+Price(i+2))/4.0;
           }

         //Print(__FILE__+__FUNCTION__+" received values: ",rCnt);
         Trigger[i]=Cycle[i+1];
        }
     }
//--- return value of prev_calculated for next call
   return(rates_total);
  }
//+------------------------------------------------------------------+
インディケータのスクリーンショットを以下に貼付しています。
ご存じのことと思いますが、本稿のすべてのインディケータは外見的に似通っていますが、実装は全く異なるアルゴリズムによります。
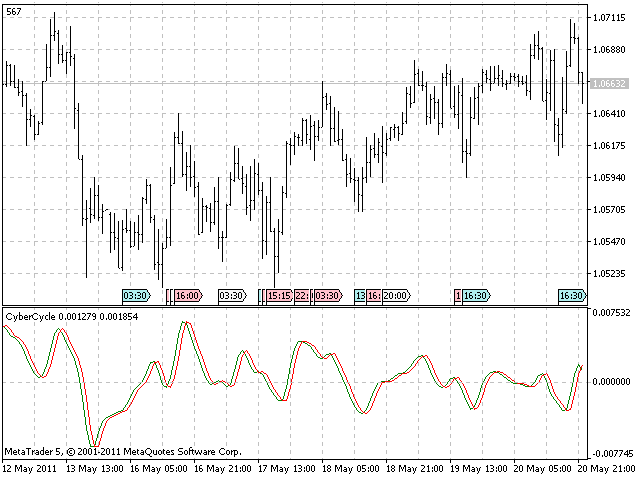
このインディケータに対する元のトレーディングメソッドは簡単です。サイクルラインがトリガーラインの上でクロスしたら買う、です。サイクルラインがトリガーラインの下でクロスしたら売り、です。おそらくみなさんはご自身の戦略とこのインディケータを用いたトレーディングシグナルのモジュールを実装したいと思いわれるでしょうが、それはお薦めです。
サイバーサイクルインディケータの適用
本稿の基本はインディケータを適応可能にする方法を紹介することで、それは静的設定ではなく動的サイクル期間のインプットによって計算する方法です。そのためには CyclePeriod インディケータに連結し現在期間を読み、のちにこの読み出しをOnCalculate() 関数で利用する必要があります。
まず、インディケータのハンドルを取得する必要があります。
hCyclePeriod=iCustom(NULL,0,"CyclePeriod",InpAlpha);
   if(hCyclePeriod==INVALID_HANDLE)
     {
      Print("CyclePeriod indicator not available!");
      return(-1);
     }
それからそれを OnCalculate() 関数内で読みます。
int copied=CopyBuffer(hCyclePeriod,0,i,1,CyclePeriod);
    if(copied<=0)
      {
       Print("FAILURE: Could not get values from CyclePeriod indicator.");
       return -1;
      }
alpha1 = 2.0/(CyclePeriod[0]+1.0);
指数移動平均 は式によって単純移動平均の長さに連携します。適応型サイバーサイクルインディケータで ![]() Mr. Ehlers 氏は 「優勢サイクル」期間をアルファ1係数の計算における長さとして扱いました。
Mr. Ehlers 氏は 「優勢サイクル」期間をアルファ1係数の計算における長さとして扱いました。
以下はソースコード全貌です。
//+------------------------------------------------------------------+
//|                                           AdaptiveCyberCycle.mq5 |
//|                                      Copyright 2011, Investeo.pl |
//|                                               http://Investeo.pl |
//+------------------------------------------------------------------+
#property copyright "Copyright 2011, Investeo.pl"
#property link      "http://Investeo.pl"
#property version   "1.00"
#property indicator_separate_window

#property description "Adaptive CyberCycle indicator - described by John F. Ehlers"
#property description "in \"Cybernetic Analysis for Stocks and Futures\""
#property description "This indicator is available for free download."

#property indicator_buffers 2
#property indicator_plots 2
#property indicator_width1 1
#property indicator_width2 1
#property indicator_type1   DRAW_LINE
#property indicator_type2   DRAW_LINE
#property indicator_color1  Green
#property indicator_color2  Red
#property indicator_label1  "Cycle"
#property indicator_label2  "Trigger Line"

#define Price(i) ((high[i]+low[i])/2.0)

double Smooth[];
double Cycle[];
double Trigger[];

int hCyclePeriod;

input double InpAlpha=0.07; // alpha for Cycle Period
//+------------------------------------------------------------------+
//| Custom indicator initialization function                         |
//+------------------------------------------------------------------+
int OnInit()
  {
//--- indicator buffers mapping
   ArraySetAsSeries(Cycle,true);
   ArraySetAsSeries(Trigger,true);
   ArraySetAsSeries(Smooth,true);

   SetIndexBuffer(0,Cycle,INDICATOR_DATA);
   SetIndexBuffer(1,Trigger,INDICATOR_DATA);

   PlotIndexSetDouble(0,PLOT_EMPTY_VALUE,0.0);
   PlotIndexSetDouble(1,PLOT_EMPTY_VALUE,0.0);

   hCyclePeriod=iCustom(NULL,0,"CyclePeriod",InpAlpha);
   if(hCyclePeriod==INVALID_HANDLE)
     {
      Print("CyclePeriod indicator not available!");
      return(-1);
     }
   return(0);
  }
//+------------------------------------------------------------------+
//| Custom indicator iteration function                              |
//+------------------------------------------------------------------+
int OnCalculate(const int rates_total,
                const int prev_calculated,
                const datetime &time[],
                const double &open[],
                const double &high[],
                const double &low[],
                const double &close[],
                const long &tick_volume[],
                const long &volume[],
                const int &spread[])
  {
//---
   long tickCnt[1];
   int i;
   int ticks=CopyTickVolume(Symbol(), 0, 0, 1, tickCnt);
   if(ticks!=1) return(rates_total);
   double CyclePeriod[1],alpha1;

   Comment(tickCnt[0]);

   if(prev_calculated==0 || tickCnt[0]==1)
     {
      //--- last counted bar will be recounted
      int nLimit=rates_total-prev_calculated-1; // start index for calculations

      ArraySetAsSeries(high,true);
      ArraySetAsSeries(low,true);

      ArrayResize(Smooth,Bars(_Symbol,_Period));
      ArrayResize(Cycle,Bars(_Symbol,_Period));

      if(nLimit>rates_total-4) // adjust for last bars
         nLimit=rates_total-4;

      for(i=nLimit;i>=0 && !IsStopped();i--)
        {
         Smooth[i]=(Price(i)+2*Price(i+1)+2*Price(i+2)+Price(i+3))/6.0;
         int copied=CopyBuffer(hCyclePeriod,0,i,1,CyclePeriod);

         if(copied<=0)
           {
            Print("FAILURE: Could not get values from CyclePeriod indicator.");
            return -1;
           }
         alpha1 = 2.0/(CyclePeriod[0]+1.0);
         //Print(alpha1);
         //Print(CyclePeriod[0]);
         if(i>=0)
           {
            Cycle[i]=(1.0-0.5*alpha1) *(1.0-0.5*alpha1) *(Smooth[i]-2.0*Smooth[i+1]+Smooth[i+2])
                     +2.0*(1.0-alpha1)*Cycle[i+1]-(1.0-alpha1)*(1.0-alpha1)*Cycle[i+2];

            //Print("Smooth["+IntegerToString(i)+"]="+DoubleToString(Smooth[i])+" Cycle["+IntegerToString(i)+"]="+DoubleToString(Cycle[i]));
           }
         else
           {
            Cycle[i]=(Price(i)-2.0*Price(i+1)+Price(i+2))/4.0;
           }

         //Print(__FILE__+__FUNCTION__+" received values: ",rCnt);
         Trigger[i]=Cycle[i+1];
        }
     }
//--- return value of prev_calculated for next call
   return(rates_total);
  }
//+------------------------------------------------------------------+
インディケータについては添付のスクリーンショットを確認ください。
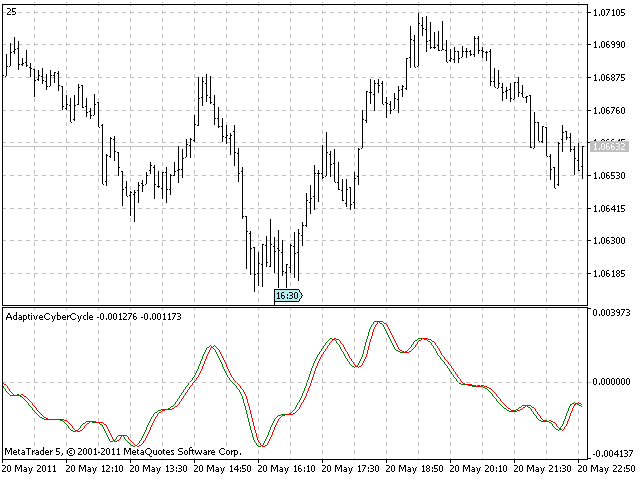
われわれの最初の適応型インディケータは準備完了です。本によると、それは非適応型バージョンよりも反応が速いということです。
売りおよび買いのシグナルは非適応型よりもバー1本分速く起こる必要があります。
もう2つのインディケータに話を進めます。それで適応型インディケータについてのスキームを理解するには十分なはずです。
重心インディケータ
物質に関して重心を語るときはその平衡点を意味します。この概念をトレーディングに導入する発想は多様なフィルターのラグがフィルター係数に関連することを観察することから来ました。
SMAに対して - 単純移動平均、すべての係数は等しく重心は中央にあります。
WMAに対して - 加重移動平均、古い価格よりも直近の価格が重要です。具体的には、 WMA の係数はは三角形の輪郭を記述します。三角形の重心は三角形の底辺の長さの3分の1です。与えられた観測用ウィンドウ上の重心を計算するため導かれる、より一般的な式は以下です。

平衡点の位置は、この位置における価格(式の+1 が導入されました。なぜなら数えるのは1~Nではなく、0~Nだからです)にウィンドウ数を乗じた範囲内にあるポジションの積の総和をウィンドウ内の価格合計で割ったものです。
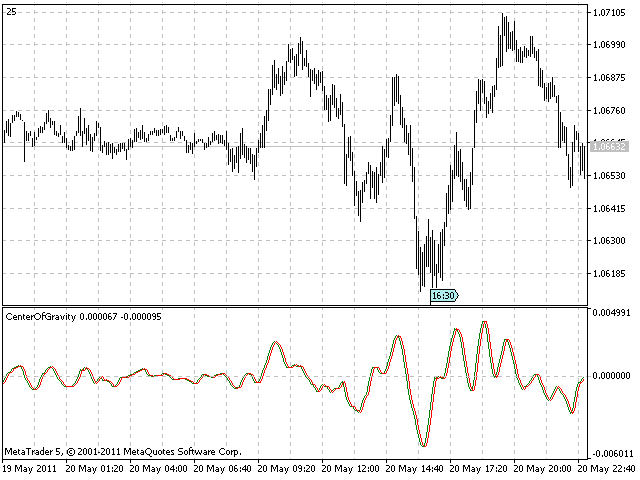
CG の主な特性は価格の揺れに応じて減少し増加し、基本的にそれはゼロラグのオシレータです。
以下がソースコードです。
//+------------------------------------------------------------------+
//|                                              CenterOfGravity.mq5 |
//|                                      Copyright 2011, Investeo.pl |
//|                                               http://Investeo.pl |
//+------------------------------------------------------------------+
#property copyright "Copyright 2011, Investeo.pl"
#property link      "http://Investeo.pl"
#property version   "1.00"
#property indicator_separate_window

#property description "CG indicator - described by John F. Ehlers"
#property description "in \"Cybernetic Analysis for Stocks and Futures\""
#property description "This indicator is available for free download."

#property indicator_buffers 2
#property indicator_plots 2
#property indicator_width1 1
#property indicator_width2 1
#property indicator_type1   DRAW_LINE
#property indicator_type2   DRAW_LINE
#property indicator_color1  Green
#property indicator_color2  Red
#property indicator_label1  "Cycle"
#property indicator_label2  "Trigger Line"

#define Price(i) ((high[i]+low[i])/2.0)

double Smooth[];
double Cycle[];
double Trigger[];

input double InpAlpha=0.07; // alpha
input int InpCGLength=10; //CG window size

//+------------------------------------------------------------------+
//| Custom indicator initialization function                         |
//+------------------------------------------------------------------+
int OnInit()
  {
//--- indicator buffers mapping
   ArraySetAsSeries(Cycle,true);
   ArraySetAsSeries(Trigger,true);
   ArraySetAsSeries(Smooth,true);

   SetIndexBuffer(0,Cycle,INDICATOR_DATA);
   SetIndexBuffer(1,Trigger,INDICATOR_DATA);

   PlotIndexSetDouble(0,PLOT_EMPTY_VALUE,0.0);
   PlotIndexSetDouble(1,PLOT_EMPTY_VALUE,0.0);

   return(0);
  }
//+------------------------------------------------------------------+
//| Custom indicator iteration function                              |
//+------------------------------------------------------------------+
int OnCalculate(const int rates_total,
                const int prev_calculated,
                const datetime &time[],
                const double &open[],
                const double &high[],
                const double &low[],
                const double &close[],
                const long &tick_volume[],
                const long &volume[],
                const int &spread[])
  {
//---
   long tickCnt[1];
   int i;
   double Num, Denom; // Numerator and Denominator for CG
   int ticks=CopyTickVolume(Symbol(), 0, 0, 1, tickCnt);
   if(ticks!=1) return(rates_total);

   Comment(tickCnt[0]);

   if(prev_calculated==0 || tickCnt[0]==1)
     {
      //--- last counted bar will be recounted
      int nLimit=rates_total-prev_calculated-1; // start index for calculations

      ArraySetAsSeries(high,true);
      ArraySetAsSeries(low,true);

      ArrayResize(Smooth,Bars(_Symbol,_Period));
      ArrayResize(Cycle,Bars(_Symbol,_Period));

      if(nLimit>rates_total-InpCGLength) // adjust for last bars
         nLimit=rates_total-InpCGLength;

      for(i=nLimit;i>=0 && !IsStopped();i--)
        {
         Num = 0.0;
         Denom = 0.0;
         for (int count=0; count<InpCGLength; count++)
            {
               Num += (1.0+count)*Price(i+count);
               Denom += Price(i+count);
            }
         if (Denom != 0.0)
            Cycle[i] = -Num/Denom+(InpCGLength+1.0)/2.0;
         else
            Cycle[i] = 0.0;

         //Print(__FILE__+__FUNCTION__+" received values: ",rCnt);
         Trigger[i]=Cycle[i+1];
        }
     }
//--- return value of prev_calculated for next call
   return(rates_total);
  }
//+------------------------------------------------------------------+
スクリーンショットは以下です。小さいラグに注意します。
適応型重心インディケータ
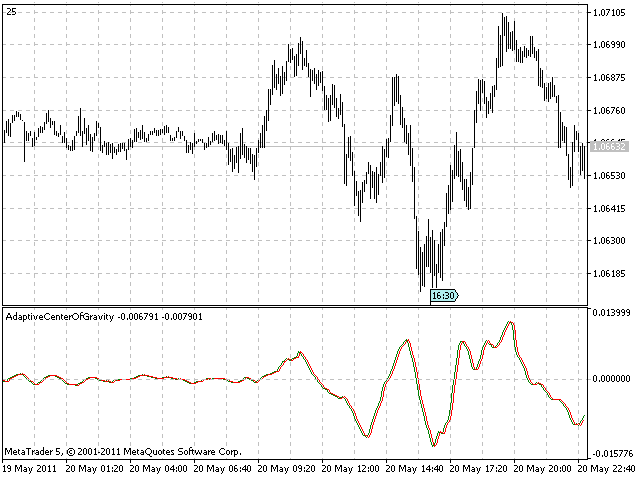
CG オシレータは固定長×ウィンドウ上に重心を見つけます。適応型CG オシレータは測定された優勢サイクル期間の半分を動的ウィンドウ長として使用します。計測された優勢サイクル期間の半分を抽出するためには以下のコードが使用されました。
copied=CopyBuffer(hCyclePeriod,0,i,1,CyclePeriod);

if(copied<=0)
  {
   Print("FAILURE: Could not get values from CyclePeriod indicator.");
   return -1;
  }
CG_len = floor(CyclePeriod[0]/2.0);
以下でインディケータソースコードの全貌を確認し、それを適応型サイバーサイクルインディケータと共に非適応バージョンに対しても類似性を比較します。
//+------------------------------------------------------------------+
//|                                      AdaptiveCenterOfGravity.mq5 |
//|                                      Copyright 2011, Investeo.pl |
//|                                               http://Investeo.pl |
//+------------------------------------------------------------------+
#property copyright "Copyright 2011, Investeo.pl"
#property link      "http://Investeo.pl"
#property version   "1.00"
#property indicator_separate_window

#property description "Adaptive CG indicator - described by John F. Ehlers"
#property description "in \"Cybernetic Analysis for Stocks and Futures\""
#property description "This indicator is available for free download."

#property indicator_buffers 2
#property indicator_plots 2
#property indicator_width1 1
#property indicator_width2 1
#property indicator_type1   DRAW_LINE
#property indicator_type2   DRAW_LINE
#property indicator_color1  Green
#property indicator_color2  Red
#property indicator_label1  "Cycle"
#property indicator_label2  "Trigger Line"

#define Price(i) ((high[i]+low[i])/2.0)

double Smooth[];
double Cycle[];
double Trigger[];

int hCyclePeriod;

input double InpAlpha=0.07; // alpha
//+------------------------------------------------------------------+
//| Custom indicator initialization function                         |
//+------------------------------------------------------------------+
int OnInit()
  {
//--- indicator buffers mapping
   ArraySetAsSeries(Cycle,true);
   ArraySetAsSeries(Trigger,true);
   ArraySetAsSeries(Smooth,true);

   SetIndexBuffer(0,Cycle,INDICATOR_DATA);
   SetIndexBuffer(1,Trigger,INDICATOR_DATA);

   PlotIndexSetDouble(0,PLOT_EMPTY_VALUE,0.0);
   PlotIndexSetDouble(1,PLOT_EMPTY_VALUE,0.0);

   hCyclePeriod=iCustom(NULL,0,"CyclePeriod",InpAlpha);
   if(hCyclePeriod==INVALID_HANDLE)
     {
      Print("CyclePeriod indicator not available!");
      return(-1);
     }

   return(0);
  }
//+------------------------------------------------------------------+
//| Custom indicator iteration function                              |
//+------------------------------------------------------------------+
int OnCalculate(const int rates_total,
                const int prev_calculated,
                const datetime &time[],
                const double &open[],
                const double &high[],
                const double &low[],
                const double &close[],
                const long &tick_volume[],
                const long &volume[],
                const int &spread[])
  {
//---
   long tickCnt[1];
   int i, copied;
   double Num,Denom; // Numerator and Denominator for CG
   double CG_len;
   int ticks=CopyTickVolume(Symbol(), 0, 0, 1, tickCnt);
   if(ticks!=1) return(rates_total);
   double CyclePeriod[1];

   Comment(tickCnt[0]);

   if(prev_calculated==0 || tickCnt[0]==1)
     {
      //--- last counted bar will be recounted
      int nLimit=rates_total-prev_calculated-1; // start index for calculations

      ArraySetAsSeries(high,true);
      ArraySetAsSeries(low,true);

      ArrayResize(Smooth,Bars(_Symbol,_Period));
      ArrayResize(Cycle,Bars(_Symbol,_Period));

      copied=CopyBuffer(hCyclePeriod,0,0,1,CyclePeriod);

      if(copied<=0)
        {
         Print("FAILURE: Could not get values from CyclePeriod indicator.");
         return -1;
        }

      if(nLimit>rates_total-int(CyclePeriod[0])-2) // adjust for last bars
         nLimit=rates_total-int(CyclePeriod[0])-2;


      for(i=nLimit;i>=0 && !IsStopped();i--)
        {
         copied=CopyBuffer(hCyclePeriod,0,i,1,CyclePeriod);

         if(copied<=0)
           {
            Print("FAILURE: Could not get values from CyclePeriod indicator.");
            return -1;
           }
         CG_len = floor(CyclePeriod[0]/2.0);
         //Print("CG_len="+DoubleToString(CG_len));

         Num=0.0;
         Denom=0.0;
         for(int count=0; count<int(CG_len); count++)
           {
            Num+=(1.0+count)*Price(i+count);
            Denom+=Price(i+count);
           }
         if(Denom!=0.0)
            Cycle[i]=-Num/Denom+(CG_len+1.0)/2.0;
         else
            Cycle[i]=0.0;

         //Print(__FILE__+__FUNCTION__+" received values: ",rCnt);
         Trigger[i]=Cycle[i+1];
        }
     }
//--- return value of prev_calculated for next call
   return(rates_total);
  }
//+------------------------------------------------------------------+
下に貼付した適応型CG インディケータのスクリーンショットをご覧ください。
RVI インディケータ
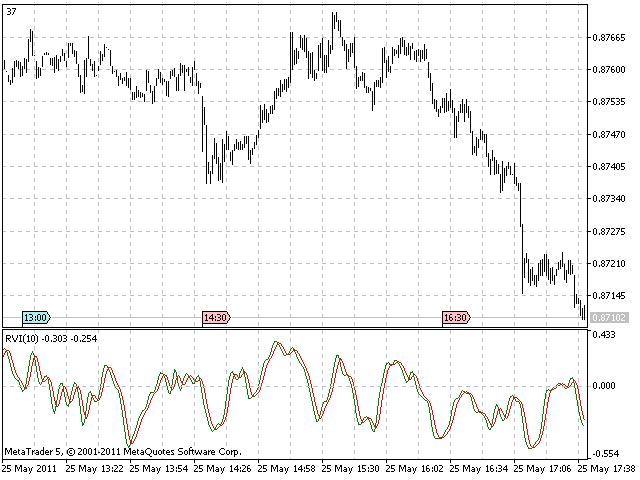
RVI はRelative Vigor Index(相対活力指数)を表します。このインディケータの基本理論は価格がブルマーケットにおいて始値よりも高く、ベアマーケットでは終値が始値よりも低いというものです。
変動の活力は日次のトレーディング範囲に対して終値の始値への差によって計測されます。

これはMetaTrader 5インストールに内蔵されているためMetaTraderユーザーにかなり知られたインディケータです。
参考のためにやはりソースコードを貼付します。
//+------------------------------------------------------------------+
//|                                                          RVI.mq5 |
//|                        Copyright 2009, MetaQuotes Software Corp. |
//|                                              https://www.mql5.com |
//+------------------------------------------------------------------+
#property copyright   "2009, MetaQuotes Software Corp."
#property link        "https://www.mql5.com"
#property description "Relative Vigor Index"
//--- indicator settings
#property indicator_separate_window
#property indicator_buffers 2
#property indicator_plots   2
#property indicator_type1   DRAW_LINE
#property indicator_type2   DRAW_LINE
#property indicator_color1  Green
#property indicator_color2  Red
#property indicator_label1  "RVI"
#property indicator_label2  "Signal"
//--- input parameters
input int InpRVIPeriod=10; // Period
//--- indicator buffers
double    ExtRVIBuffer[];
double    ExtSignalBuffer[];
//---
#define TRIANGLE_PERIOD  3
#define AVERAGE_PERIOD   (TRIANGLE_PERIOD*2)
//+------------------------------------------------------------------+
//| Custom indicator initialization function                         |
//+------------------------------------------------------------------+
void OnInit()
  {
//--- indicator buffers mapping
   SetIndexBuffer(0,ExtRVIBuffer,INDICATOR_DATA);
   SetIndexBuffer(1,ExtSignalBuffer,INDICATOR_DATA);
   IndicatorSetInteger(INDICATOR_DIGITS,3);
//--- sets first bar from what index will be drawn
   PlotIndexSetInteger(0,PLOT_DRAW_BEGIN,(InpRVIPeriod-1)+TRIANGLE_PERIOD);
   PlotIndexSetInteger(1,PLOT_DRAW_BEGIN,(InpRVIPeriod-1)+AVERAGE_PERIOD);
//--- name for DataWindow and indicator subwindow label
   IndicatorSetString(INDICATOR_SHORTNAME,"RVI("+string(InpRVIPeriod)+")");
   PlotIndexSetString(0,PLOT_LABEL,"RVI("+string(InpRVIPeriod)+")");
   PlotIndexSetString(1,PLOT_LABEL,"Signal("+string(InpRVIPeriod)+")");
//--- initialization done
  }
//+------------------------------------------------------------------+
//| Relative Vigor Index                                             |
//+------------------------------------------------------------------+
int OnCalculate(const int rates_total,const int prev_calculated,
                const datetime &Time[],
                const double &Open[],
                const double &High[],
                const double &Low[],
                const double &Close[],
                const long &TickVolume[],
                const long &Volume[],
                const int &Spread[])
  {
   int    i,j,nLimit;
   double dValueUp,dValueDown,dNum,dDeNum;
//--- check for bars count
   if(rates_total<=InpRVIPeriod+AVERAGE_PERIOD+2) return(0); // exit with zero result
//--- check for possible errors
   if(prev_calculated<0) return(0); // exit with zero result
//--- last counted bar will be recounted
   nLimit=InpRVIPeriod+2;
   if(prev_calculated>InpRVIPeriod+TRIANGLE_PERIOD+2)
      nLimit=prev_calculated-1;
//--- set empty value for uncalculated bars
   if(prev_calculated==0)
     {
      for(i=0;i<InpRVIPeriod+TRIANGLE_PERIOD;i++) ExtRVIBuffer[i]=0.0;
      for(i=0;i<InpRVIPeriod+AVERAGE_PERIOD;i++)  ExtSignalBuffer[i]=0.0;
     }
//--- RVI counted in the 1-st buffer
   for(i=nLimit;i<rates_total && !IsStopped();i++)
     {
      dNum=0.0;
      dDeNum=0.0;
      for(j=i;j>i-InpRVIPeriod;j--)
        {
         dValueUp=Close[j]-Open[j]+2*(Close[j-1]-Open[j-1])+2*(Close[j-2]-Open[j-2])+Close[j-3]-Open[j-3];
         dValueDown=High[j]-Low[j]+2*(High[j-1]-Low[j-1])+2*(High[j-2]-Low[j-2])+High[j-3]-Low[j-3];
         dNum+=dValueUp;
         dDeNum+=dValueDown;
        }
      if(dDeNum!=0.0)
         ExtRVIBuffer[i]=dNum/dDeNum;
      else
         ExtRVIBuffer[i]=dNum;
     }
//--- signal line counted in the 2-nd buffer
   nLimit=InpRVIPeriod+TRIANGLE_PERIOD+2;
   if(prev_calculated>InpRVIPeriod+AVERAGE_PERIOD+2)
      nLimit=prev_calculated-1;
   for(i=nLimit;i<rates_total && !IsStopped();i++)
      ExtSignalBuffer[i]=(ExtRVIBuffer[i]+2*ExtRVIBuffer[i-1]+2*ExtRVIBuffer[i-2]+ExtRVIBuffer[i-3])/AVERAGE_PERIOD;

//--- OnCalculate done. Return new prev_calculated.
   return(rates_total);
  }
//+------------------------------------------------------------------+
以下は初期値10に設定された期間を伴う標準的な RVI インディケータのスクリーンショットです。
適応型RVI インディケータ
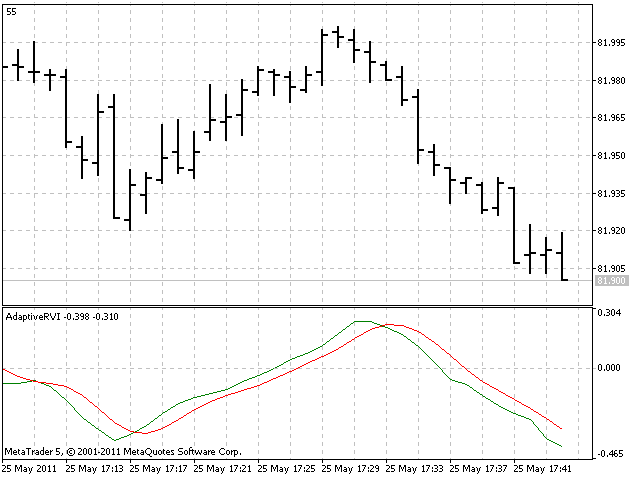
前出の2つの適応型インディケータでは CyclePeriod から「優勢サイクル」インディケータを抽出し、それを RVI 期間に適用する必要があります。「長さ」変数は期間の4本バー加重移動平均として計算されます。
copied=CopyBuffer(hCyclePeriod,0,0,4,CyclePeriod);

if(copied<=0)
  {
   Print("FAILURE: Could not get values from CyclePeriod indicator.");
   return -1;
  }
AdaptiveRVIPeriod = int(floor((4*CyclePeriod[0]+3*CyclePeriod[1]+2*CyclePeriod[2]+CyclePeriod[3])/20.0));
以下が適応型RVIインディケータのソースコード全貌です。
//+------------------------------------------------------------------+
//|                                                 Adaptive RVI.mq5 |
//|                        Based on RVI by MetaQuotes Software Corp. |
//|                        Copyright 2009, MetaQuotes Software Corp. |
//|                                              https://www.mql5.com |
//+------------------------------------------------------------------+
#property copyright   "2009, MetaQuotes Software Corp."
#property copyright   "2011, Adaptive version Investeo.pl"
#property link        "https://www.mql5.com"
#property description "Adaptive Relative Vigor Index"
//--- indicator settings
#property indicator_separate_window
#property indicator_buffers 2
#property indicator_plots   2
#property indicator_type1   DRAW_LINE
#property indicator_type2   DRAW_LINE
#property indicator_color1  Green
#property indicator_color2  Red
#property indicator_label1  "AdaptiveRVI"
#property indicator_label2  "Signal"

#define Price(i) ((high[i]+low[i])/2.0)

//--- input parameters
input int InpRVIPeriod=10; // Initial RVI Period
//--- indicator buffers
double    ExtRVIBuffer[];
double    ExtSignalBuffer[];
//---
int hCyclePeriod;
input double InpAlpha=0.07; // alpha for Cycle Period
int AdaptiveRVIPeriod;

#define TRIANGLE_PERIOD  3
#define AVERAGE_PERIOD   (TRIANGLE_PERIOD*2)
//+------------------------------------------------------------------+
//| Custom indicator initialization function                         |
//+------------------------------------------------------------------+
int OnInit()
  {
//--- indicator buffers mapping
   SetIndexBuffer(0,ExtRVIBuffer,INDICATOR_DATA);
   SetIndexBuffer(1,ExtSignalBuffer,INDICATOR_DATA);
   IndicatorSetInteger(INDICATOR_DIGITS,3);
   hCyclePeriod=iCustom(NULL,0,"CyclePeriod",InpAlpha);
   if(hCyclePeriod==INVALID_HANDLE)
     {
      Print("CyclePeriod indicator not available!");
      return(-1);
     }

//--- sets first bar from what index will be drawn
   PlotIndexSetInteger(0,PLOT_DRAW_BEGIN,(InpRVIPeriod-1)+TRIANGLE_PERIOD);
   PlotIndexSetInteger(1,PLOT_DRAW_BEGIN,(InpRVIPeriod-1)+AVERAGE_PERIOD);
//--- name for DataWindow and indicator subwindow label
   IndicatorSetString(INDICATOR_SHORTNAME,"AdaptiveRVI");
   PlotIndexSetString(0,PLOT_LABEL,"AdaptiveRVI");
   PlotIndexSetString(1,PLOT_LABEL,"Signal");
//--- initialization done
  return 0;
  }
//+------------------------------------------------------------------+
//| Relative Vigor Index                                             |
//+------------------------------------------------------------------+
int OnCalculate(const int rates_total,const int prev_calculated,
                const datetime &Time[],
                const double &Open[],
                const double &High[],
                const double &Low[],
                const double &Close[],
                const long &TickVolume[],
                const long &Volume[],
                const int &Spread[])
  {
   int    i,j,nLimit;
   double dValueUp,dValueDown,dNum,dDeNum;
   double CyclePeriod[4];
   int copied;

   copied=CopyBuffer(hCyclePeriod,0,0,4,CyclePeriod);

         if(copied<=0)
           {
            Print("FAILURE: Could not get values from CyclePeriod indicator.");
            return -1;
           }
   AdaptiveRVIPeriod = int(floor((4*CyclePeriod[0]+3*CyclePeriod[1]+2*CyclePeriod[2]+CyclePeriod[3])/20.0));
//--- check for bars count
   if(rates_total<=AdaptiveRVIPeriod+AVERAGE_PERIOD+2) return(0); // exit with zero result
//--- check for possible errors
   if(prev_calculated<0) return(0); // exit with zero result
//--- last counted bar will be recounted
   nLimit=AdaptiveRVIPeriod+2;
   if(prev_calculated>AdaptiveRVIPeriod+TRIANGLE_PERIOD+2)
      nLimit=prev_calculated-1;
//--- set empty value for uncalculated bars
   if(prev_calculated==0)
     {
      for(i=0;i<AdaptiveRVIPeriod+TRIANGLE_PERIOD;i++) ExtRVIBuffer[i]=0.0;
      for(i=0;i<AdaptiveRVIPeriod+AVERAGE_PERIOD;i++)  ExtSignalBuffer[i]=0.0;
     }
//--- RVI counted in the 1-st buffer
   for(i=nLimit;i<rates_total && !IsStopped();i++)
     {
      copied=CopyBuffer(hCyclePeriod,0,rates_total-i-1,4,CyclePeriod);

         if(copied<=0)
           {
            Print("FAILURE: Could not get values from CyclePeriod indicator.");
            return -1;
           }
      AdaptiveRVIPeriod = int(floor((4*CyclePeriod[0]+3*CyclePeriod[1]+2*CyclePeriod[2]+CyclePeriod[3])/20.0));
      dNum=0.0;
      dDeNum=0.0;
      for(j=i;j>MathMax(i-AdaptiveRVIPeriod, 3);j--)
        {
         //Print("rates_total="+IntegerToString(rates_total)+" nLimit="+IntegerToString(nLimit)+
         //      " AdaptiveRVIPeriod="+IntegerToString(AdaptiveRVIPeriod)+" j="+IntegerToString(j));
         dValueUp=Close[j]-Open[j]+2*(Close[j-1]-Open[j-1])+2*(Close[j-2]-Open[j-2])+Close[j-3]-Open[j-3];
         dValueDown=High[j]-Low[j]+2*(High[j-1]-Low[j-1])+2*(High[j-2]-Low[j-2])+High[j-3]-Low[j-3];
         dNum+=dValueUp;
         dDeNum+=dValueDown;
        }
      if(dDeNum!=0.0)
         ExtRVIBuffer[i]=dNum/dDeNum;
      else
         ExtRVIBuffer[i]=dNum;
     }
//--- signal line counted in the 2-nd buffer
   nLimit=AdaptiveRVIPeriod+TRIANGLE_PERIOD+2;
   if(prev_calculated>AdaptiveRVIPeriod+AVERAGE_PERIOD+2)
      nLimit=prev_calculated-1;
   for(i=nLimit;i<rates_total && !IsStopped();i++)
    ExtSignalBuffer[i]=(ExtRVIBuffer[i]+2*ExtRVIBuffer[i-1]+2*ExtRVIBuffer[i-2]+ExtRVIBuffer[i-3])/AVERAGE_PERIOD;

//--- OnCalculate done. Return new prev_calculated.
   return(rates_total);
  }
//+------------------------------------------------------------------+
動的ウィンドウ長を伴う適応型 RVI インディケータのスクリーンショットです。
おわりに
本稿では3件の適応型テクニカルインディケータの性質とMQL5 実装についてご紹介しました。
適応型インディケータを実装するメカニズムは本稿を読んだ後、明確に理解可能なことと思います。ここに記述されたインディケータについてはすべて添付があります。
著者は実験し、すでに使用可能なインディケータから別の適応型インディケータを構築されることを推奨します。
MetaQuotes Ltdにより英語から翻訳されました。
元の記事: https://www.mql5.com/en/articles/288
 サルでも解るMQL5 ウィザード
 指数平滑法を用いた時系列予測
 Expert Advisors最適化のカスタム基準作成
 インディケータの統計パラメータ分析
- 無料取引アプリ
- 8千を超えるシグナルをコピー
- 金融ニュースで金融マーケットを探索