Piyush Lalsingh Ratnu / Profilo
- Informazioni
|
no
esperienza
|
0
prodotti
|
0
versioni demo
|
|
0
lavori
|
0
segnali
|
0
iscritti
|
Piyush Ratnu is an independent forex market analyst & trader with core expertise in XAUUSD/Spot Gold.
With more than 15 years of experience as a Financial Market Analyst, Piyush Ratnu held the responsibility of developing and refining a series of algorithms & analytic tools to simplify the trading processes. His tools and algorithms were defined and rated as “unlike tools seen in the market before, extensively designed and most importantly, functional and logical” by some of the top financial companies and analysts at New York, London and Dubai.
Piyush Ratnu holds an experience of 290,000 trades, 1,790,000 pips calculated with a remarkable trading execution rate of 2 trades per second in an ideal scenario with profit booking in less than 8 seconds tracing 60+ pips/trade, as per audited and verified track record of last 10 years.
Core strength:
Economics, Economic Data Analysis, Spot Gold (XAUUSD), USD Majors, SR MTF Range Trading, Chart Patterns,
Volume Trading, Day Trading & Position Trading
Trading style
Fundamental based Intra-day trading.
Analysis based on proprietary algorithm + 90+ parameters.
Core focus: US Futures and XAUUSD | Spot Gold
Motto
Plan your trade, and then trade your plan!
Detailed research: https://www.reddit.com/r/prgoldanalysis
Track Record since 2021: https://bit.ly/PRxauusdAnalysis
MyFxBook:
X.com: https://x.com/piyushratnu
Insta: https://www.instagram.com/piyushratnuofficial
Connect for more details:
Telegram: https://www.T.me/PiyushRatnuOfficial
Risk Disclaimer:
Trading in foreign exchange (“Forex”) on margins entails high risk and is not suitable for all investors. Past performance is not an indication of future results. In this case, as well, the high degree of leverage can act both against you and for you. Trading foreign exchange, indices and commodities, on margin, carries a high level of risk and may not be suitable for all individuals.
The information made available by Piyush Ratnu is for your general information only and is not intended to address your particular requirements. In particular, the information does not constitute any form of advice or recommendation and is not intended to be relied upon by users in making, or refraining from making, any investment decisions.
Piyush Ratnu does not in any way guarantee that this information is free from mistakes, errors, or material misstatements. It also does not guarantee that this information is of a timely nature. Investing in Open Markets involves a great deal of risk, including the loss of all or a portion of your investment, as well as emotional distress. All risks, losses and costs associated with investing, including total loss of principal, are your responsibility. The views and opinions expressed in this article are those of the authors and do not necessarily reflect the official policy or position(s) of Piyush Ratnu.
Piyush Lalsingh Ratnu
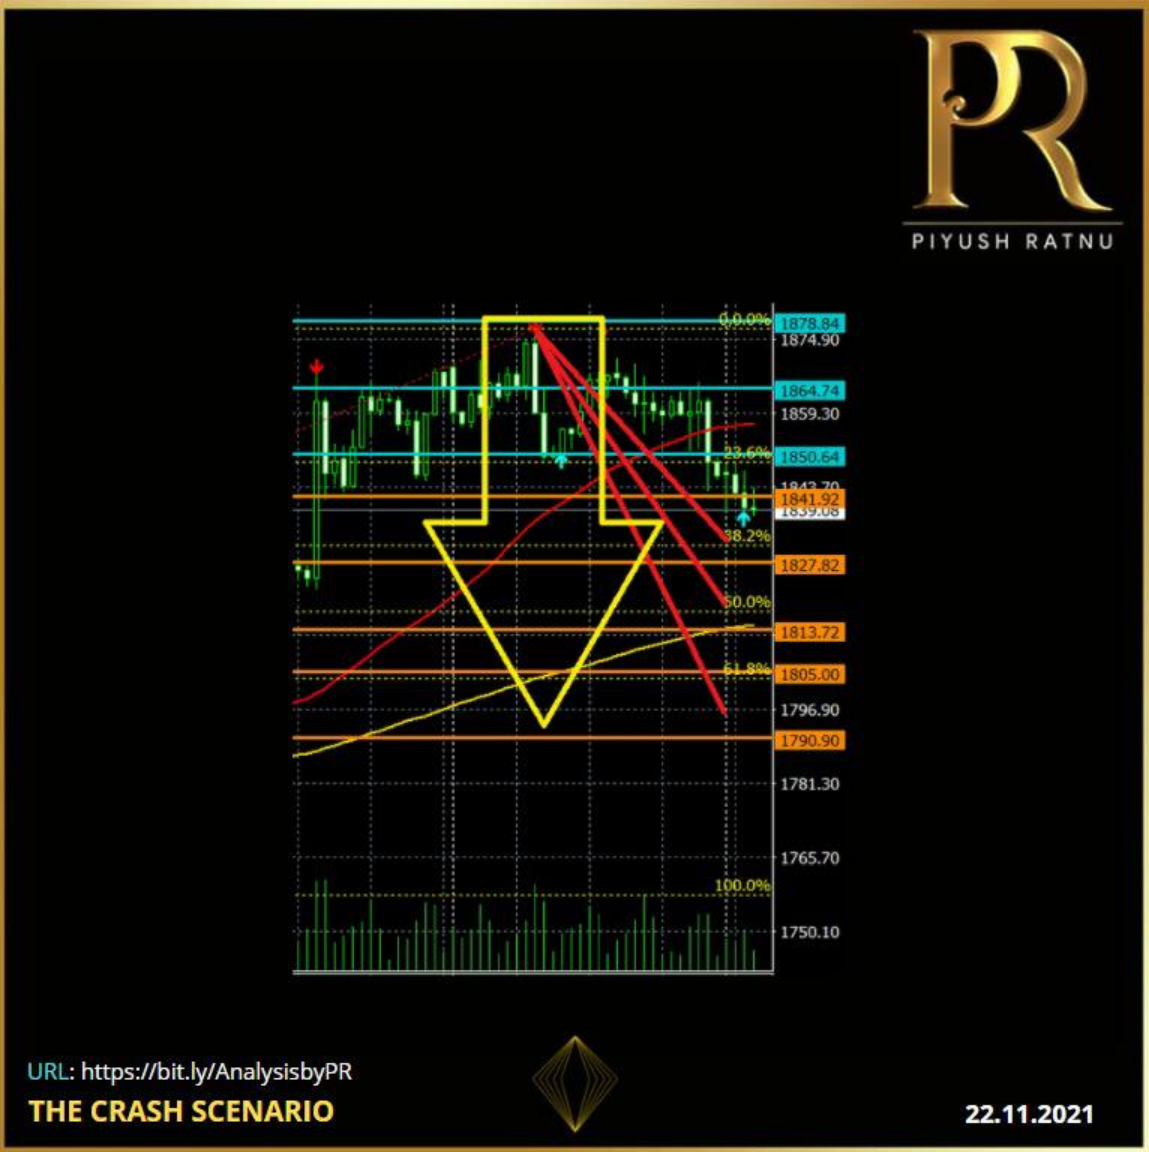
THE Crash SCENARIO: 22.11.2021
Join TELEGRAM channel for latest updates and market analysis:
Copy this url and paste in browser: https://bit.ly/AnalysisbyPR
#PiyushRatnu #BullionTrading #Trading #Dubai
Join TELEGRAM channel for latest updates and market analysis:
Copy this url and paste in browser: https://bit.ly/AnalysisbyPR
#PiyushRatnu #BullionTrading #Trading #Dubai

Piyush Lalsingh Ratnu
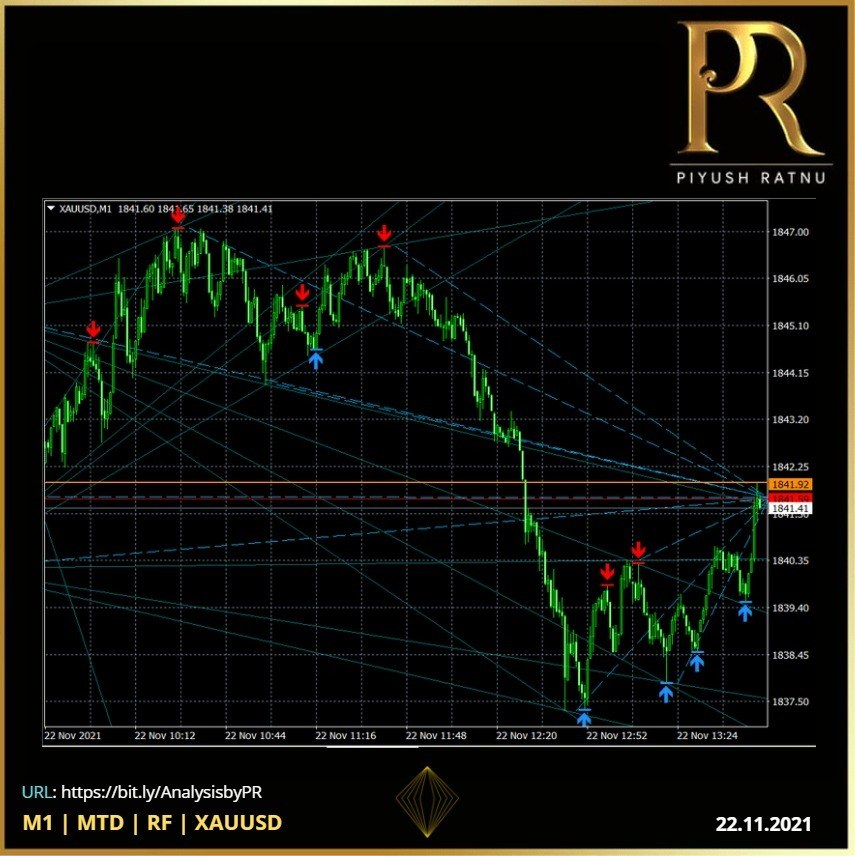
Launched new algorithm successfully.
Combination of 36 parameters | Exclusively for SPOT GOLD.
First set of BUY trades: Entry levels suggested by Algorithm.
Net Average: 400 pips in 30 minutes.
Join TELEGRAM channel for latest updates and market analysis:
Copy this url and paste in browser: https://bit.ly/AnalysisbyPR
#PiyushRatnu #BullionTrading #Trading #Dubai

Piyush Lalsingh Ratnu

The coordinated effort to lower energy prices: WHY?
Core bonds rose yesterday with USTs outperforming the Bund, shrugging off a tailed US 20y bond sale. The US yield curve bull flattened with changes ranging from -1.8 bps (2y) to -5.3 bps (30y). US housing starts disappointed in contrast to building permits, suggesting demand is solid but material and labour shortages weigh on construction. In addition, Brent oil prices fell towards the $80/b neckline after word got out that US President Biden wants the Federal Trade Commission to use all tools to examine fuel price wrongdoing.
Markets took it as another hint the US will eventually release some of the strategic oil reserves to ease prices. The oil price decline was a key driver for faltering inflation expectations (-3 to -4 bps) in the US. German yields closed flat on face value but real yields (10y) hit a new all-time low at -2.25% in underlying dynamics. This was the main reason for EUR/USD’s lackluster performance even though the greenback corrected in general.
Two stories feature Asian dealings this morning. Japanese stocks erase previous losses after newspaper Nikkei reported the new Japanese fiscal stimulus package would amount to 55.7tn yen compared to the 40tn previously estimated. Chances of government support being ramped up rose after Q3 GDP figures last week disappointed heavily. The yen loses out vs. USD and EUR. A survey by the RBNZ showing inflation expectations rose to a decade high spurred rate hike bets and lifts the kiwi dollar (cfr. infra). Core bonds and other dollar pairs trade flat.
Reuters reports that China is working on the release of crude oil reserves although the country’s National Food and Strategic Reserves Administration kept silence on the US’ request to disclose any details. The Biden administration is lobbying countries like China, India and Japan to consider releasing stockpiles in a coordinated effort to lower energy prices. My question is WHY>?:
The unusual request comes after OPEC+ on several occasions declined to meet Biden’s request to speed up production increases. Brent crude since yesterday fell from $82/barrel to just below $80/b. The latter serves as a technical neckline of a short term double top formation with targets near $74/b.
IMPACT on GOLD: OBVIOUSLY, YES!
Those who missed my analysis and past data records published by me earlier highlighting the co-relation between US Dollar Strength, Oil and GOLD as core factors.
GOLD
Gold price staged an impressive comeback on Wednesday and reversed 75% of Tuesday's sell-off, mainly helped by a sharp pullback in the US Treasury yields across the curve.
Discouraging US housing data also added to the greenback’s misery, as investors started to rethink the Fed’s rate hike expectations. The negative sentiment around Wall Street indices also helped the recovery in gold price.
This Thursday, gold price is holding onto the recent advance, biding time before initiating the next upswing. The weakness in the US dollar alongside the yields continues to underpin gold price. The risk-off trading in the Asian equities amid looming China’s property sector concerns and global inflation risks continue to boost’s gold appeal as a safe-haven as well as an inflation hedge.
The Fed speculation and inflation concerns will continue to play out, influencing the dynamics in the yields and gold price. Data-wise, the US weekly Jobless Claims will draw some attention amid a sparse docket and a slew of Fed speak.
Gold price is likely to trade in a familiar range between $1,845 and $1,866/1872 in the day, until the bulls find a strong foothold above the June 14 tops of $1,878 resulting in a rally to $1888/1907 price zone.
On the reversal side, a breach below 1832 can trigger the price to 1818/1777 zone once again.
BULL CROSS
The 100-Daily Moving Average (DMA) has pierced through the 200-DMA from below, representing a bull cross, adding credence to the bullish outlook on gold price.
YIELDS
Worries over the global economic recovery resurfaced, as investors fretted over the implications of earlier than previously thought monetary policy tightening to tackle the rearing inflation beast. The dour market mood ramped up the safe-haven flows into gold and the US Treasuries, weighing heavily on the yields.
Join TELEGRAM channel for latest updates and market analysis:
Copy this url and paste in browser: https://bit.ly/AnalysisbyPR

Piyush Lalsingh Ratnu
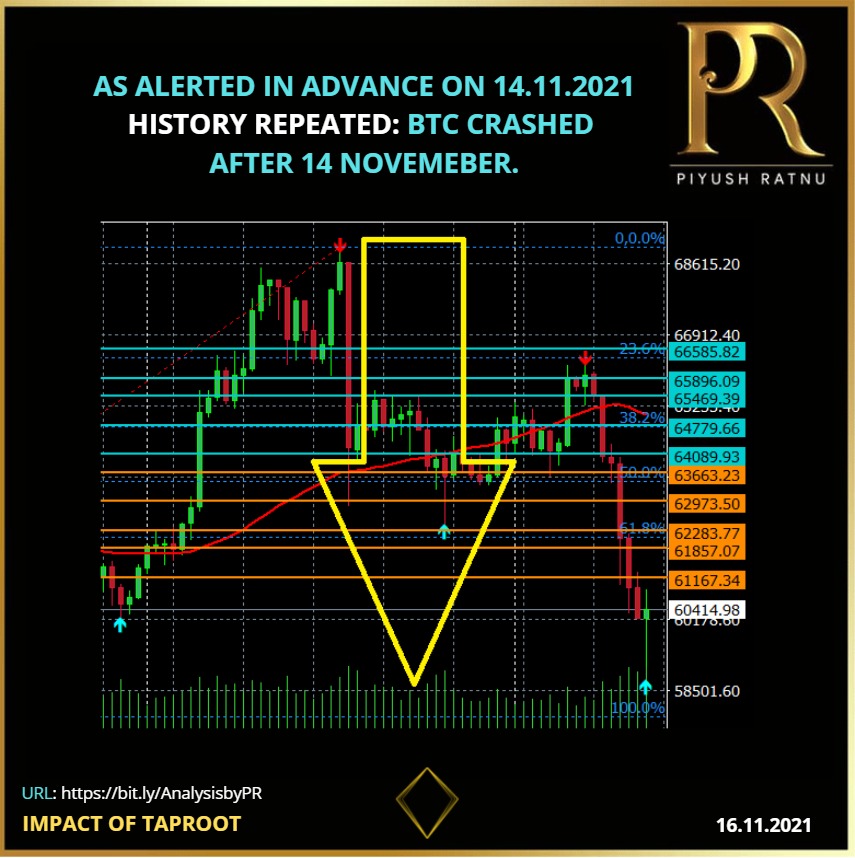
AS ALERTED IN ADVANCE ON 14.11.2021
HISTORY REPEATED: BTC CRASHED AFTER 14 NOVEMEBER.
Join TELEGRAM channel for latest updates and market analysis:
Copy this url and paste in browser: https://bit.ly/AnalysisbyPR
HISTORY REPEATED: BTC CRASHED AFTER 14 NOVEMEBER.
Join TELEGRAM channel for latest updates and market analysis:
Copy this url and paste in browser: https://bit.ly/AnalysisbyPR

Piyush Lalsingh Ratnu

Heavy volatility expected: 1888 zone ahead.
1866-1888 breach will result in 1907 which
right now might look impossible.
A reversal scenario: $1866-1845
Maintain price gaps.
Enter near SR zones only.
Avoid repeated trades. Implement Golden Ratio.
I will trade on small lots today as I am not sure about direction.
Once Gold enters a specific zone, only after that I will trade.
Avoid Gambling.
Safeguard Principle.
All the best! Join TELEGRAM channel for latest updates and market analysis: Copy this url and paste in browser: https://bit.ly/AnalysisbyPR

Piyush Lalsingh Ratnu

Join TELEGRAM channel for latest updates and market analysis:
Copy this url and paste in browser: https://bit.ly/AnalysisbyPR
Copy this url and paste in browser: https://bit.ly/AnalysisbyPR

Piyush Lalsingh Ratnu
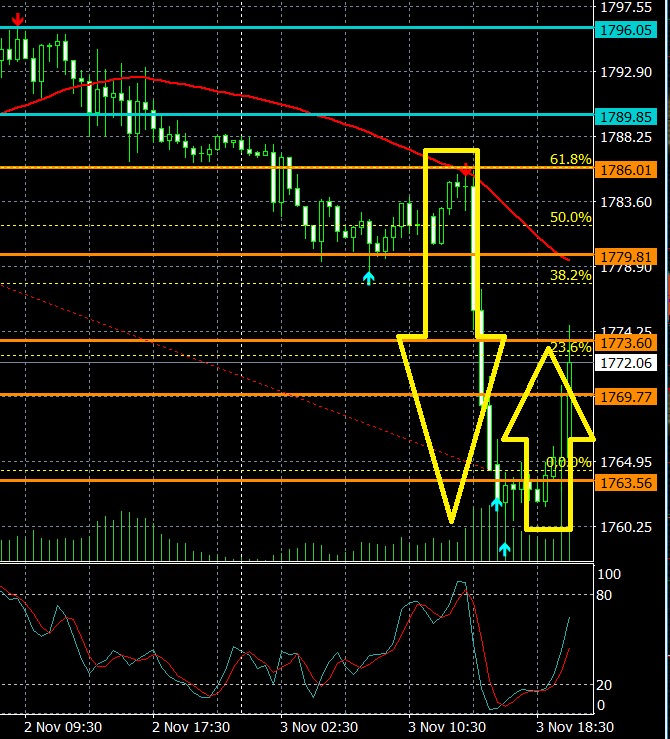
As published in Analysis.
Crash from 1796 to 1777 and 1758 achieved. RT achieved 23.6% on M30 chart | 38.2% on M15 | M15 SMA further | 50% RT achieved on M5.
Read my Analysis on GOLD published at 13.29 hours today:
https://bit.ly/Gold1818or1756
Crash from 1796 to 1777 and 1758 achieved. RT achieved 23.6% on M30 chart | 38.2% on M15 | M15 SMA further | 50% RT achieved on M5.
Read my Analysis on GOLD published at 13.29 hours today:
https://bit.ly/Gold1818or1756

Piyush Lalsingh Ratnu
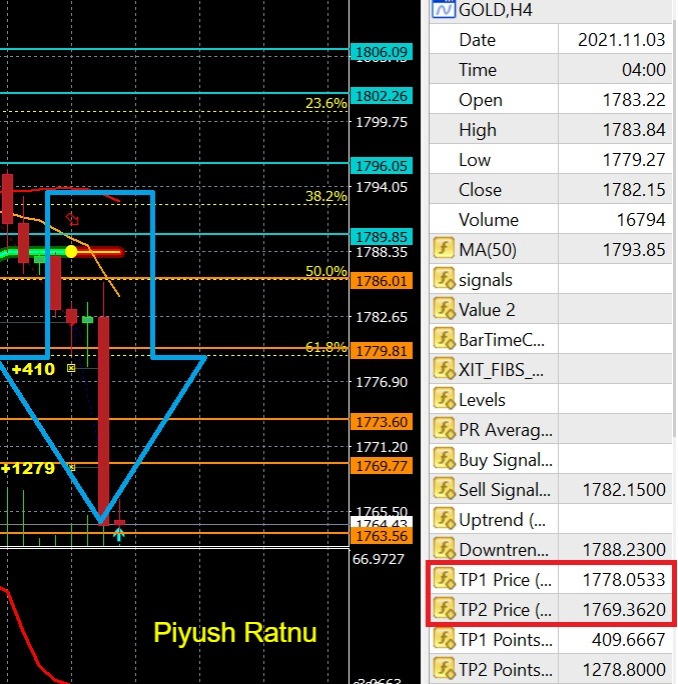
TARGET 1 and 2 achieved | GOLD | 03.11.2021 | Alert generated at 04.00 hours | Set: 323
Email at info@piyushratnu.com for more details, Analysis and LIVE Feed
CMP 1763
Email at info@piyushratnu.com for more details, Analysis and LIVE Feed
CMP 1763

Piyush Lalsingh Ratnu

Today Gold price achieved D1 SMA 50 (1778) after crashing from H4 SMA 50. 1756/1721 and 1808-1818/1832 levels are the next major Support and Resistance zone. Tapering related statements can push gold up or down $45-90. All three major equity indexes in the US hit new record highs on Tuesday, and GOLD once again made a failed attempt to achieve $1800 mark and crashed back from $1796 Resistance zone to $1778 Support zone today morning.
The FOMC meeting for November began yesterday and will conclude today. Most importantly, it will be the statement and following press conference by Chairman Powell that will draw the most attention. The statement will contain information about when the Federal Reserve will begin tapering their $120 billion monthly asset purchases. The press conference will clarify any ambiguities found within the statement itself.
It is highly believed that the Fed will announce the onset of tapering tomorrow. They have already defined that tapering will reduce asset purchases by $15 billion each month. The reduction will be composed of $10 billion of U.S. bonds and $5 billion of MBS. Since the Federal Reserve has been buying $80 billion each month of U.S. debt instruments, it will take a total of eight months to complete the tapering process.
That means that if they begin tapering in November, they will not complete the tapering process until June 2022. It is also important to note that they will not begin lift-off until they have completed tapering.
Worried foreign central banks boost gold reserves
After sitting on the side-lines for much of last year, central bank appetite for gold has resumed, in part due to inflationary pressures globally along with disruptions in the energy market.
Russia recently reached a milestone record for its gold reserves, now ranking fifth in the world for the size of its holdings. Russia now holds well over 20% of its reserves in gold! This represents nearly 2,300 tons of gold now held by the totalitarian nation, and that figure is likely to increase substantially in the years ahead.
Meanwhile, the central banks of Serbia, Hungary, Thailand, France, and Germany have added gold to their reserves in recent months. Brazil even bought 41.8 tons recently.
The heavy gold accumulation by central banks points to an ongoing shift away from the Federal Reserve Note “dollar” as the global reserve currency of choice and points to the ongoing shift in global economic dynamics.
The decline and fall of the U.S. dollar as a world reserve currency could mark a key turning point in financial history. Fiat currencies and the debt instruments denominated in them may fall in tandem. Investments in precious metals stand to rise.
Today is FED interest rate announcement and FOMC. In addition, this Friday NFP and Unemployment rate will be published, which brings another huge volatility in Gold price. This week is crucial and retail traders might lose their principle amount if they are stuck in wrong direction.
Analysing Relevant Data plays a crucial role in decision making during such highly volatile economic events:
Observe Resistance & Support zones
Observe Fibonacci Retracement zones
Observe Session shifts
Observe Dollar Index
Observe US10YT – US 10 Year Yield
Observe XAUXAG Ratio
Observe USDJPY price
Observe Yen strength
Observe US Dollar strength
Observe COT on Spot GOLD
Gold council report regarding Supply and Demand stats of Gold
Observe Chairman Powell’s statement
Observe US Monetary Policy
The next big day for the high volatility action in GOLD will be NFP Day:
NFP on 05 November, 2021
Participation rate on 05 November, 2021
Unemployment rate on 05 November, 2021
Resistance zone:
1789 | 1796 (1796 zone) | 1802 - 1806 (1808 zone) | 1812 (1818 zone)
Support zone:
1786 – 1779 - 1773 (1777 zone) | 1769 - 1763
As per past data:
Resistance zone:
1808/1818/1832/1866/1888
Support zone:
1777/1735/1717/1685
SOC Parameters:
H1 Over Sold
H4 Over Sold
D1 at 45.0
RISE above 1796: 23.6% FIB level + H4 SMA zone + Resistance 2: a strong zone of retracement before the further rise to 1808-1818 price levels.
CRASH till 1750: 1763 Last support level + 61.8% at 1756: a strong zone of retracement before the further crash to 1721 – 1717 price levels.
SMA 50 Levels:
M30: $ 1787.00
H1: $ 1788.78
H4: $1793.65
D1: $ 1780.45
All the above data needs to be observed carefully to derive co-relation and trace the further movement of Gold in this and next week. The first and second week in November has always proved itself as a choppy week. Last year too due to elections, Gold crashed in first and second week more than $100.
This week is unique in it’s own way since FED interest rate day, FOMC and NFP – all three economic events of utmost importance are scheduled this week. The only certainty about today's FOMC conclusion is that we will see increased volatility as market participants attempt to read between the lines of the Federal Reserve statement and chairman Powell's press conference.
I wish you ALL THE BEST for today!
WARNING: Information on these pages contains forward-looking statements that involve risks and uncertainties. Markets and instruments profiled on this page are for informational purposes only and should not in any way come across as a recommendation to buy or sell in these assets. You should do your own thorough research before making any investment decisions. Piyush Ratnu does not in any way guarantee that this information is free from mistakes, errors, or material misstatements. It also does not guarantee that this information is of a timely nature. Investing in Open Markets involves a great deal of risk, including the loss of all or a portion of your investment, as well as emotional distress. All risks, losses and costs associated with investing, including total loss of principal, are your responsibility. The author will not be held responsible for information that is found at the end of links posted on this page. The author do not provide personalized recommendations. The author makes no representations as to the accuracy, completeness, or suitability of this information. The author will not be liable for any errors, omissions or any losses, injuries or damages arising from this information and its display or use. The author is not a registered investment advisor and nothing in this article is intended to be investment advice.

Piyush Lalsingh Ratnu
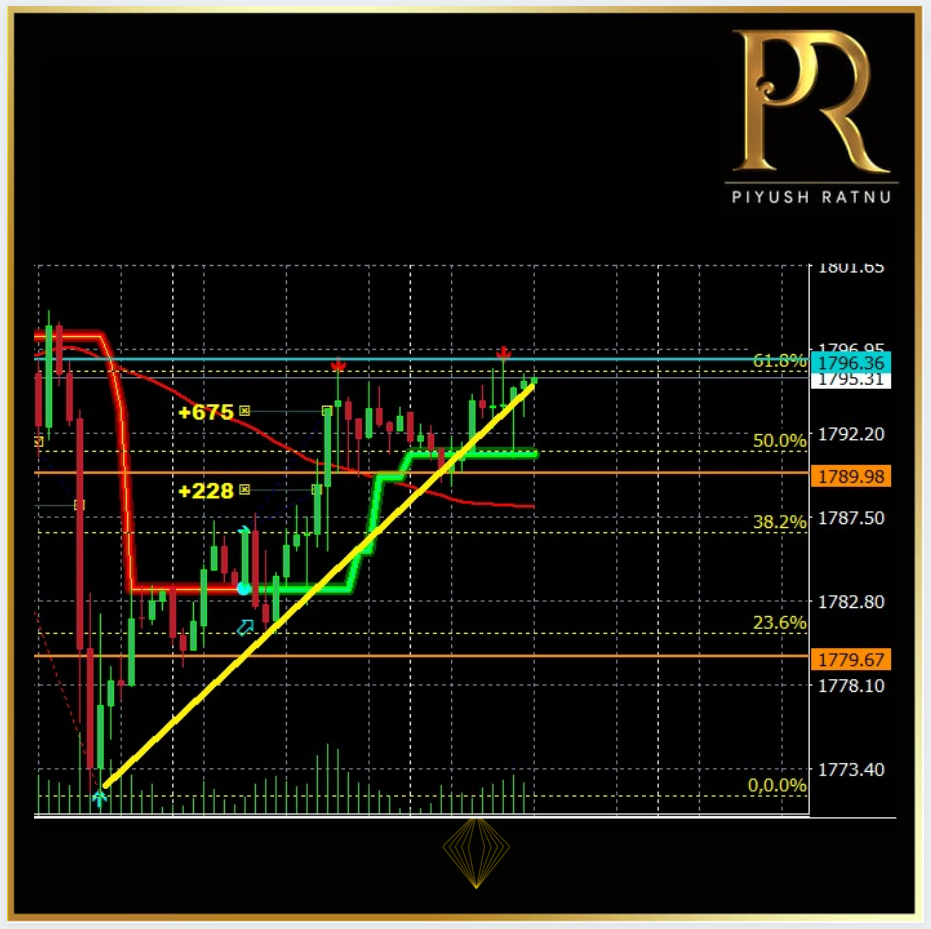
02.11.2021
GOLD back to 1796 R zone. after struggling at 1777 S zone.
Subscribe to our LIVE analysis, trading feed and trading tools for better accuracy.
Email at info@piyushratnu.com for more details.
GOLD back to 1796 R zone. after struggling at 1777 S zone.
Subscribe to our LIVE analysis, trading feed and trading tools for better accuracy.
Email at info@piyushratnu.com for more details.

Piyush Lalsingh Ratnu
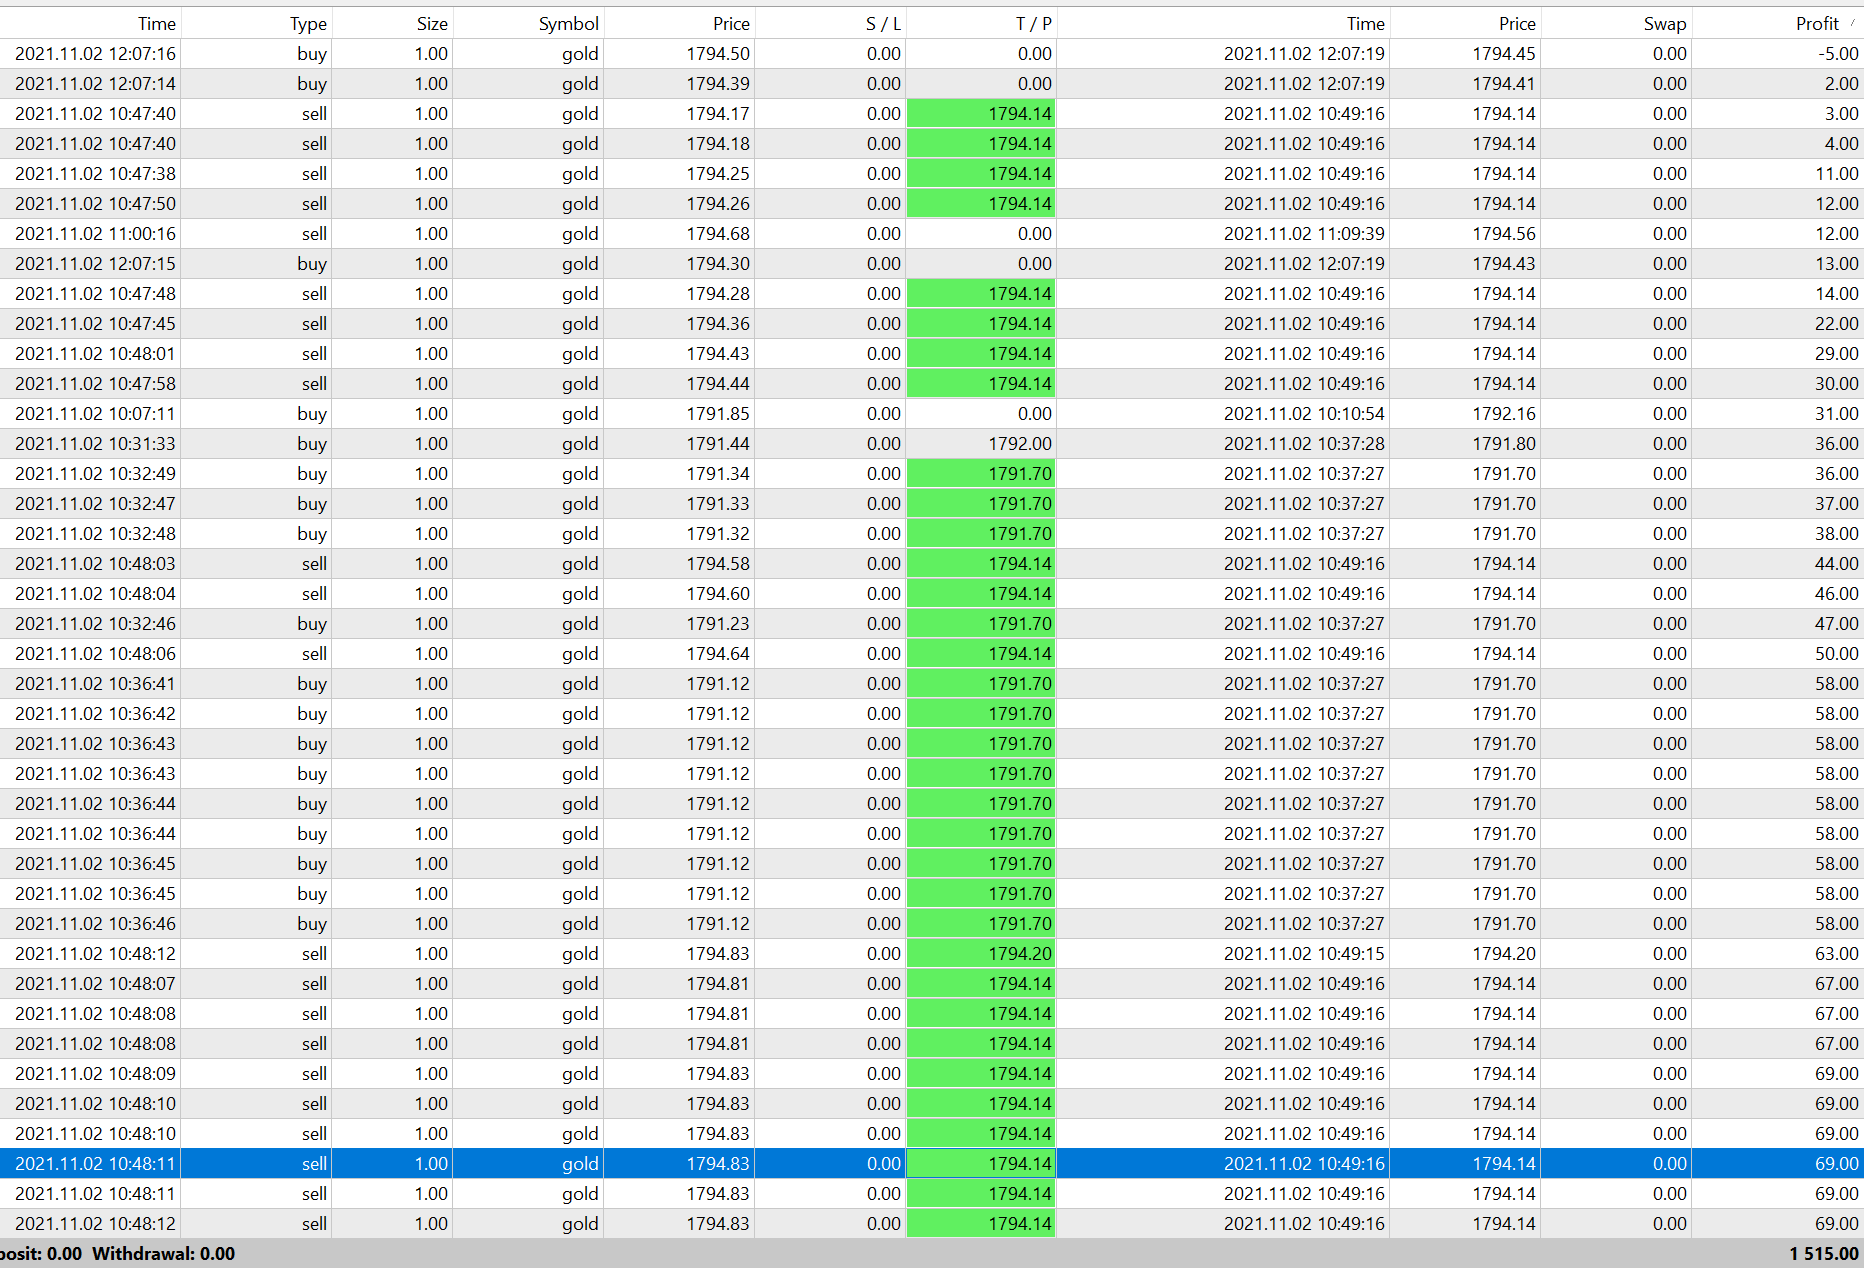
HIGH Frequency Trading | 1.0 lot each | Speed: 2 trades per second | Trading Accuracy: 90%
#PiyushRatnu | XAUUSD | GOLD | Analysis | Dubai | Email for live feed at info@piyushratnu.com
#PiyushRatnu | XAUUSD | GOLD | Analysis | Dubai | Email for live feed at info@piyushratnu.com

Piyush Lalsingh Ratnu

Trading accuracy: 90% achieved | 11.40 AM
GOLD EURUSD EURCAD
#PiyushRatnu #Forex #Bullion #Gold #Analysis
GOLD EURUSD EURCAD
#PiyushRatnu #Forex #Bullion #Gold #Analysis

Piyush Lalsingh Ratnu
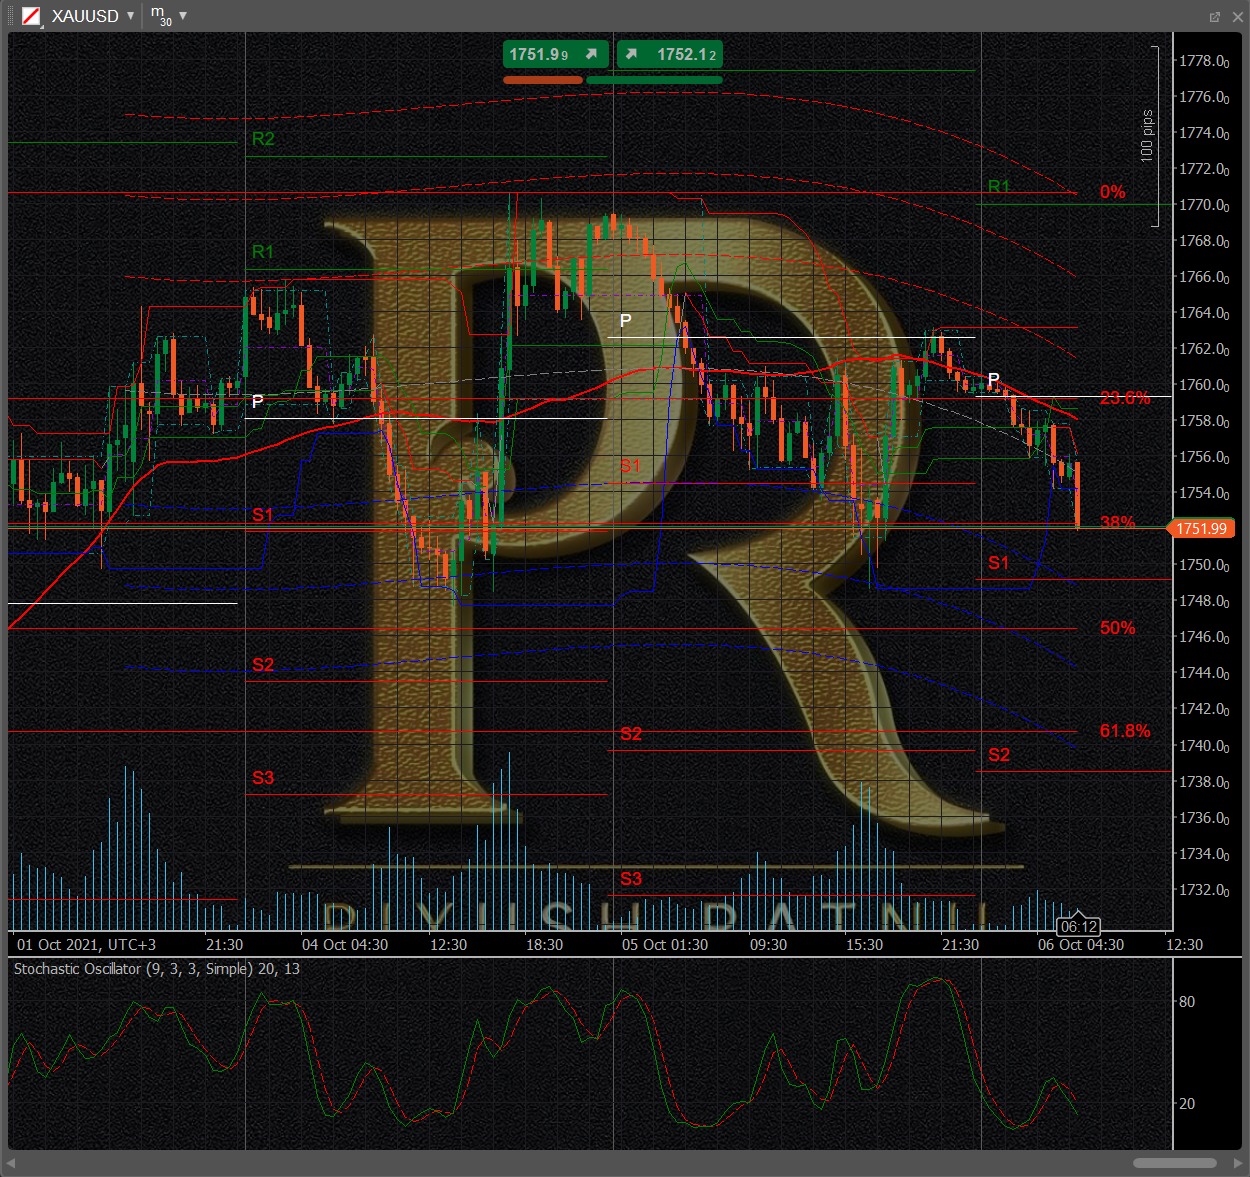
I will be waiting for GOLD price to crash the support LEVELS, I see a good BUYING opportunity after the crash, ADP, Initial Jobless Claims and NFP data will add high volatility, and a sudden crash of $25/50/75 is what I am expecting, with 23.6/38.2 recovery by Tuesday. However I never believe in holding my trades on Friday late eve, hence I will exit in Net Average Profit Price (NAP) as per the lows achieved by GOLD after this data release. If GOLD prices rise, against my expectation I will wait for the Resistance Levels: 1777/1796/1808-1818 before taking major SELL entries. As they say, no one is perfect, market can go against our analysis, however a real trader is the one who is ready for the worst while saving principle amount, always.

Piyush Lalsingh Ratnu

Gold and silver prices are down in midday U.S. trading Tuesday, amid solid rebounds in the U.S. stock indexes after they saw selling pressure Monday. A firmer U.S. dollar index and rising U.S. Treasury yields today are also negatives for the metals markets. December gold futures were last down $8.60 at $1,759.00. December Comex silver was last down $0.059 at $22.585 an ounce.
Despite today's gains in the U.S. stock indexes, there are still some risk-off attitudes in the marketplace. Another Chinese property firm, Fantasia Group Holdings, missed a debt payment this week. Fantasia is not as big as the troubled Evergrande property firm, but there are growing concerns about a contagion effect in the financial markets. There are lingering worries about supply-chain bottlenecks that have many businesses unable to obtain their products in a timely fashion. That matter and rapidly rising energy prices have helped to stoke price inflation fears and even notions of a return of "stagflation" that gripped world economies in the early 1980s. These elements are likely to at least limit the downside in safe-haven gold and silver in the near term.
The key outside markets today see the U.S. dollar index modestly up and not far below last week's 12-month high. Nymex crude oil futures are up and hit a nearly seven-year high of $79.48 a barrel today. Meantime, the 10-year U.S. Treasury note yield is presently fetching 1.524%.
Technically, December gold futures bears have the overall near-term technical advantage. A four-week-old price downtrend is in place on the daily bar chart. Bulls' next upside price objective is to produce a close above solid resistance at $1,800.00. Bears' next near-term downside price objective is pushing futures prices below solid technical support at $1,700.00. First resistance is seen at this week's high of $1,771.50 and then at $1,775.00. First support is seen at this week's low of $1,747.70 and then at $1,737.50.

Piyush Lalsingh Ratnu
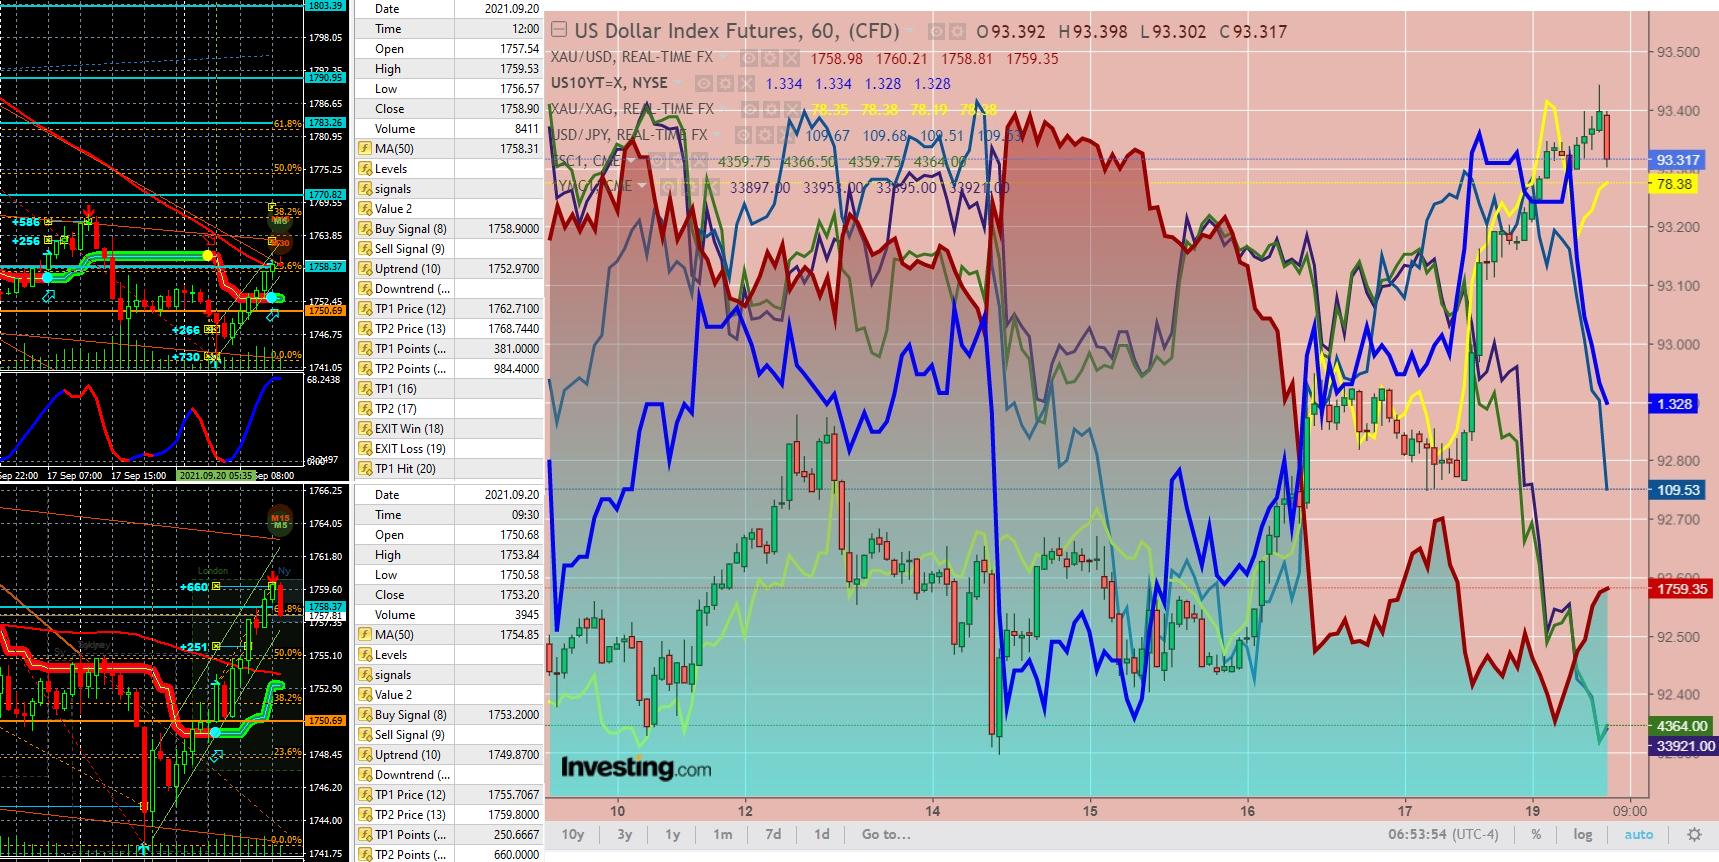
Stocks set to open lower, streamers vs legacy channels in focus after Emmys
U.S. stocks are set to open sharply lower later, as Chinese and central bank risks prompt investors to take money off the table after a strong year-to-date.
By 6:15 AM ET (1015 GMT), Dow Jones futures were down 547 points, or 1.6%, while S&P 500 futures were down 1.4% and Nasdaq 100 futures were down 1.0%.
Additional risks lurking include the suspension of federal government agencies due to the ongoing dispute over the debt ceiling, although analysts note that this argument remains – as usual – largely in the realm of political theater.
Stocks likely to be in focus later include Netflix (NASDAQ:NFLX), AT&T (NYSE:T) and Disney, after the first of those three trounced the other two at this year’s Emmy Awards.

Piyush Lalsingh Ratnu
After AUGUST,
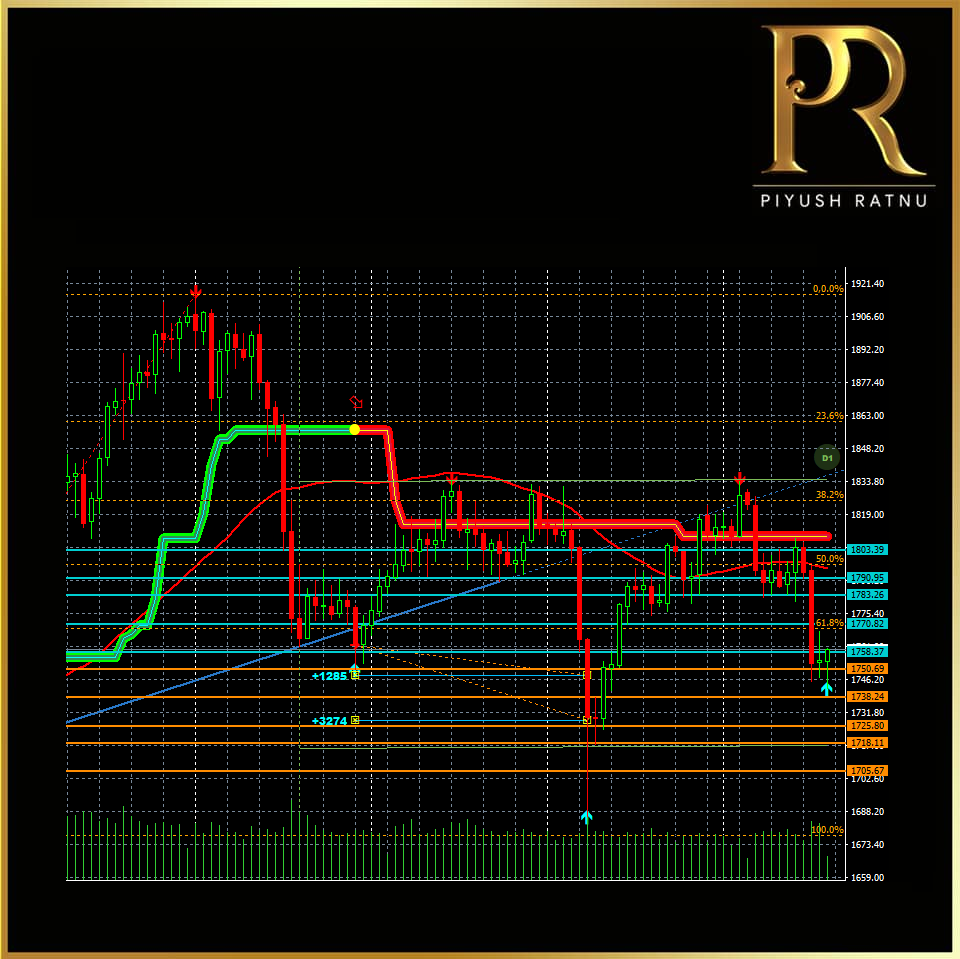
September is the cruelest month, and it's playing out that way once again, with rolling corrections all over the place, something that is, again, typically a precursor to the seasonal decline that begins in just a couple of days.
STAY ALERT.
The Federal Reserve is likely to announce its tapering plans, starting by the end of this year, at its September 21-22 monetary policy meeting. The Bank of England may also hint at tapering, given the rising inflation in the UK. A potential withdrawal in the monetary policy stimulus will continue to bode ill for gold.
A failure to defend the monthly lows of $1742, a fresh leg down could initiate towards the $1700 psychological magnate. Alternatively, the pattern support now resistance at $1753 could challenge gold’s road to recovery.
After Thursday’s $50 slide, gold price looked to stabilize on Friday, although held on to multi-week lows near $1750. Sellers took a breather after the previous decline, which was mainly seen as a chart-based sell-off after gold price failed to resist above the $1800 barrier. The slide also ensued after the US Retail Sales surprised to the upside in August, showing signs of strengthening economy and reinforced Fed’s tapering bets. On Friday, gold price attempted a bounce but lacked conviction amid a broadly firmer US dollar. The troubled Chinese property developer giant Evergrande’s potential default story dented the investors’ sentiment and lifted the dollar’s safe-haven appeal while rising Treasury yields on tapering bets also aided the greenback, limiting gold’s upside attempts.
Heading into a big week, with the Bank of England and the Fed central bank meetings in focus, gold price resumes last week’s downtrend and refreshes monthly lows near $1740 amid Fed’s tapering speculations and as risks surrounding Evergrande build up. The US dollar index holds at monthly tops, as the Fed is likely to announce its tapering plans, starting by the end of this year, at its September 21-22 monetary policy meeting. The BOE may also hint at tapering, given the rising inflation in the UK. A potential withdrawal in the monetary policy stimulus will continue to bode ill for gold price. Later in the day, the dynamics in the US dollar and the broader market sentiment will continue to have a significant bearing on gold trades, as the economic calendar appears scarce.
As observed on the four-hour chart, gold price has confirmed a bear pennant pattern, considering the recent consolidation that followed the previous week’s slide.
Gold price closed the four-hourly candlestick below the rising trendline support at $1752, charting out the bearish continuation formation.
The death cross validated on the same time frame on Friday, adds credence to the potential downside.
The Relative Strength Index (RSI) is holding in the oversold territory, suggesting a bounce could be in the offing. However, given the bearish technical setup, any recovery attempt could be seen as a good selling opportunity.
A failure to defend the monthly lows of $1742, a fresh leg down could initiate towards the $1700 psychological magnate.
Alternatively, the pattern support now resistance at $1753 could challenge gold’s road to recovery.
Further up, the pattern resistance at $1759 could be the next relevant upside target. A sustained move above the latter could expose the bearish 21-Simple Moving Average (SMA) at $1771 (1777 zone).
All in all, the path of least resistance for the gold price appears to the downside.
The question remains the same:
CRASHING GOLD: A Buying Opportunity or One should wait till this Year's NEW low?

Piyush Lalsingh Ratnu

Evergrande collapse could have a ‘domino effect’ on China’s property sector
A spillover of the crisis at China Evergrande Group into other parts of the economy could become a systemic problem, a sizable number of developers in the offshore dollar market appear to be “highly distressed” and may not survive much longer if the refinancing channel remains shut for a prolonged period.
China’s “highly distressed” real estate companies are at risk of collapse as the country’s highly indebted developer Evergrande is on the brink of default. Evergrande, the world’s most indebted property developer, is crumbling under the weight of more than $300 billion of debt and warned more than once it could default. Banks have reportedly declined to extend new loans to buyers of uncompleted Evergrande residential projects, while ratings agencies have repeatedly downgraded the firm, citing its liquidity crunch.
The financial position of the other Chinese property developers also took a hit following rules outlined by the Chinese government to rein in borrowing costs of the real estate firms. The measures included placing a cap on debt in relation to a company’s cash flows, assets and capital levels.
Evergrande bosses face ‘severe punishment’ after securing early redemptions
Six senior Evergrande executives face “severe punishment” for securing early redemptions on investment products that the indebted Chinese property group subsequently told retail investors it could not repay on time, the company has said.
The admission comes ahead of a critical fortnight for the developer, which is struggling to repay investors, banks and bondholders, as well as complete flats for homebuyers who paid for their new properties in advance.
Hong Kong-listed shares in Evergrande fell as much as 18.9 per cent on Monday, while broader concerns about the health of China’s real estate sector triggered a wider sell-off.
Last week hundreds of retail investors protested at Evergrande’s headquarters in the southern city of Shenzhen, after executives said they needed more time to pay the interest and principal on high-yielding wealth management products issued by the group. They were joined by suppliers who said they had also not been paid.
Du Liang, a senior company executive, told investors that Evergrande had used at least Rmb40bn ($6.2bn) from wealth management sales to fund construction projects across the country, according to people who participated in settlement negotiations. In addition to the money Evergrande has borrowed from 80,000 retail investors, the group owes other creditors and suppliers an estimated $300bn.
In a statement at the weekend, Evergrande said that as of May 1 more than 40 group executives had purchased its investment products. Six of them, who had secured early redemptions of their investments, will return the money.
“All funds redeemed by the managers must be returned and severe penalties will be imposed,” said the company, which has also offered to repay investors with discounted flats and parking lots.
It is common for the owners and employees of heavily indebted Chinese companies to buy such products to help fund operations. Ding Yumei, wife of Evergrande founder and chair Hui Ka Yan, paid Rmb20m for group investment products in July.
Evergrande’s attempts to calm investor anger highlight the many challenges its debt crisis poses for the Chinese government, which is reluctant to bail out the company even though its collapse could have wide-ranging consequences.
Some Evergrande bonds have recently traded as low as 20 cents on the dollar, while yields on other Chinese property groups’ debt have risen sharply.
The value of Evergrande’s Hong Kong-traded shares have fallen almost 90 per cent over the past year.
The Chinese government recently organised a bailout of Huarong, a heavily indebted state-owned asset manager, by other government-controlled asset managers and banks. But it is reluctant to do the same for a large private-sector company such as Evergrande.
IMPACT: STRONGER DOLLAR. Volatility in GOLD | Panic based SELLING in Equities

Piyush Lalsingh Ratnu
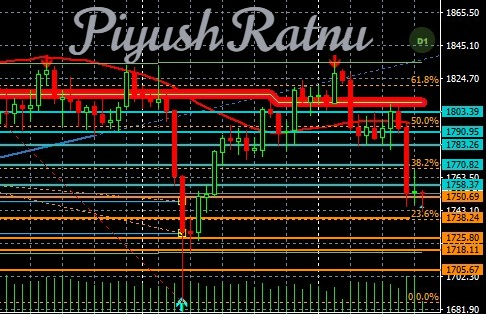
*CRASHING GOLD: A Buying Opportunity or One should wait till this Year's NEW low?*
So much money printed. Excessive debt. Even pandemic! And gold failed to hold gains. But that’s how markets work, no matter what gold permabulls say. Lots of money has been already printed, and the world has been suffering from the pandemic for well over a year. Gold should be soaring in this environment! Silver should be soaring! Gold stocks should be soaring too!
This is what happened in the previous 3 cases after the retail sales report:
• gold declined after retail sales disappointed in June
• gold topped after retail sales outperformed in July
• gold paused its rally after retail sales disappointed in August
• gold declined after retail sales outperformed in September
Gold failed to hold its gains above its 2011 highs. Can you imagine that? So much money printed. Excessive debts. Even pandemic! And gold still failed to hold gains above its 2011 highs. If this doesn’t make you question the validity of the bullish narrative in the medium term in the precious metals sector, consider this:
Silver – with an even better fundamental situation than gold – wasn’t even close to its 2011 highs (~50). The closest it got to this level was a brief rally above $30. And now, after even more money was printed, silver is in its low 20s.
And gold stocks? Gold stocks are not above their 2011 highs, they were not even close. They were not above their 2008 highs either. In fact, the HUI Index – the flagship proxy for gold stocks – is trading below its 2003 high! And that’s in nominal prices. In real prices, it’s even lower. Just imagine how weak the precious metals sector is if the part of the sector that is supposed to rally first (that’s what we usually see at the beginning of major rallies) is underperforming in such a ridiculous manner. And that’s just the beginning of the decline in the mining stocks.
*More to Come!*
*Stay Alert | Do not pile up positions. Maintain price gap, implement intraday trades. Exit trades in net profit, do not hold trades. A Major market correction $100-130 expected before 10 October, 2021 or between 09-19 November, 2021.*
Disclaimer: Please note that the aim of the above analysis is to discuss the likely long-term impact of the featured phenomenon on the price of gold and this analysis does not indicate (nor does it aim to do so) whether gold is likely to move higher or lower in the short- or medium term. In order to determine the latter, many additional factors need to be considered (i.e. sentiment, chart patterns, cycles, indicators, ratios, self-similar patterns and more) and we are taking them into account (and discussing the short- and medium-term outlook) in our analysis. Invest only as much as you can afford to recover in case of losses.

Piyush Lalsingh Ratnu
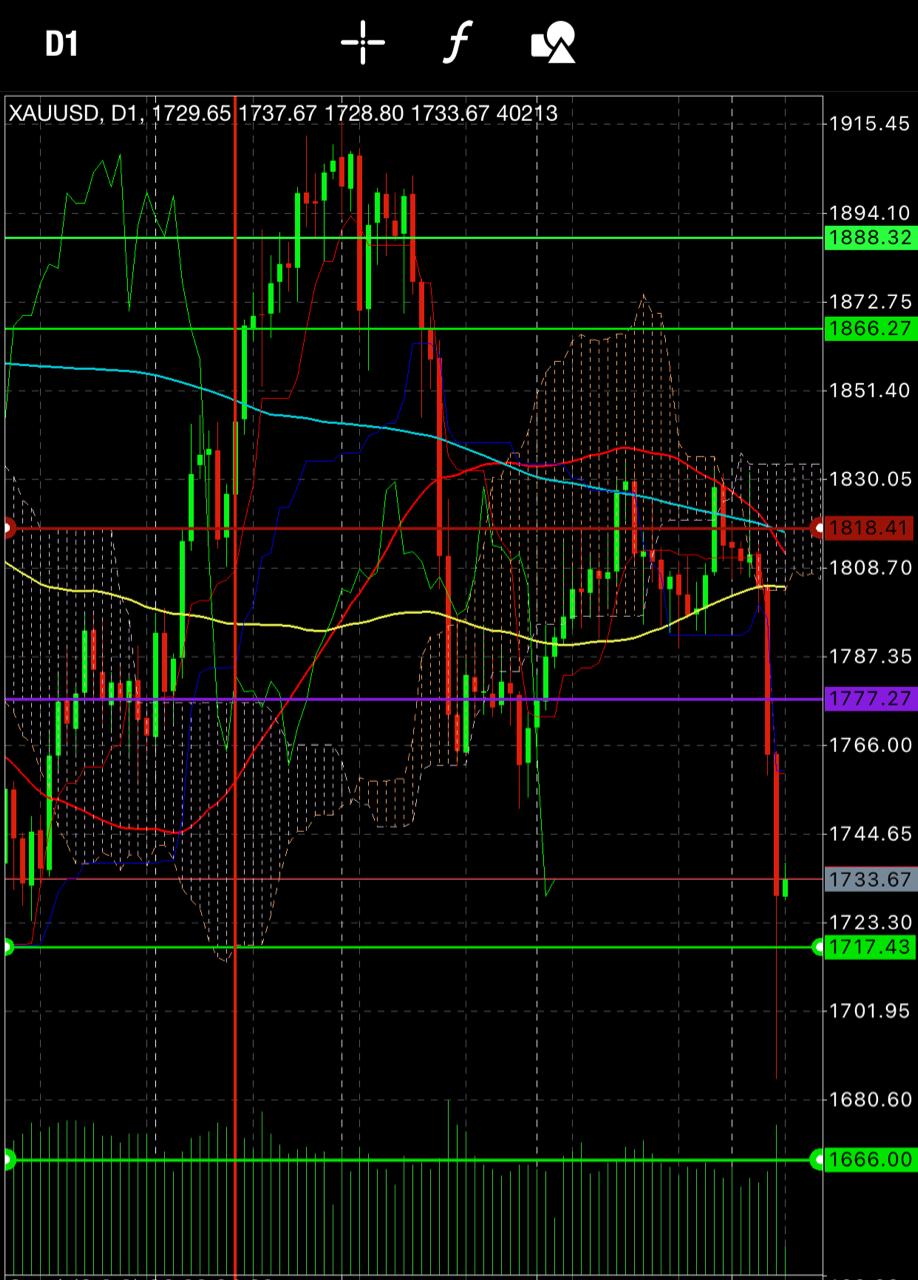
1818 sell zone
1717 buy zone
As indicated repeatedly since 12 Aug 2020.
Gold re created history by crashing on 09.08.2021, last year Gold crashed $150+ on 08.08.2020.
Market cycles play a crucial role in price movements in addition to fundamentals and technicals.
Fundamentals make technicals, technicals never make fundamentals, however by observing technicals you can trace the possibility of a planted fundamental to prove or justify the so called market correction or price consolidation. In such cases price range play a major role for a trader to enter in right direction at right price range and right time.
2020
1966
1947
1926
1907
1888
1866
1818
1777
1717
1666(1685 year low)
The above numbers were highlighted by me since 12 Aug 2020, these numbers are acting as tough resistance and support levels, and the same was proved once again on 09.08.2021 when Gold was in crash mode since ADP data published on 04.08.2021: 1832.
The price crash was observed from 1832 to 1684 (on some
Platforms lowest price was observed as 1650/1630 price zone), some brokers tried to capitalise the crash to achieve higher revenue in B Booking and stop loss hunting.
I feel 70% of accounts were not ready to hold the losses at a price range of 1680, because general and generic sentiment on NFP is a price movement or $15/20, at 1810 traders expected a crash till 1790/1785 zone. However on NFP data Gold crashed till 1757 zone in four hours on Friday, and on Monday Gold crashed more 80 dollars and proved once again that Gold is the King of volatility by achieving this year’s low 1685 and recovering back 50% in next 12 hours.
Concluding the data:
Those who trade Gold, always be ready for a price movement of 5000/10000/25000 pips in a week, only then you can survive such market cycles based price movements and crashes.
Always believe in safeguarding your principle rather than risking the same to make some temporary profits.
We will resume trading from 18 Aug 2021 as announced earlier too.
As alerted at 16.08 hours
Before NFP
I suggested BUY entries from 1777, price gap of 15 and further gap of 5.3.2 dollars.
1762 was the ultimate target of Gold crossed 1790, and the low for Friday was 1757.
We entered from 1781 with price gaps in RM and GR and closed all trades in net average at 1763.90 after gold recovered from 1757 zone till 1766.
On NFP day
After NFP data
At 20.35 hours
I alerted in advance the next price target can be 1736/1717/1666
Reason:
Senate meeting
Infra Bill optimism
Stimulus spending
Monetary policy discussion
Tapering optimism
Dollar strength
COVID fears
Strong NFP data
Interest rate related discussion
Rising yields
Rising stocks and indices
On Monday 09.08.2021
Gold opened at 1757 and crashed till 1684 price in three hours, and recovered back till 1728 price zone.
Yes Gold crashed only till 1685
However a rally below 1666 would have opened the gates to 1600 and 1555 price levels.
So, keeping safety first, we entered SR 1717 and made an exit at 1723/1726 SR zone.
Accuracy proven once again.
Those who believe in my analysis, am sure made handsome profits.
And those who chose not to keep price gaps, am sure lost their entire principle.
Money Management
Risk Management
Is the key to success in Trading.
0.01 is my first step
Always!
Wish you luck,
See you all next week on the new set of trading.
Will be trading more from 18 Aug 2021 as I believe more market correction till 18 Aug, followed by Jackson Hole meeting.
Another movement of $45/80 is expected.
Stay Alert!

Piyush Lalsingh Ratnu

Gold Analysis: 28 July, 2021: FED INTEREST RATE DAY.
ECB is unlikely to raise the interest rates until at least 2023
ECB’s dovish shift is bad news for the yellow metal
:: ultra-low interest rates for even longer
:: asset purchases under the Pandemic Emergency Purchase Programme at the current (faster than it was originated) pace over the third quarter of 2021
::No bazookas
*Impact: *
DOLLAR appreciated relative to the euro after the ECB’s monetary policy meeting.
Result: GOLD crashed.
Current price zone: 1796-1818
The Fed looks hawkish in comparison to the ECB
*FOCUS: *
:: tapering and monetary policy, and it’s normalization
:: the timing of tapering amid surging inflation in the US
:: the divergence in monetary policy and interest rates
:: the Fed is expected to hint at a likely taper starting off from the final quarter of this year.
OIL Co-relation:
Oil prices continue to recoup previous losses as traders bet on tightening supply. It’s swift recovery above 71.10 is an encouraging sign that buyers are still hanging around. Following the breakout, 70.10 has established itself as fresh support.
YIELDS
**On Tuesday, the US dollar has given back more ground as real US bond yields hit all-time lows, supporting the yellow metal.
Todays, The dollar fell, despite a generalized dismal mood. Global stocks edged lower, while demand for government bonds increased, pushing yields lower.
**The yield on 10-year Treasury inflation-protected securities (TIPS) hit an all-time low -1.147% before rebounding to -1.116%.
**Traders are buying DOLLAR (repetition of Last JULY format) due to COVID concerns, soaring cases, restrictions and seriousness of B.1.617.2.
**10-year breakeven inflation rates rose to 2.40% and nominal yields fell to 1.25%. Nominal yields suggest bond markets are getting increasingly concerned about the potential deflationary impact of the delta variant, but inflation break evens suggest greater concern about the current inflation outlook.
**US infrastructure bill added volatility and optimism in market, recently.
**To hedge the potential economic fallout from the spread of the highly contagious Delta variant
**China's regulatory crackdown is impacting equities & stocks
**The risk-off impulse in the markets depicts a generally negative tone around the equity markets, supporting GOLD.
**Surging covid cases in Asia is supporting DOLLAR.
GOLD: Current Status:
Monetary Policy Related Scenarios:
Gold would be expected to gain on a less hawkish and more cautionary tone, pushing the US dollar down of its carry trade advantage over cross currencies.
Tapering could be mentioned in the official statement, which would be a very hawkish surprise and would be expected to support the US dollar. The US dollar smile theory could also come into play given the global spread of the delta variant. If the Fed sounds the alarm bells too aggressively, this will favour the dollar and cap any bullish advances in gold for now.
CONSOLIDATION:
The current consolidation is a sign of indecision ahead of a catalyst-driven breakout. 1823 is a major hurdle and its breach would heighten momentum and resume the stalled rally till 1855-1866 (resistance zone).
SCK:
H1 H4 D1 GOLD is currently in OVERSOLD area
Past 15 days Oscillation: 1790-1818 price zone.
SMA & FIB:
D SMA5 Stands at 1827 (1818-1823 zone) indicating a tough resistance at 1823, suggesting SELLS above 1818 price level till 38.2% with price gap of $5 between each trade set to exit in NET AVERAGE PROFIT in the same set.
SMA SUMMARY
Daily SMA20 1800.64
Daily SMA50 1833.41
Daily SMA100 1797.04
Daily SMA200 1822.82
S/R Levels
LEVELS
Previous Daily High 1811.55
Previous Daily Low 1796.42
Previous Weekly High 1825.04
Previous Weekly Low 1789.8
Previous Monthly High 1916.62
Previous Monthly Low 1750.77
Daily Fibonacci 38.2% 1802.2
Daily Fibonacci 61.8% 1805.77
Daily Pivot Point S1 1792.2
Daily Pivot Point S2 1786.75
Daily Pivot Point S3 1777.07
Daily Pivot Point R1 1807.33
Daily Pivot Point R2 1817.01
Daily Pivot Point R3 1822.46
Summary:
APPLY: RM 5 steps | GP 6 steps | Gaps: $3 after 15 minutes or $25 movement and exit at FIB 23.6 and 38.2% in M5, M15 as, trend based price movement might be observed during Japanese Session followed by consolidation in London Session.
In any case the 30% retracement, will be observed in rise or crash: both the scenarios within 24 hours of price movement, on a longer term FIB RT 50% can be the target price as per H1, to book profits in a time frame of 12-18 trading days.
SELL above 1827: and exit in NAP
1830
1836
1842
BUY below 1777: and exit in NAP.
1770
1765
1760
1755
1750
Do not risk more than 3% of Principle, inorder to recover the trades in case of a high volatility crash or rise. I suggest to take positions at 15 minutes after the interest rate decision and 30 minutes after the conference.

: