Guarda i video tutorial del Market su YouTube
Come acquistare un Robot di Trading o un indicatore
Esegui il tuo EA
hosting virtuale
hosting virtuale
Prova un indicatore/robot di trading prima di acquistarlo
Vuoi guadagnare nel Market?
Come presentare un prodotto per venderlo con successo
Expert Advisors e Indicatori per MetaTrader 5 - 113

The purpose of this service is to warn you when the percentage of the margin level exceeds either a threshold up or down. Notification is done by email and/or message on mobile in the metatrader app. The frequency of notifications is either at regular time intervals or by step of variation of the margin. The parameters are: - Smartphone (true or false): if true, enables mobile notifications. The default value is false. The terminal options must be configured accordingly. - email (true or false)
The Red Devil Shorter is a fully automatic short setup based on EMAs and SMAs. Attention: Only 9 of 10 copies left at the price of $250, after that the price goes up to $499 Signal: https://www.mql5.com/de/signals/1826330 We use this great EA exclusively for the EUR/CHF pair, as we developed it specifically for that. The idea behind the setup is the weakness the EUR/CHF shows in the default time. The trades are mainly closed by counter signals or the set time. In rare cases, trades are closed

My Pivot Pro is the Pro Version of the Indicator " My PIVOT " ( Link: https://www.mql5.com/en/market/product/90336 ) This indicator will help you a lot to decide the Market Range and Movement. This Indicator is based on Pivot Lines and Support-Resistance zones. Now we can Plot Standard/Classic; Fibonacci; Demark; Camarilla nd Woodies Pivot Levels as per our requirements.
Steps to Setup the Indicator: Install the Custom Indicator; Set the Pivot Type; Period and Time ( We recommend to use

Equal Highs and Lows Indicator
Find and Mark Equal Highs and Lows on chart of Selected Multi Time frames. Options:
set min and max bars between Equal High's / Low's bars set max points difference between High's / Low's ( Sensitivity )
Select time frames by buttons on chart Select / Filter only High's or Low's by a button Extend Equal High's / Low's line forward for chart reference
Manual
MT4 version
MT5 version
Other Indicators

Gold Reaper Scalper.
This is a simple indicator that will help you in scalping gold. It will eliminate the waiting for a setup which will give you more time to do other things. This indicator works best on 5 minute and 15 minute charts. Arrows will appear indicating direction of price. Use proper risk management when entering and exiting trades. Works best on GOLD.

Identify Pinbar Candle Pattern with Arrows & Alert (built-in RSI filter).
This indicator helps you to identify Pin bar Candlestick Pattern (or shooting star & hammer pattern) on the chart with arrows, along with an alert when a new Pin bar appears. Pin bar pattern is one of the most important reversal Price Action signals.
You can set Minimum Percent of Wick (or Tail) Length over full bar length (Recommended: 60%, 70%, 75%).
Alerts can be turned on and off: Popup Email Push Notification S

GBP Portfolio EA is a Fully Automated Trading System that works on any session and trade only one pair (GBPUSD) Оnly 10 Copies available at $87! Next Price --> $199 The EA Does NOT use Grid or Martingale . Default Settings for GBPUSD H1 Only The EA has 56 Strategies with different parameters. It will automatically enter trades, take profit and stop loss using reverse signal modes. If a trade is in profit it will trail it until a reverse signal is detected. The EA works on GBPUSD on H1

This is a derivative of John Carter's "TTM Squeeze" volatility indicator, as discussed in his book "Mastering the Trade" (chapter 11).
Black crosses on the midline show that the market just entered a squeeze ( Bollinger Bands are with in Keltner Channel). This signifies low volatility , market preparing itself for an explosive move (up or down). Gray crosses signify "Squeeze release".
Mr.Carter suggests waiting till the first gray after a black cross, and taking a position in

Questo segnale DYJ è UN sistema di trading completo basato sulle specifiche tecniche ATR. Tali metriche registrano lo stato corrente di ogni tendenza di forza in ogni coppia di periodi di tempo e valuta analizzata. Il segnale di alimentazione DYJ valuta questi dati per creare in modo professionale una visualizzazione Dell' intensità della tendenza e UN elenco dei segnali del punto di ingresso. Se una delle due coppie corrisponde esattamente a tale condizione, viene visualizzato UN avviso. I dat

Identify Engulfing candle pattern with Arrows & Alert ( built-in RSI filter). This indicator helps you to identify Engulfing candle pattern or Outside bar (OB) on the chart with arrows, along with an alert when a new Engulfing candle appears. Engulfing candle pattern is one of the most important reversal Price Action signals. You can choose between standard Engulfing (Engulfing based on candle body) or non standard Engulfing (Engulfing based on candle high - low )
Alerts can be turned on

Данный тип арбитражной сделки также носит название «парного трейдинга». Его принцип основывается на мониторинге состояния взаимной корреляции двух валют. Как только такая корреляция начинает ослабевать, трейдер может начать скупать слабую или продавать сильную пару. После останется подождать лишь восстановления корреляции, что автоматически принесёт прибыль. Обнаружить такую возможность – зафиксировать условия для совершения подобной сделки – чаще всего помогает арбитраж форекс советник – специа

The Most Advanced Telegram Copy Trader in the market Why EazyTrader? Many of us are having emotional breakdowns during trading. Sometimes even if we got a signal, we end up in bad money management or over layering, some of us are working on another job and we won't be able to monitor the signal and place Breakeven, but still want to do trading and make an extra income. Sometimes the signal goes to profit but retraces back to our breakeven or stoploss and we had this guilt feeling saying that I
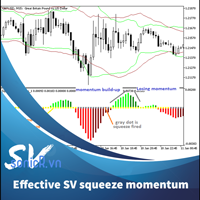
Introduced by “John Carter”, the squeeze indicator for MT5 represents a volatility-based tool. Regardless, we can also consider the squeeze indicator as a momentum indicator, as many traders use it to identify the direction and strength of price moves. In fact, this squeeze indicator shows when a financial instrument is willing to change from a trending market to another that trades in a considerably tight range, and vice versa. Moreover, it indicates promising entries as well as exit points For

The RSI2.0 indicator uses normalized price data and signal processing steps to get a normal distributed oscillator with no skew (mean is zero). Therefore, it can give much better reads than the traditional RSI. Areas/Levels of reversal: Overbought or oversold levels from traditional RSI have no statistical significance, therefore the standard deviation bands are implemented here, which can be used in similar way as possible reversal points. Divergence: As the indicator is nearly normal dist

It is a secure automated market trading software. The architecture is a fully automatic autonomous expert robot capable of independently analyze the market and make trading decisions Efficient. It is an advanced and professional trading system.
Requirements Supported currency pairs: CADJPY,GBPCHF,AUDJPY,USDCHF,EURCAD,EURNZD,NZDJPY; Best Pair CAD/JPY; Timeframe: H1; The EA may not be sensitive to spread and slippage. I advise you to use a good broker convenient for you; The adviser must work c

The Accumulation / Distribution is an indicator which was essentially designed to measure underlying supply and demand. It accomplishes this by trying to determine whether traders are actually accumulating (buying) or distributing (selling). This indicator should be more accurate than other default MT5 AD indicator for measuring buy/sell pressure by volume, identifying trend change through divergence and calculating Accumulation/Distribution (A/D) level. Application: - Buy/sell pressure: above

Panel for send/modify orders/positions by handle moved levels for take profit, stop loss, open price and expire at with lot calculations in several modes. Settings: Risk management Lot calculation mode: default: Free margin, Modes: Fixed, Free margin, Equity, Balance Minimal lot size - default: 0.01 Maximal lot size - default: 0.1 Fixed lot - default: 0.01 Percents - default: 5 Trade when have free margin (0 - disabled) - default: 30 Levels Style - default: Dash Width - default: 1 Panel Positio

Lets dabble a bit into Elliot Waves.
This is a simple indicator which tries to identify Wave 1 and 2 of Elliot Impulese Wave and then projects for Wave 3.
Ratios are taken from below link: https://elliottwave-forecast.com/elliott-wave-theory/ - Section 3.1 Impulse
Wave 2 is 50%, 61.8%, 76.4%, or 85.4% of wave 1 - used for identifying the pattern. Wave 3 is 161.8%, 200%, 261.8%, or 323.6% of wave 1-2 - used for setting the targets
Important input parameters
MaximumNumBars : To calc

The CashFlow EA works on the principle of the breakout strategy.
Introductory price 99 USD , future price 149 USD.
Description: Through stop orders, the breakouts of highs and lows, are traded. Through the adjustable trailing stop, profits are taken as high as possible and the losses as low as necessary.
It is strongly recommended to trade with a broker that offers a low spread and commission.
Please be responsible with your trading capital and only use money that you can afford to los

Торговля парами включает в себя поиск активов с высокой степенью корреляции. Цены на эти активы имеют тенденцию двигаться вместе. Когда цены отклоняются друг от друга; например, один падает, а другой нет; это создает потенциальную сделку возврата к среднему. Это также иногда называют статистическим арбитражем . Минимальное количество настроек. 1. Выбор пар 2. % Профита 3. Усреднение отклонения цены
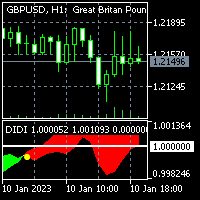
To get access to MT4 version please click here . - This is the exact conversion from TradingView: "Didi Index" by " everget ". - This is a popular version of DIDI index on tradingview. - This is a light-load processing and non-repaint indicator. - Buffer is available for the lines on chart and arrows on chart. - You can message in private chat for further changes you need. Thanks for downloading

Overview: The news bot places a buy and sell trade at the same time before economic news is released, when spreads are low. Minutes before the news, the bot places stop loss orders on both trades and adjusts them based on real-time market movements. As the news approaches, the bot stops adjusting the stop loss orders and allows them to be triggered by the market. Depending on the impact of the news, one stop loss order may be triggered and the corresponding trade closed, while the other trade re

Onic Scalper EA use Breakout Strategy and Trend Following Strategy for Scalping Trading Methods
This EA trades the breakouts from daily relative highs and lows. For the entry, stop orders are used for the fastest possible execution. Profits can be secured by the adjustable trailing stop. The backtests shown in the screenshots were done with the default settings. There might be better or worse settings. Please download the free demo to do your own testing.This EA does not use any martingale an

Forex Fighter is an advanced, multicurrency system that trades following symbols: EURJPY, GBPCHF, EURGBP, USDCAD, AUDNZD, USDJPY and AUDCAD. The strategy is based on built in indicators which I developed myself. Forex Fighter follows unique patterns that are repetitive but very often human brain is not capable of catching them. The decision maker here are two Neural Networks which have to agree whether or not a particular trade will be placed. The probability of repeating a pattern has to be ab

Moving Level , Special indicator for hunting trends and scalping! programmed to use it in any temporality, It has the trend volume strategy by marking an arrow if it is long or short accompanied by the colors blue yellow and red when it marks the yellow line with the arrow pointing up and is accompanied by blue lines, it is an uptrend When it marks the down arrow with the yellow line and is accompanied by red lines, it is a downtrend. It is used in the synthetic index markets in all pairs, It is
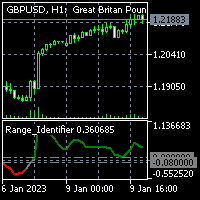
To get access to MT4 version please click here . - This is the exact conversion from TradingView: "Range Identifier" By "Mango2Juice". - All twelve averaging options are available: EMA, DEMA, TEMA, WMA, VWMA, SMA, SMMA, RMA, HMA, LSMA, Kijun, McGinley - This is a light-load processing and non-repaint indicator. - Buffer is available for the main line on chart and not for thresholds. - You can message in private chat for further changes you need.

Vortex uses low volatility moments to enter trades based on indicators. It then manages those trades with dynamic stop losses and take profits also based on indicators. A safety mode further reduces possible losses based on some multiple mathematical formulas imbedded in the codes. All i'm trying to say is, Vortex is stable and dependable. MT4 version: https://www.mql5.com/en/market/product/91678 For a more in-depth description of the EA's Inputs and FAQs pls click here: https://www.mql5.com
The utility for managing open positions can work with stops (take profit and stop loss) in money, percentages or points. The built-in trailing stop starts working from profit, the size of which can be set in currency or as a percentage. Trailing stop can work in three modes and for five instruments. With the help of the built-in trading simulator, you can check how the utility works in the strategy tester. Benefits setting stop loss and take profit in the deposit currency, as a percentage of the

Sniper rank, It has a gang programmed to hunt down perfect tickets. It has two lines that are used to hunt perfect pivots when the sails of the band come out, They work for all pairs of synthetic indices, perfect for volatility and jumps It also serves for marking forex, it operates in all pairs It is used for scalping and higher temporalities! Perfect Profit!!!!

Índico Tech Hedge Copyr - Sistema di copertura per scrivanie proprietarie!
Le nostre caratteristiche esclusive:
- Copiatrice per operazioni inverse; - Operare sulla controparte dei trader presso il tuo trading desk; - Selezionare il volume delle negoziazioni da invertire in percentuale; - Sistema di database intelligente per il controllo dei trader connessi.
• Inviaci un messaggio e ottieni la versione di prova!

ActivTrades esclusivo strumento di copy trading dedicato!
Risorse:
- Gestione per la copia di EA tramite Magic Number, che consente all'account Master di caricare più di una strategia. Ciò consente ai conti Slave collegati di gestire individualmente i segnali ricevuti e il volume scambiato; - Sistema di copia per batch fisso o fattore moltiplicatore del conto principale; - Moltiplicatore di ordini: risoluzione dei limiti di liquidità sui CFD esotici; - Nascondi le funzioni Stop Loss e Nasco

Sniper Clock Oscillator. It is an indicator where it meets the strategy from the crossing of the 50 line with a blue line and a red line. An alert is sent giving entry for purchase or sale! very effective and easy to use It is used in the synthetic index markets, ideal for volatility and jumps. It is used in the forex markets, in all currency pairs. It is used for scalping and intra daily. It serves to catch long trends at high temporalities too! Good profit!

An Ultimate Tool for quick and efficient market analysis. Unique combination of solid indicators defining market direction for trend tracking and filtration designed for you to stay on the right side of the market.
Market Rider Oscillators gives you access to one of the most used from professional trades indicators on worldwide, which were not build in for MT4 and MT5 terminals . These are unique non-repainting oscillators designed to be used on all time frames for all instruments class

An Ultimate Tool for quick and efficient market analysis. Unique combination of solid indicators defining market direction for trend tracking and filtration designed for you to stay on the right side of the market.
Market Rider Tools gives you access to one of the most used from professional trades indicators on worldwide, which were not build in for MT4 and MT5 terminals . These are unique non-repainting indicators designed to be used on all time frames for all instruments classes: Fo

Critical Trading, Currency Strength This indicator allows for viewing true value changes in the 8 major currencies, this ability has many applications for simple and advanced forex trading. No need to switch to inaccurate 3rd party applications or websites. Trend catching: No need to watch 28 charts, pair up the strongest and weakest performing pairs. Optimize entries: Show the currencies of your current chart and enter on reliable pullbacks for further confluence on your trades. Currency perfo
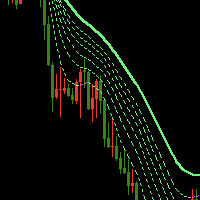
The Waterfall Trend Indicator MT5 uses line regression algorithm, using "Waterfall" in its name is in that it like waterfall when there is a strong down market trend. The indicator draws seven lines, one of which is sold line, others are dash line, the sold line is more stable. Indicator introduction The indicator can effectively filter price noise since it is calculated with line regression. It can be used to analyze market trend and design new expert that is based on trend. When the trend lin

The problem with trading candlestick patterns becomes obvious, after some experience in live markets. Hypothetical branching of candlestick patterns, are not necessary for successful trading. As a Price action trader, my principle is to keep things simple and consistent. My focus is on buying and selling pressure, which is visible in market structure. Trade Management and discipline are my secondary core elements. This indicator detect 4 Simple but Effective Price action Patterns! Yellow = Insi

The EA MuliIndy Swing Trade uses a swing trade system + martingale system + neural network system + indicator strategy (AWESOME OSCILLATOR (AO),STD,ATR) working together to find the best profit and low drawdown for trading. using historical data statistics probability. Let's give the weight of each indicator, which gives good results when the graph fluctuates up and down. without looking at trends alone For EURUSD M15 best default setting EA, it can be used Optimization Backtest to trade other

The EA Trend Pivot Point uses pivot values to choose a buy or sell trade and uses two indicators, STD and ATR, to measure market volatility and choose if market volatility is high not to trade. If the market volatility is less, then trading is allowed. Use pivot point calculations alone for probabilistic weighting of 10 AI pivot values. Based on a 20 year retrospective data backtest Resulting in the weight of this pivot value, for default it is for trading EURUSD Timeframe M15 which user can fin

The EA MultiIndy Hybrid Trend used to a trading system that combines 11 indicators 1. BOLLINGER BAND 2.RSI 3.MA 4.AO 5.MACD 6.CCI 7.MOMENTUM 8.FRACTAL 9.PARABOLIC SAR 10.STD 11.ATR and then AI to find the probability of each indicator as its weight value. Common use of martingale Then backtest twenty years to become this automated trading system. EA can send alerts through the program line, can adjust the risk. or turn off the martingale according to user requirements or can trade any currency

The strategy is based on the algorithm of a self-learning neural network and has been trained on history data. The EA opens a buy/sell order or avoids trading according to the market conditions. It is an Expert advisor that is made for a long-term vision. Considering that this expert must work 24 hours a day, it is better to use a VPS. If you have any other questions, please write me private messages and I will be happy to answer.
Timeframe: H1 Symbols: EURJPY,EURGBP,NZDJPY,GBPNZD,EURCAD

The EA AI Trend Price Action uses a trading strategy of Price Action and AI combined with Martingale The results of the backtest data 2003-2023. Using 100% reliable tick data, choose safe trades with very low risk even with martingale. But limiting the risk, not too high which can be set by the user himself as well. Requirements Supported currency pairs: EURUSD Timeframe: M30 The minimum deposit is $200 for a 1:400 leverage

Swing Trade MA is auto trading Use a system of MA Fast crossover with MA Slow and in the AI(neural network) to measure the probability weights of 10 MA lines and using the Martingale system. Backtest tick data 100 % from 2003-2023 by default setting trading EURUSD Timeframe M15. Requirements Supported currency pairs: EURUSD Timeframe: M15 The minimum deposit is $5 00 for a 1:400 leverage EXPERT DESCRIPTION Variable Description Stop Loss Stop Lost Take Profit Take Profi

L'indicatore viene utilizzato per il trading di boom e crash, è un super detective delle tendenze. Quando il mercato è in tendenza al rialzo, utilizza il segnale forte per catturare il picco, quando è in tendenza al ribasso usa il segnale regolare per rilevare più picchi.
L'indicatore è basato sull'azione dei prezzi in natura con alcune logiche matematiche. È utilizzato solo per la cattura di punte.
L'indicatore possiede il seguente output
1. Segnale forte
2. Segnale regolare
3. Avvis

Stochastic Strategy Revealer This EA uses Stochastic Oscillator to generate strategies for almost all markets and trade them using this EA. How will this EA help you? We all know trading is hard, and creating a strategy is even harder, so this EA will let us sit back and let the strategies reveal themselves to us and select the ones we like. this ea was made to get rid of wondering and headaches and you will only search for good markets. Positions Sizing This EA uses the basic position sizing m

What is Alpha J? Alpha J is a fully automated system that trades the USD/JPY spike during the Tokyo session with great precision.
How is Alpha J built? Alpha J is developed based on our proprietary algorithms and statistical models, which are the result of our years of intensive in-house research into the price volatility around the Tokyo session. To avoid overfitting, Alpha J uses 80% of the price data to develop the model, and the remaining 20% to test and validate it.
How does Alpha J
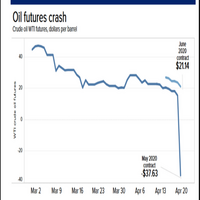
OTTIMIZZA EA PRIMA DEL TEST E DELL'UTILIZZO.
I futures del petrolio greggio sono stati costruiti con dati reali del mercato dei futures su intervalli di tempo di 1 ora da gennaio 2022 a dicembre 2022. Testa queste date per test retrospettivi e analisi. Ottimizza quando necessario.
Fai trading dal mercato dei futures reale o se fai trading di qualsiasi derivato del petrolio, prova i parametri per vedere come si adattano ai dati e al broker che stai utilizzando. I futures sono dati centralizz

The Trend Snatcher is a multi-timeframe indicator that detects swings on the price market chart. Important levels, such as Supply and Demand levels, Trendline touches, reversal patterns, and others, can also be added as confluence when making trading decisions.
The indicator employs two lines that aim for the highest selling and lowest buying levels. When the two lines cross, a signal is generated.
All trading instruments are compatible, including currency pairs, synthetic indices, metals
The utility for managing open positions can work with stops (take profit and stop loss) in money, percentages or points. The built-in trailing stop starts working from profit, the size of which can be set in currency or as a percentage. With the help of the built-in trading simulator, you can check how the utility works in the strategy tester. Benefits setting stop loss and take profit in the deposit currency, as a percentage of the account balance or by points; adding stop loss and take profit

Sniper2 , It has points of lines, with colors that are showing you an entrance, that work as support and resistance! green dotted lines green shows entry for sale, the red dotted lines show a buy entry, pay attention to the supports that work as a break to catch long candles in a longer period of time. works for forex all pairs works for synthetic indices all pairs ! indicator on sale!
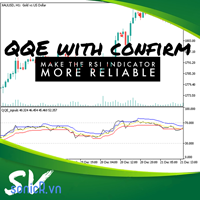
New QQE with confirm The relative strength index (RSI) is a technical indicator of momentum that measures the speed and change of price on a scale of 0 to 100, typically over the past 14 periods. Cause RSI measures the speed and change of price, trader normally use this indicator in two way: + Buy when oversold, sell when overbougth. + buy or sell when identifying divergence from rsi with price. In two way, it wrong when rsi in overbouth (for example) for long time or divergence. Even price ju

Multipound Scalper MT5 is a multicurrency Expert Advisor that works with a customizable trading time filter, Moving Averages and Bollinger Bands Indicators to determine the market entry and exit points. ONLY 7 out of 10 copies left going at 62$ . NEXT PRICE : 98$ . SETUP The following is an overview of the settings used in this Expert Advisor: EA Comment = Comment of the order placed by the EA (Multipound Scalper). Fixed Lot size = 0.1 Use Risk = true (true means risk % will be used and false m
What is Double Top and Bottom Double top and bottom patterns are chart patterns that occur when the underlying investment moves in a similar pattern to the letter "W" (double bottom) or "M" (double top). Double top and bottom analysis is used in technical analysis to explain movements in a security or other investment, and can be used as part of a trading strategy to exploit recurring patterns. you can fin MT4 version hier
Indicator shows you 2 Level target and stop loss level. Stoploss level
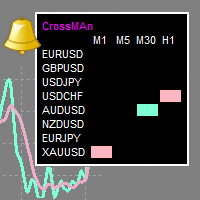
"CrossMAn" is a table indicator that gives signals about the intersection of two moving averages, on selected instruments and time periods.
The intersection of moving averages is one of the most popular signals on the stock exchange.
The signal is displayed as colored rectangles in the table. Thus, you can assess at a glance which tool should be paid attention to.
(Crossman does not add moving averages to the chart.)
The indicator table can be dragged with the mouse.
The size of the table

The diamond top and bottom are reversal patterns. It represents a rally to a new high with a drop to a support level followed by a rally to make a new high and a quick decline, breaking the support level to make a higher low. The bounce from the higher low is then followed by a rally, but making a lower high instead. Once this behavior is identified, prices then break the trend line connecting the first and second lows and start to decline further. You can find MT4 version hier
Indicator show

This z-score indicator shows the correct z-score of an asset, as it uses the normalized price data for calculation, which is the only correct way. Z-score is only applicable for normal distributed data, therefore not the actual price is considered, but the normalised returns, which were assumed to follow a normal distribution. Returns are mean reverting and assumed to follow a normal distribution, therefore z-score calculation of returns is more reliable than z-score on price, as price is NOT m
Trend Following Strategy Generator The following Expert Advisor helps to generate robust trend-following strategies using price action and a few parameters. the story behind the expert Advisor is to unfold market behavior for an instrument and choose how we can trade it best. After finding your favorite strategy you can save the parameters and start trading the strategy in no time. There is no limit to how many strategies you can generate. How will this EA help you? We all know trading is hard,
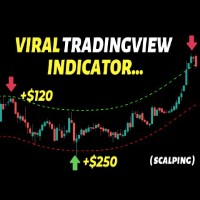
This indicator builds upon the previously posted Nadaraya-Watson Estimator. Here we have created an envelope indicator based on kernel smoothing with integrated alerts from crosses between the price and envelope extremities. Unlike the Nadaraya-Watson Estimator, this indicator follows a contrarian methodology. Settings
Window Size: Determines the number of recent price observations to be used to fit the Nadaraya-Watson Estimator.
Bandwidth: Controls the degree of smoothness of the envelop

Build your own model to predict averages of turning points of the Triple Moving Average Oscillator. It is simple. Rate me with stars. Just load the indicator Triple Moving Average Oscillator in you platform and choose the period. Scroll through to observe the averages of the highs and lows over a period of time. Add the levels for a buy and a sell on the Triple Machine and this will show the average of highs and lows to look for buys and sell. You can load multiple copies with multiple levels.
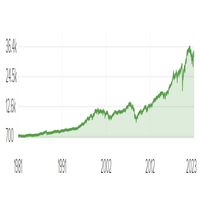
L'EA è ottimizzabile e ottimizzato da gennaio 2022.
Dow Jones Lot Trader è stato realizzato con l'apprendimento automatico e scambia i futures Dow Jones su grafici a 1 ora utilizzando lotti fissi. L'EA è stato realizzato su dati di futures reali sul micro Dow Jones.
Potrebbe essere necessario eseguire un backtest se stai negoziando derivati del Dow Jones per vedere se si allinea con i dati reali dei futures. I valori sl e tp si basano sull'intervallo reale medio.
La logica nell'EA è che s

Fibonacci retracement levels—stemming from the Fibonacci sequence—are horizontal lines that indicate where support and resistance are likely to occur. Each level is associated with a percentage. The percentage is how much of a prior move the price has retraced. The Fibonacci retracement levels are 23.6%, 38.2%, 61.8%, and 78.6%. While not officially a Fibonacci ratio, 50% is also used. The indicator is useful because it can be drawn between any two significant price points, such as

QUESTO EA HA INGRESSI OTTIMIZZABILI.
Nice Little Bot negozia GBP/USD su grafici a 1 ora. Scambia utilizzando i canali Keltner, le bande di Bollinger e LWMA per la logica. È stato creato con l'apprendimento automatico ed è un simpatico robottino.
Ci sono input che potrebbero essere ottimizzati o modificati se li trovi. La gestione del denaro utilizza una percentuale scalare del saldo. C'è % di equilibrio e lotti massimi. Prova il back test di partenza
dal 2013.

EMA BASEd ON EMA, ICHIMOKU-Kejun-sen line and MACD input group "RSI Setting" input int Inp_RSI_ma_period = 7; // RSI: averaging period input ENUM_APPLIED_PRICE Inp_RSI_applied_price = PRICE_WEIGHTED; // RSI: type of price input double Inp_RSI_LevelUP = 60; // RSI Fast and Slow: Level UP input double Inp_RSI_LevelDOWN = 40; // RSI Fast and Slow: Level DOWN input string

Brilliant Knight , the majestic Knight rises with great intellect at your service.
The K night is a unique piece in the game of C hess , represented by a horse's head and neck. It maneuvers two squares vertically and one square horizontally, or two squares horizontally and one square vertically. It is has a unique ability of jumping over other pieces, just as the unique power you require to success in the forex market.
It has proved itself for stability & sustainability from 201

Binary Trade Panel è uno strumento molto utile per il trading di opzioni binarie sulla piattaforma MT4/MT5. Non è più necessario configurare plug-in al di fuori di MT4/MT5. Questo è un pannello semplice e conveniente direttamente sul grafico MT4/MT5. Il Binary Trade Panel è uno strumento utile per i trader che utilizzano la piattaforma MT4/MT5 per negoziare opzioni binarie. È un pannello semplice e conveniente che consente ai trader di effettuare operazioni di opzioni binarie direttamente dal g

The indicator ‘Probability Range Bands’ gives a prediction of the amount, how much the asset is moving from its current price. The range bands give probabilities, that the candle close will not exceed this certain price level. It is also called the expected move for the current candle close. This Indicator is based on statistical methods, probabilities and volatility. Asset price is assumed to follow a log-normal distribution. Therefore, log returns are used in this indicator to determine the
Pack Dragon , Indicator 3/1, Dragon signal It has the strategy of an oscillator programmed to grab supports and resistances to take advantage of every candle in the market, and it gives you to take your time and a simple analysis it is simple where you mark the green dots at the bottom gives you input for long And when it does not mark anything, it is giving you a short warning! works for all seasons for forex markets and synthetic indices !

Pack Dragon, Indicator 2/3 Legend Moving It has the barrier pass strategy as well seen in the photo, where there is a dot on the yellow line, when there is a downtrend, there are red dots when it falls giving perfect entries in short, the same when the market is bullish, it marks another navy blue line, where it gives perfect entries over the green dots for long , It is available for all seasons and for markets of Forex and synthetic indices !

Pack Dragon. indicator 3/3 Dragon machine, has the perfected support and resistance strategy, indicates the floors and ceilings with the naked eye can be seen, giving signal to each circle pink giving entry to the rise and the green circle gives entry to the low wing, where the support of the green and red lines helps. Works for synthetic indices and forex all pairs, ideal for operating crash and boom. !
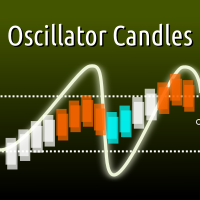
With this indicator you can colorize the candles on your chart based on the output of any oscillator indicator. Supporting both built-in and custom indicators, with the ability to set up to 5 custom parameters, custom color scheme, and upper/lower threshold values. Most built-in indicators in MT5 will be found under "Examples\\" path. For example, to use default RSI indicator, set your indicator path to "Examples\\RSI" in the inputs dialog. Input01-05 sets the custom parameters of your indicator
Scopri come acquistare un robot di trading dal MetaTrader Market, il negozio di applicazioni per la piattaforma MetaTrader.
Il sistema di pagamento di MQL5.community supporta le transazioni tramite PayPal, carte bancarie e gli altri sistemi di pagamento più diffusi. Per essere pienamente soddisfatto, ti consigliamo vivamente di testare il robot di trading prima di acquistarlo.
Ti stai perdendo delle opportunità di trading:
- App di trading gratuite
- Oltre 8.000 segnali per il copy trading
- Notizie economiche per esplorare i mercati finanziari
Registrazione
Accedi
Se non hai un account, registrati
Consenti l'uso dei cookie per accedere al sito MQL5.com.
Abilita le impostazioni necessarie nel browser, altrimenti non sarà possibile accedere.