YouTube'dan Mağaza ile ilgili eğitici videoları izleyin
Bir alım-satım robotu veya gösterge nasıl satın alınır?
Uzman Danışmanınızı
sanal sunucuda çalıştırın
sanal sunucuda çalıştırın
Satın almadan önce göstergeyi/alım-satım robotunu test edin
Mağazada kazanç sağlamak ister misiniz?
Satış için bir ürün nasıl sunulur?
MetaTrader 5 için Uzman Danışmanlar ve göstergeler - 113
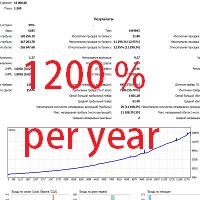
Multi-currency expert Advisor for 3 currency pairs. You can use different pairs, set in the settings. You only need to change the magic number when adding new currencies. Then the yield will be even higher. Lot and closing orders are calculated from the account's free funds. Therefore, you can use it with other expert advisors at the same time.
The expert Advisor works with several magic numbers at once and orders are closed using them.
Drawdown increases rarely, mainly when there is strong v

THE SOUND OF MARKET is an indicator designed to detect the sound produced for the market movement. This system detects the background sound produced by market movements in real time to decide in your operation. In addition, by analyzing the sound recorded in the indicator, we can detect operational patterns. You can download the demo and test it yourself.
The indicator has a text help in the upper right corner, in which it shows whether the indicator has a bullish or bearish backgrou
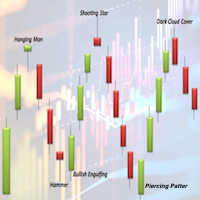
The DYJ GlobalForexTradeWarCandleShapeMT5 strategy: it is provided with one combined built-in indicators: DYJ CandleShapeMT5 in order to determine the signals and has different inputs for Short and Long positions in order to improve its precision. The DYJ CandleShapeMT5 contains 80 shapes, such as MORNING STAR, DOJI STAR, HARAMI CROSS,INVERT HAMMER,ENGULFING..... Most trading strategies put their emphasis on finding out when to enter the market. Whether it’s technical or fundamental,

TClusterSearch - индикатор для поиска кластеров согласно заданным критериям. Для работы индикатора требуются реальные биржевые обьемы. Основная функциональность
Поиск и визуализация кластеров с обьемом, задаваемым фильтрами (до трех). Для каждого фильтра можно задать свой цвет. Поиск и визуализация кластеров с дельтой большей значения задаваемым фильтром Поиск и визуализация кластеров по бид/аск согласно фильтру Возможность фильтровать кластера в зависимотсти от его положения относительно ба
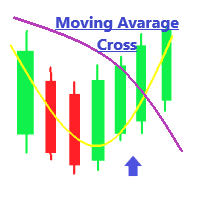
Sansa MovingAvarage Cross MM Description in English and Italian =
This Indicator is based on the cross of two Moving Avarage, and gives you the signal of Buy and Sell when they Cross, with Arrows and Alerts.
What’s the best about it? You can set up the two Moving Avarage just as you need!
When you attach the indicator on the chart , a window will open where , in the INPUT section, you can choose the MATimeFrame(H1,H4,M30 ....), the MaMethod ( Simple, Exponential.....),SlowMa Periods( 50 as
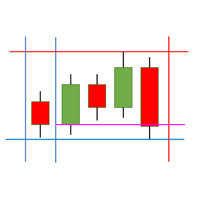
The SessionLines indicator for MT5 shows up the most important time intervalls and price levels in the DAX-Index. The following times get marked: Opening Time DAX Future, Opening Time DAX Kassa, Closing Time DAX Kassa, Closing Time DAX Future, Opening Time US Index Futures, Opening Time US Kassa Markets, Spezial Times, The following price levels get marked: Daily High/Low, Previous Daily High/Low, Weekly High/Low, Opening and Cloth Levels of Future and Kassa Daily (inkl. Previous Day).
The SessionLines indicator for MT5 shows up the most important time intervalls and price levels in the US- Indices .
The following times get marked: Opening Time US Futures, Opening Time US Kassas, Closing Time US Kassas, Spezial Times,
The following price levels get marked: Daily High/Low, Previous Daily High/Low, Weekly High/Low, Opening and Cloth Levels of Futures Daily (inkl. Previous Day).

MOUNTAINS:It is an indicator that detects market consolidations prior to a movement.
The objective of this indicator is to indicate the areas before the market makes a move.
The areas that we are interested in detecting are the PLATEAU, which are between the slopes.
When the system detects a PLATEAU , the trader must place his operation in that area, waiting for the increase in volatility to reach its target.
The best option to carry out the operation of the PLATEAU is throug
Pullback Probability It is an indicator that shows us the probability that the price will t urn around and we can operate that market turn.
The indicator marks a line that oscillates between a percentage of 0% to 100%.
The one indicated in the upper left corner shows us a help in which it informs us of the area in which the price is in real time, as well as the percentage that the candle is open. You can download the demo and test it yourself.
The indicator marks 6 work zones. 1) Above 80% t

Expert is a fully automated Trend and Levels Follower system. I will always help you, please contact me ! I accept suggestions for improving this product. General Strategy Definition For every trader: This trading system is suitable for both experienced traders and beginners. 100% Quality Test : Stress tested with 100% tick data using variable spread Recommendations Symbol: any optimised. Default - USDCHF TimeFrame: any. Min Account Balance: 200 $. Broker: All brokers are fine. MT5 Accou
The Keltner Channels are powerful tools of technical analysis made specifically to take advantage of the opportunities created by price volatility. The indicator was originally developed by the American Chester W. Keltner, in the 1960s, and is widely used, especially in the American market.
However, despite the high usability in the market, the Keltner Channel suffers from a problem of having only 2 channels, which makes it very difficult to know the right time to enter or leave a position. So

Las Bandas de Bollinger se encuentran entre los indicadores más utilizados en el análisis técnico, su autor es el estadounidense John Bollinger, analista financiero y gran colaborador en el área. John comenzó a desarrollar esta técnica en la década de 1980 y en 2001 publicó su libro Bollinger on Bollinger Bands.
Las bandas de Bollinger son muy útiles para indicar niveles de precios en los que una acción puede haberse apreciado o devaluado demasiado, además de indicar signos de máximos y fondo
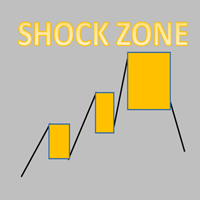
Every trading shock range is a point of gaining momentum!
The stop loss is generally the height of the shock zone.
Take profit depends on personal preference and market position. Generally at least double the height of the shock zone. Being in a good market position, it can have a profit-loss ratio of 5-10
Necessary for traders: tools and indicators Waves automatically calculate indicators, channel trend trading Perfect trend-wave automatic calculation channel calculation , MT4 Perfect tre

Provide ideas for trend trading.
Automatic calculation and generation of trend channels.
The channel line, also known as the pipeline line, is to draw a straight line parallel to the trend line in the opposite direction of the trend line, and the straight line crosses the highest or lowest price of the recent period. These two lines run the price in the middle and have obvious pipe or channel shapes. Necessary for traders: tools and indicators Waves automatically calculate indicators, channel
This indicator determines the channels along which prices move on the trading history. There are many trading strategies that rely on channel trading on a channel breakout. This indicator can draw price channels by reading information from several timeframes at once (from the current, from the second and third). You can customize the color and thickness of the lines for each timeframe. Also, you can set a different distance between highs and lows to draw channels or lines. There is also a simple

The BTFX Pivot Points is an indicator which calculates the Support and Resistance levels for each day. By using this indicator the pivot levels point out clear targets to aim for. The resistance levels are shown in purple above the silver pivot line. The support levels are shown in Orange and can be found below the silver pivot line. This indicators works very well when used with The BTFX Daybreak Indicator. For a more in depth explanation of these indicators please watch the Youtube video attac

The RealCryptoLevels indicator by downloading the order book of crypt exchanges with maximum depth shows horizontal volumes of popular crypto currencies on the chart, so you can see not only the volumes, but also the levels and them strength (see screenshots), which is very important for successful trading in all strategies from scalping to medium-term trading, because you can see the preferences of buyers and sellers at the moment and their mood for the future. The indicator pulls volume data

Genetic Code , is an indicator that differentiates two types of market: the market in range and the market with volatility.
This indicator allows the trader to choose whether to use a range trade or a volatility trade. You can download the demo and test it yourself.
When observing the trace of the indicator it shows us narrow areas that correspond to market ranges.
These ranges always end with a volatility process, so you can work with two conditional pending orders.
When the tw

Defender Deposit is a professional expert system designed to analyze markets based on the Parabolic SAR indicator. On a "bull trend" the indicator is below prices, on a "bear trend" - above. If the price crosses the Parabolic SAR lines, then the indicator reverses, and its next values are located on the other side of the price. With this "reversal" of the indicator, the reference point will be the maximum or minimum price for the previous period. The reversal of the indicator is a signal ei

Audible order flow, we can set a different tone for up to 12 buy order sizes and 12 other sizes for sell orders.
Up to 84 musical notes are available, ie 7 octaves. The default settings have been tested in the Forex (EURUSD, GBPUSD, XAUUSD, USDJPY, USDCHF and USDMXN) and Brazilian futures (WDOFUT, DOLFUT, WINFUT and INDFUT).
This tool was inspired by an interview with a visually impaired trader, as there are no tools for this type of trader and I decided to make it available for free, so the

Buy and sell signals based on the Day Trade Trap Strategy for failed breakouts, popularized in Brazil by Alexandre Wolwacz (STORMER).
How does the indicator work? The indicator activates the buy and sell signal when their respective conditions are met. For a buy signal, we need a bar making a low lower than the previous day low. On this moment, the signal is plotted with the secondary color. For a sell signal, we need a bar making a high higher than the previous day high. On this moment, the
DNA is an indicator that allows us to operate both in favor of a trend and a pullback.
You can download the demo and test it yourself.
Trend trading is above zero and pullback trading is below zero.
The direction of the operation is marked by the color of the line.
If the line is green it corresponds to purchases.
If the line is red it corresponds to sales.
For example, if the green line is above zero and growing, we will have an uptrend operation. If the red line is above zero and growin

Boleta de negociação, para aglizar operação manual no Metatrader 5 no mercado de futuros.
Principais Funções :
Utilização de teclas de atalho para pre-visualizar ordens pendentes; Botões para operações a mercado; Botões para ordens atrás do preço, as quais ajustam o ponto de entrada, esperando o preço voltar uma quantidade de pontos definida no campo "Dist. Atras" para abrir a posição; Botões para zerar posições e para cancelar as ordens pendentes; Botão para colocar uma ordem Tr

Ichimoku KumoTwist M_M
Description in English and Italian =
This Indicator is based on one of the Strategies with Ichimoku Indicator, in particular the KUMO TWIST! The Kumo Twist is the cross of the Senkou Span A with the Senkou Span B; The Senkou Span A and the Senkou Span B are the two lines that create the Cloud in the Ichimoku Indicator; it will give you of Buy and Sell when they Cross, with Arrows and Alerts.
When you attach the indicator on the chart , a window will open where , i

It transforms imprecise and crooked lines INTO perfectly STRAIGHT and HORIZONTAL Lines!
DO NOT WASTE your TIME anymore trying to draw perfectly straight lines!
This useful tool straightens crooked lines and saves you from the nervousness!
You can also switch, with a button, between Normal Trendlines and STRAIGHT Horizontal lines! Enjoy it and have a nice trading!

EA GAP Strategy MT4 - Expert Advisor for trading on gaps. This strategy is very popular in the FOREX market - when a gap arises on the chart, then most often the price then closes it. Advisor rarely trades, mainly at the opening of a new week on Monday, so testing should be carried out over a large period of time. The most volatile pairs are suitable for work: GBPUSD, USDCAD, EURUSD, USDJPY, USDCHF, AUDUSD, NZDUSD. - Min deposit: 100$
- Recommend ECN broker with LOW SPREAD: IC Market , Exness

Night Vision Scalper EA is a scalping system for working in a calm market at night. Does not use martingale or grid. Suitable for all brokers, including American brokers with FIFO rules. All orders are accompanied by a virtual stop loss and take profit in pips, the values can be either fixed or dynamic. It also has a virtual trailing stop and breakeven. The chart displays information on the speed of order execution and slippage.
- Min deposit: 100$
- Recommend ECN broker with LOW SPREAD: IC Ma
DNA is an indicator that allows us to operate both in favor of a trend and a pullback. You can download the demo and test it yourself.
Trend trading is above zero and pullback trading is below zero.
The direction of the operation is marked by the color of the line.
If the line is green it corresponds to purchases.
If the line is red it corresponds to sales.
For example, if the green line is above zero and growing, we will have an uptrend operation. If the red line is above zero and growin

CAPITARC`s NAKED TRADER Expert Advisor for MT5 Naked Trader -is a professional expert advisor used by our investment firm it is based on pure price action. This product is looks at all the price action patterns, candles and possible trend reversal formations of the ever changing markets, while the usual experts are based on one or two indicators, this expert trades naked! Literally! Pun Indented! FOREXSIGNALS uses a similar robot for their INTRADAY trades. This allows the expert to adapt to

MoneyMachine MT5 Expert Advisor is a fully automated forex trading robot designed using our ten unique trading strategies that we have developed over the years. In addition, you get a Metatrader 5 Expert Advisor builder featuring many technical indicators. We assign each of these strategies weights to determine how much they contribute to each trade. The combination of these successful strategies ensures maximum efficiency. Each strategy loops through different settings for signal confirmation.

If you are looking for a EA can Auto Trading and not send Signals to yours Telegram Chanel . DON'T MISS IT!
The Expert Advisor works on a linear regression channel. The Expert Advisor trades from the channel borders, stop-loss and 2 take-profit levels with partial closing of orders are used for closing. The chart displays information about profit and draws the regression channel itself. The channel values are recalculated only when a new bar is formed.
- Min deposit: 200$
- Recommend ECN br

Belirtilen zaman dilimindeki Yüksek ve Düşük fiyatlara dayanarak otomatik olarak Fibo seviyelerini çizer Çoklu çubuklar birleştirilebilir: örneğin, 10 günlük Yüksek ve Düşük fiyatlara dayalı bir Fibo elde edebilirsiniz Benim #1 Aracım : 66+ özellik, bu gösterge dahil | Sorularınız için iletişime geçin | MT4 sürümü Potansiyel dönüş seviyelerini görmeye yardımcı olur; Fibo seviyelerinde oluşan formasyonlar genellikle daha güçlüdür; Manuel çizim için harcanan zamanı önemli
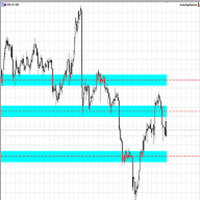
Making Charting simple!
The Support/Resistance EA combines a sophisticated neural network algorithm with an Average Range computation to make your supply and demand zones easy to spot! The EA is very easy to use and can save you valuable time when charting through financial instruments. Areas of consolidation are highlighted according to your preference and timeframe, making it easier to identify areas of break-out or small regions to scalp. Features :
Choose two Timeframes (From 1 Minute up

TD Combo is better when you have sharp directional moves, because it requires only thirteen price bars from start to finish compared to TD Sequential which needs at least 22 bars. The criteria for a Setup within TD Combo are the same with those required for a Setup within TD Sequential. The difference is that the count starts at bar 1 of the setup and not from bar 9 and TD Combo requires four conditions to be satisfied simultaneously.
Requirements for a TD Combo Buy Countdown
- Close lower or

The indicator scans for TD Combo signals in multiple timeframes for the all markets filtered and shows the results on Dashboard. Key Features Dashboard can be used for all markets It can scan for signals on MN1, W1, D1, H4, H1, M30, M15 ,M5, M1 timeframes Parameters UseMarketWatch: Set true to copy all symbols available in market watch MarketWatchCount : Set the number of symbols that you want to copy from the market watch list. CustomSymbols: Enter the custom symbols that you want to be availa
T D Sequential indicator consist of two components. TD Setup is the first one and it is a prerequisite for the TD Countdown – the second component.
TD Setup TD Setup compares the current close with the corresponding close four bars earlier. There must be nine consecutive closes higher/lower than the close four bars earlier.
1- TD Buy Setup - Prerequisite is a bearish price flip, which indicates a switch from positive to negative momentum.
– After a

The indicator scans for TD Sequential signals in multiple timeframes for the all markets filtered and shows the results on Dashboard. Key Features Dashboard can be used for all markets It can scan for signals on MN1, W1, D1, H4, H1, M30, M15 ,M5, M1 timeframes Parameters UseMarketWatch: Set true to copy all symbols available in market watch MarketWatchCount : Set the number of symbols that you want to copy from the market watch list. CustomSymbols: Enter the custom symbols that you want to be a

Trend Indicator This indicator is about long buy and long sell using a simple visualization of trend. The green candle after a long sell period means a good moment to buy. A red candle after a long sequence of buyers means a good moment for sell. After all, you can use all time-frames on this indicator. * * If you prefer a better visualization, use long period on chart. Ex: 1H and 4H.

Hello
This EA for send any indicator Signals (buffer) to your channel in Telegram with photo for chart also you can share your signals with your clients in your telegram please watch the photos
you must have Telegram channel then make bot and give it Permission and get token (watch this video to know how do it) https://www.youtube.com/watch?v=x1bKWFOjSBE
and you must download this files https://drive.google.com/file/d/1pYpnWUr4Kb4aIwdoGVD_9zSH1HWX-tt3/view?usp=sharing then unzip files then pu
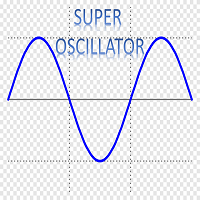
Super Oscillator , is a powerful indicator that vibrates along with the market, resulting in a very useful tool to improve and decide your trading.
You can download the demo and test it yourself.
In a versatile indicator that in a single graph shows us information about four different aspects of the market
1) 4 operational zones. The indicator divides the screen into 4 zones that allows us to properly assess the moment of the market. a) Pullback Buy Trend. If the indicator is above

Silent Trader This is an automated trading robot for trading the GBP/JPY currency pair on the M15 time frame GBPJPY M15 Trading parameters: Entry Amount: 0.50 lots. Stop Loss: 146 pips, which is the maximum loss allowed per trade. Take Profit: 171 pips, which is the level at which the trade is closed to mark the profit. Technical indicators used: Money Flow Index (MFI): Period: 13. Level: 48. Force Index: Period: 29. Alligator Indicator: Jaws period: 34, shift: 14. Teeth period: 9, shift:

DAILY STATS PANEL is a small panel that shows some statistic of opened chart. For example: Fibonacci resistance and support, daily average moving points and today's moving range, etc. After applied this expert advisor to chart, a small panel will be shown on the right. ** NOTE: This is not an algo trading expert advisor. **
Input parameters show_pivot - Whether or not to show pivot, resistance and support line on the chart. Pivot Color - R1-R4, Pivot and S1-S4 horizontal line colors.
Statist

MoMo Trade MT5 (MT4 version https://www.mql5.com/ru/market/product/57354 ) - trading system based on one of the momentum strategies. It uses simple and reliable tools like MACD and EMA to find entry points. The trading strategy looks for reversal patterns after trend area. The EA has implemented to work on M5 timeframe and focuses on short-term profit targets. But it also can be used on any timeframe. Volume calculation The volume amount is fixed ( Fixed volume ) or calculated based on risk pe
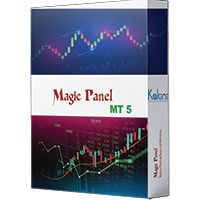
Magic Panel for MT5 is a Menu based Trading Panel. with the help of Magic Panel traders will be able to access various trading tools right from Menu Panel in MetaTrader Chart. All tools are one click to activate and another click to deactivate its that simple. Current version of Magic Panel comes with. - Trend Scanner. - Five in One Pivot Point. - Currency Strength Meter. - Multi Symbol Heat Map Scanner. - Auto Trend Line. - Symbol Search Box. - Symbols Dropdown Menu. - One click object Clear Bu

Steel è un potente expert advisor dal codice stabile e pulito che apre un singolo trade per mercato impostando Take Profit e Stop Loss e sfrutta il Trailing Stop Loss per ottenere il migliore profitto. Può essere utilizzato e configurato su qualsiasi mercato in quanto il segnale di acquisto o vendita viene elaborato dalla sola lettura delle candele rendendolo immune da falsi e ritardatari segnali generati dagli indicatori. Si può impostare la lettura di una singola candela o di un gruppo, quand
The EA opens trades based on Fractals indicator signals and uses smart averaging and position volume calculation.
Unlike most grid expert advisors, Double Grid Pro opens averaging positions only on signals. The Fractals indicator is considered the most effective in this case. The expert Advisor can be configured for an aggressive and conservative trading style. The key parameter in the strategy is the CorrectionValue parameter, it indicates the size of the correction at which we close the enti

ATR Projeksiyon Göstergesi, finansal piyasalardaki fiyat hareketlerinin potansiyel sınırları konusunda keskin görüşler sunmak amacıyla tasarlanmış teknik analizde güçlü bir araç olarak öne çıkıyor. Esnek yaklaşımı, kullanıcıların analiz ölçümlerini sezgisel bir şekilde özelleştirmelerine, her işlem yapılan varlığın özel ihtiyaçlarına uyarlamalarına izin verir.
Özelleştirilebilir İşleyiş:
Varsayılan olarak, ATR Projeke 100 mumun ortalamasının %30'unu göz önünde bulundurarak çalışır. Bu esneklik

The DYJ GlobalForexTradeWarLaguerreMT5 is based on Laguerre indicator. It can be used for any currency pair and timeframe. It also uses MA indicator filtering false signals.
open long order when FastMA crosses above the SlowMA and Laguerre's oversold. open short order when FastMA crosses below the SlowMA and Laguerre's overbought.
Most trading strategies put their emphasis on finding out when to enter the market. Whether it’s technical or fundamental, everyone is looking for an e

Smoothing Oscillator , is a powerful indicator that vibrates along with the market, resulting in a very useful tool to improve and decide your trading. This indicator is a smoothed version of the Super Oscillator MT5 that you can download at this link https://www.mql5.com/es/market/product/59071 The idea of this indicator is to smooth and limit the aggressiveness of the previous indicator, it has less power in terms of pullback points but has more power to detect trends and consolidations Yo

This EA will open buy or sell orders depending on any buffer indicator just but Buy buffer and sell buffer there is a lot of settings in EA like take profit stop loss trailing stop duration time auto lot double lot required profit dollars to close close it reverse
and more you can download demo version and try it back test
Good luck -------------------------------------------------------------- السلام عليكم هذا الاكسبيرت سيفتح شراء او بيع اعتمادًا على اي مؤشر بفر الاكسبيرت يحتوي على الكثير من

Прибыль в прошлом не гарантирует прибыль в будующем!
Когда рынок перепродан или близок к перепроданности открываются позиции против тренда. Если рынок продолжает движение против нашей позиции открывается сетка. Рабочий тайм фрейм H1 M30 но также можно оптимизировать под любой ТФ. Управление рисками достигается за счет определения размера лота.
Размер депозита на основные 28 пар: Минимум 0.01 на 1000$ Оптимально 0.01 на 2000$ Низкий риск 0.01 на 3000$
Прибыль в прошлом не гарантирует прибыл

This indicator will create bars in 4 deference colors. The Green Bar is Up Trend. The Red Bar is Down Trend. Lite Green Bar is No Trend (corrective or sideway) but still in Up Trend. Pink Bar is No Trend (corrective or sideway) but still in Down Trend. You can just looking at the Bar's Color and Trade in Green Bar for Long Position and Red Bar for Short Position. You can change all the colors in your way. 1. Alert function : Will popup Alert Windows and play sound when the Bar was changed.
Artemis is a currency-pair-EA which detects entry points by Moving Average - controlled by multiple trend-following-indicators. With Artemis you can trade every currency pair. Signals are generated when the price crosses the moving average and in parallel all three additional indicators confirm the trend direction. If only one indicator deviates from the trend direction, no position is opened. Basically, you can use Artemis on every time period. For best results it is recommended to use it on ti

Little experience in trading?
Do you want to try yourself as a professional scalper?
This advisor is just for you! Better to use a brokers Rannforex.com or IcMarkets.com
The essence of the strategy - from the lower line (blue) we buy, from the upper (red) we sell.
You choose a relatively flat instrument. For example EURGBP in the evening. Turn on the Timeframe M1-M5. And launch the EA on the chart.
The EA builds a channel at the start. And it displays a panel with buttons and informatio

zap 43996914141 pelo valor de 50 + brinde
ProTrader B3 Mini é um utilitário para a plataforma de negociação MetaTrader 5
Foi programado especialmente para os ativos WIN (mini índice bovespa) e WDO (mini dólar)
O conceito do B3 Mini é ser simples, prático e intuitivo, um excelente assistente para scalpers/day traders!
Opere totalmente pelo teclado do seu PC, experimente, você vai gostar de usar! ( 'ω' )
Nota:
1 - Este utilitário não funciona no testador de estratégia
2 - Teste a versão demo

HAWA GOLD MT5 Advanced trading indicator with realistic pre-defined entry and exit levels with almost 80% win rate. The system focuses only Small and Steady Profits . It uses fixed stop loss for every signal to keep money management in place. As compare to other available indicators in market, HAWA gold has unique feature of displaying total profit and loss in terms of points where 1PIP=10points and Minimum profit is 10 pips. Its smart and advanced algorithm detects trend and trend strength

The Crash BandiCoot works on the Crash 1000 and Crash 500 index which is available on the Binary.com or Deriv.com platforms. The EA uses the Awesome and Accelerator Oscillators to enter and exit trades on the 1minute (M1) time frame. The minimum lot size is 0.2 for Crash 1000 and Crash 500. The EA works best on a VPS. Minimum account size should be $200. How it works:
***************** 1. Entry : After a spike(only), the EA looks at the Awesome Oscillator and Accelerator Oscillator for a green

The Multitimeframe-Candles (MCandles) - Indicator for MT5 shows the contour of an higher, free selectable, timeframe as an overlay on the current timeframe. You can freely choose the timeframe, number of candles and color of the overlays. The indicator only calculates the current candle frequently, so it saves computing capacities. If you like the indicator, please left a comment.

The indicator builds a graphical analysis based on the Fibonacci theory.
Fibo Fan is used for the analysis of the impulses and corrections of the movement.
Reversal lines (2 lines at the base of the Fibonacci fan) are used to analyze the direction of movements.
The indicator displays the of 4 the target line in each direction.
The indicator takes into account market volatility.
If the price is above the reversal lines, it makes sense to consider buying, if lower, then selling.
You can open posi
Yellow mouse neo Yellow mouse neo - fully automatic Expert Advisor designed to test the strategy of the Yellow mouse scalping Expert Advisor with advanced settings and additional filters. To purchase this version, you can contact in a personal. The standard RSI and ATR indicators are used to find entry points. Closing of transactions takes place according to the author's algorithm, which significantly improves the risk control and security of the deposit. Risky strategies like "martingal

You ask yourself the question every time you open your charts: how to win in trading? Will using a lot of indicators work? well know that I also asked myself the same questions when I first started trading. After testing many indicators, I realized that winning trading is simple and accurate trading. after several months of thinking and optimizing I was able to find my solution: Candle Good Setup Candle Good setup is a trend and entry timing indicator analyzing the market in multi-frame to give

The indicator determines the state of the market: trend or flat.
The state of the market is determined by taking into account volatility.
The flat (trading corridor)is displayed in yellow.
The green color shows the upward trend.
The red color shows the downward trend.
The height of the label corresponds to the volatility in the market.
The indicator does not redraw .
Settings History_Size - the amount of history for calculation.
Period_Candles - the number of candles to calculate the indicat

The indicator plots flexible support and resistance levels (dots). A special phase of movement is used for construction. Levels are formed dynamically, that is, each new candle can continue the level or complete it.
The level can provide resistance or support to the price even where it is no longer there. Also, support and resistance levels can change roles. The importance of levels is affected by: the amount of time the level is formed and the number of touches.
The significance of these lev

The indicator is a trading system for short-term trading.
Scalper Assistant helps to determine the direction of the transaction, and also shows the entry and exit points.
The indicator draws two lines (possible points for opening positions).
At the moment of the breakdown of the upper line up (and when all trading conditions are met), an up arrow appears (a buy signal), as well as 2 goals.
At the moment of the breakdown of the lower line down (and when all trading conditions are met), a down ar

Infinity'nin para birimlerinin gücünü ölçen bu yenilikçi gösterge, scalper'lar ve uzun vadeli ticaret yapan tüccarlar için vazgeçilmez bir yardımcıdır. Para birimlerinin Güç / zayıflık analiz sistemi uzun zamandır bilinmektedir ve dünyanın önde gelen tüccarları tarafından piyasada kullanılmaktadır. Herhangi bir arbitraj ticareti bu analiz olmadan tamamlanamaz. Göstergemiz, temel para birimlerinin birbirine göre gücünü kolayca belirler. Tüm para birimlerinde veya mevcut para birimlerinde çizgi g
QXSTREND Our "Support and Resistance" indicator shows the support and resistance levels using the ADX indicator, and create an arrow based on three ADX Periods on different levels.
Recommended TIMEFRAMES:- M15,M30 and H4 (For Long Term Target) 120 pips & Approximately M5 (For 30 Pips target) ENTRY SIGNALS:- You need to take trade based on Arrows if Green Arrow occurs then you need to buy if Magenta Down Arrow occurs then sell trade.
About QuantXsystem Products: – Simple installation &
The stocks that make up the index are one of the drivers of the movement. Analyzing the financial performance of all elements of the index, we can assume further development of the situation. The program (script) displays corporate reports of shares that are part of the index selected in the settings.
"Indexes" cannot be tested in the tester (since there is no way to get information from the Internet).
Information is downloaded from the site investing.com: Report Date Earnings per share (E
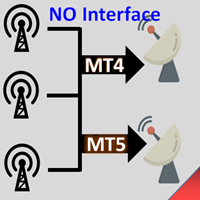
Interfaceless documentary EA. It has been operating stably and efficiently for more than 5 years, and has accumulated many customers. Copier Advanced Version (On sale) Copier-MT4-FULL(click to download) Copier-MT5-FULL(click to download) MT4->DEMO Try(click to download) MT5->DEMO Try(click to download) Copier Interface Version Copier-MT4-FULL(click to download) Copier-MT5-FULL(click to download) MT4->DEMO Try(click to download) MT5->DEMO Try(click to download) Copier No Interface Version Copier

Sniper Extended EA uses short-term trading - night scalping, not using martingale. Indicators used: ATR, RSI, Stochastic, CCI, WPR, DeMarker, RVI. Each indicator can be used optionally on/off. The strategy of the adviser is based on an assessment of the strength of the trend and the finding of correction / reversal points; it compares the absolute values of the rise and fall of the market over a certain time period. Filters are used for news, delay, spread expansion, increased volatility, slipp

In the current version this filter will only work with my night scalpers and the EA Profitection Filter or with other EAs that utilize the global variables set by this EA. An MT4 version is availalble here . Many scalpers these days have a "normal" news filter, which filters calendar news such as interest rate decisions or CPI releases. However, this breaking news filter is able to filter non-standard breaking news. It will check every minute for news and if it finds a news event, it will
MetaTrader mağazası - yatırımcılar için alım-satım robotları ve teknik göstergeler doğrudan işlem terminalinde mevcuttur.
MQL5.community ödeme sistemi, MetaTrader hizmetlerindeki işlemler için MQL5.com sitesinin tüm kayıtlı kullanıcıları tarafından kullanılabilir. WebMoney, PayPal veya banka kartı kullanarak para yatırabilir ve çekebilirsiniz.
Alım-satım fırsatlarını kaçırıyorsunuz:
- Ücretsiz alım-satım uygulamaları
- İşlem kopyalama için 8.000'den fazla sinyal
- Finansal piyasaları keşfetmek için ekonomik haberler
Kayıt
Giriş yap
Gizlilik ve Veri Koruma Politikasını ve MQL5.com Kullanım Şartlarını kabul edersiniz
Hesabınız yoksa, lütfen kaydolun
MQL5.com web sitesine giriş yapmak için çerezlerin kullanımına izin vermelisiniz.
Lütfen tarayıcınızda gerekli ayarı etkinleştirin, aksi takdirde giriş yapamazsınız.