Guarda i video tutorial del Market su YouTube
Come acquistare un Robot di Trading o un indicatore
Esegui il tuo EA
hosting virtuale
hosting virtuale
Prova un indicatore/robot di trading prima di acquistarlo
Vuoi guadagnare nel Market?
Come presentare un prodotto per venderlo con successo
Indicatori tecnici a pagamento per MetaTrader 5 - 10

Il nostro indicatore Basic Support and Resistance è la soluzione necessaria per aumentare l'analisi tecnica.Questo indicatore consente di proiettare i livelli di supporto e resistenza sul grafico/ MT4 gratuita
Funzionalità
Integrazione dei livelli di Fibonacci: Con la possibilità di visualizzare i livelli di Fibonacci insieme a livelli di supporto e resistenza, il nostro indicatore ti dà una visione ancora più profonda del comportamento del mercato e delle possibili aree di inversione.
Ot
** All Symbols x All Timeframes scan just by pressing scanner button ** ***Contact me to send you instruction and add you in "RSI scanner group" for sharing or seeing experiences with other users. Introduction RSI divergence is a main technique used to determine trend reversing when it’s time to sell or buy because prices are likely to drop or pick in the charts. The RSI Divergence indicator can help you locate the top and bottom of the market. This indicator finds Regular divergence for pullba

[ How to use the Demo version ] [ MT4 Version ] AO unpaid divergences MT5 AO unpaid divergences is the first indicator developed to detailed analyze Regular and Hidden Divergences. It uses this analysis to find out possible entry points and targets. Below some of the characteristics of this indicator: Time saving Highly customizable Working for all pairs (Crypto, Forex, Stocks, Indices, Commodities...) Suitable for Scalping or Swing trading Possible reversal swings Alerts and Notifications on M
FOTSI – Indice di Vera Forza Forex Scopri la vera forza di ogni valuta e opera con vantaggio. Il Indicatore FOTSI è un oscillatore multi-valuta che misura il momentum reale di ogni valuta principale (USD, EUR, GBP, JPY, CHF, AUD, CAD, NZD) su tutte le coppie. Invece di analizzare un singolo grafico, FOTSI combina i dati di più coppie, smussa i movimenti e applica l’algoritmo True Strength Index (TSI) per offrirti una visione chiara, stabile e senza ritardi della forza relativa di ogni valuta. Ca

L'indicatore serve a disegnare canali orizzontali e zone di segnale, rilevare rotture di estremi, rimbalzi e obiettivi su livelli di Fibonacci personalizzabili, con o senza alert sonori. Applica automaticamente i livelli di Fibonacci scelti a tali estremi. Quando il prezzo rompe i livelli di Fibonacci attivati nelle impostazioni, l'indicatore può emettere un suono, mostrare un messaggio, inviare una notifica push al terminale mobile o un'email (se attivato).
Possibilità: costruzione automatica

Price Volume Distribution
Indicatore Volume Profile che analizza la distribuzione del volume di trading per livello di prezzo. Visualizza POC, Value Area, picchi di volume e filtraggio segnali basato su zone per MT5.
Panoramica
Price Volume Distribution e un indicatore di analisi del volume per MetaTrader 5. Calcola e visualizza la distribuzione del volume sui livelli di prezzo utilizzando dati del timeframe M1, fornendo rappresentazione visiva tramite barre istogramma e linee di riferimento.

This indicator searches for candlestick patterns. Its operation principle is based on Candlestick Charting Explained: Timeless Techniques for Trading Stocks and Futures by Gregory L. Morris. If a pattern is detected, the indicator displays a message at a bar closure. If you trade using the MetaTrader 4 terminal, then you can download the full analogue of the " Candle Pattern Finder for MT4 " indicator
It recognizes the following patterns: Bullish/Bearish (possible settings in brackets) : Hammer

L' Indicatore Volume Bar POC è uno strumento innovativo che offre una visualizzazione precisa dei livelli di prezzo chiave (Point of Control, POC) basati sul volume tick. Questo indicatore analizza ogni punto di prezzo all'interno delle singole candele e mostra i livelli più significativi, che possono essere utilizzati come zone di supporto e resistenza. Ideale per strategie di trading intraday e di lungo periodo. Come funziona l'Indicatore Volume Bar POC? L'indicatore utilizza un processo ava
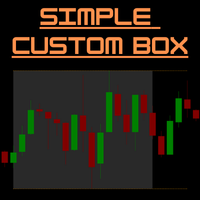
SimpleCustomBox – Indicatore MT5 per Box di Sessione e Linee di Massimo/Minimo Panoramica:
SimpleCustomBox è un indicatore potente e facile da usare per MetaTrader 5 che ti consente di evidenziare visivamente specifiche sessioni di trading sul grafico.
Definisci intervalli di tempo personalizzati, visualizza immediatamente i massimi e i minimi della sessione e prendi decisioni di trading più intelligenti grazie a confini visivi chiari.
Perfetto per day trader, scalper e per chi opera con patter
Mean Reversion Probability – Indicatore di Reversione Statistica Descrizione breve
Indicatore istituzionale che calcola la probabilità statistica di un ritorno alla media mobile 200, basato sull’analisi delle sovra-estensioni storiche. Identifica con precisione quantitativa le zone di affaticamento del mercato. Caratteristiche principali
Analisi statistica avanzata – Costruisce un database di oltre 500 estensioni storiche per calcolare probabilità reali
Punteggio di probabilità 0–99% – Quantif

Advanced Indicator Scanner is a multi-symbol multi-timeframe scanner that works with hundreds of custom indicators available across the web including mql5 website market and codebase indicators.
Advanced Indicator Scanner features:
Scans your indicator in 28 customizable instruments and 9 timeframes. Monitors up to 2 lines(buffers) of an indicator. Showing of indicator value on buttons. You can choose between 3 alert modes: Single symbol and timeframe Multiple timeframes of a symbol Multiple

Taking orders, now on MT5 the TPX Dash Needle is everything you need to find the famous Didi Needles on several timeframes and in several pairs at the same time. These are the simultaneous meeting of the 3, 8 and 20 averages that, aligned with the ADX indicator, are synonymous with large and strong movements in the market. Now with the new Heiken Aish filter, the name of the pair shows the direction of the Heiken Aish you choose, it can be weekly or daily, all signals will appear on the screen,

The Breakout Box for MT5 is a (opening) range breakout Indicator with freely adjustable: - time ranges - end of drawing time - take profit levels by percent of the range size - colors - font sizes It can not only display the range of the current day, but also for any number of days past. It can be used for any instrument. It displays the range size and by request the range levels and the levels of the take profit niveaus too. By request it shows a countdown with time to finish range. The indic
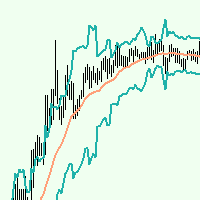
Ara Channel это канальный индикатор призван помогать определять вероятные точки разворота цены. Будет полезен трейдерам торгующим как в тренд так и в контртренд. Сигналы индикатора могут служить как полностью самостоятельными для торговли , так и как дополнительными , подтверждающими. Индикатор имеет всего две настройки: Period_MA это обычная скользящая средняя рекомендуемые значения от 8 до 480, Period_Channel это период для расчёта границ динамического канала. Преимущества : не перерисовывает

TickFlow is a tool for tick-data analysis and visual highlighting of significant zones on the chart. The utility aggregates current and historical ticks, shows the buy/sell balance, and helps to identify support/resistance levels and cluster zones. This is the MetaTrader 4 version. How it works (brief) TickFlow collects tick data and aggregates it by price steps and candles. Based on the collected data the indicator builds visual layers: up/down tick counters, buy/sell ratio, historical levels

Mean Reversion Supply Demand Indicator Mean Reversion Supply Demand is the indicator to detect the important supply demand zone in your chart. The concept of supply demand trading relies on the quantity mismatching between buying and selling volumes in the financial market. Typically, supply demand zone serves to predict the turning point. The wave pattern, for any supply demand zone to work as an successful trade, looks like the price must touch the base zone, move away and then return to zone
This indicator is the mql5 version of the SSLHybrid indicator. MT4 Version Find out more here: https://www.mql5.com/en/users/rashedsamir/seller
Description of TradingView version: This script is designed for the NNFX Method, so it is recommended for Daily charts only.
Tried to implement a few VP NNFX Rules
This script has a SSL / Baseline (you can choose between the SSL or MA), a secondary SSL for continiuation trades and a third SSL for exit trades.
Alerts added for Baseline entries, SSL
Engulfing Zone Sniper MT5 — Multi-Timeframe Signal & Zone Indicator The Engulfing Zone Sniper MT5 is a technical analysis tool designed to highlight engulfing candlestick patterns in combination with adaptive support/resistance zones. It provides visual markers and optional alerts to assist traders in identifying market structure reactions across multiple timeframes. Key Features Multi-Timeframe Detection – Option to scan higher timeframe engulfing setups with lower timeframe confirmation. Su
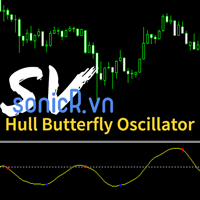
The Hull Butterfly Oscillator (HBO) is an oscillator constructed from the difference between a regular Hull Moving Average ( HMA ) and another with coefficients flipped horizontally . Levels are obtained from cumulative means of the absolute value of the oscillator. These are used to return dots indicating potential reversal points . This indicator draw line in separate window, plus blue dot (for buy signal) when hull oscillator is peak and red when sell signal. It also includes integrate

FRONTIER PIVOTS - Geometric Levels Indicator This indicator plots support and resistance levels/ranges on the chart using mathematical calculations. It helps traders identify potential price reaction zones based on geometric patterns. Main Features: Automatically calculates and displays key price levels Plots both support and resistance lines Uses daily price data for level calculation Clean visual presentation with different colors for different level types No repainting - levels remain static

SMC Precision AI Unlock the edge of institutional trading with SMC Precision AI – an advanced AI-powered Smart Money Concept (SMC) based FIBO Retrenchment indicator built for serious traders who want precision, clarity, and high-probability trade setups.
Key Features It Plots Fibo Retrenchment Zones.
AI-Powered Signals – Enhanced by real-time AI logic to adapt to changing market conditions with Reasonable accuracy
Signal Clarity – It Draws Fibo Bands- When the Lower Line Is drawn it indicat

The purpose of Impulse Release is to prevent trading in the wrong direction. While the Impulse System operates in a single timeframe, Impulse Release is based on two timeframes. It tracks both the longer and the shorter timeframes to find when the Impulse points in the same direction on both. Its color bar flashes several signals: If one timeframe is in a buy mode and the other in a sell mode, the signal is "No Trade Allowed", a black bar. If both are neutral, then any trades are allowed, showi
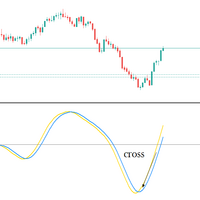
Big promotion on the Robos, Get yours now Robos Indicator The ROBOS indicator is a multi timeframe oscillator that targets the overbought and oversold regions of a price chart, a signal is indicated by the two lines crossing, compatible with all tradable instruments
Latest Release
The latest release is the version 4.0
#What's new in version 4.0 ?
Features
Extreme oversold and overbought levels
ROBOS version 4.0 comes with cool new feature , the ability to target only extrem

FX Correlation Matrix is a powerful multi-timeframe dashboard that helps traders analyze real-time currency correlations of up to 28 symbols at a glance. With customizable settings, sleek design, and manual symbol selection option, it enhances trade accuracy, reduces risk, and identifies profitable correlation-based opportunities. Setup & Guide: Download MT4 Version here. Follow our MQL5 channel for daily market insights, chart, indicator updates and offers! Join here.
Read the product des

AI Adaptive Market Holographic System Indicator Based on Microstructure and Field Theory Abstract: This paper aims to explore the construction principles and implementation mechanism of a novel financial market analysis tool—the Micro gravity regression AIselfregulation system. This system fuses Market Microstructure theory, classical mechanics (elasticity and gravity models), information entropy theory, and adaptive AI algorithms. By aggregating Tick-level data in real-time, physically modeling
[ MT4 Version ] Order Block Indicator MT5 — Precision Trading Made Simple
Order Block Indicator MT5 is designed to help traders spot powerful reversal zones effortlessly — without cluttered charts or guesswork.
Built for scalping , swing trading , and smart intraday decisions , it highlights active order blocks across multiple timeframes with precision, speed, and full customization. Trade with clarity, save valuable time, and react instantly to market structure changes — even across Forex

Uno dei pochi indicatori che calcola i livelli esclusivamente in base al prezzo. L’indicatore non è influenzato dai timeframe, dai trend o dai cicli di mercato. Uno degli indicatori più logici mai creati. L’indicatore FIFTY è ora disponibile in una versione automatica, che elimina la necessità di tracciare manualmente i livelli. Questa versione disegna automaticamente sul grafico i livelli giornalieri, settimanali, mensili e annuali, garantendo precisione e risparmio di tempo. Inoltre, sono pres

“Naturu” è un indicatore manuale che utilizza la simmetria della natura come algoritmo.
Conquista il mercato con una strategia semplice e saggezza nascosta! Quando carichi l’indicatore, vedrai due linee: Top e Bottom.
Clicca una volta su una linea per attivarla. Per spostarla, basta cliccare sulla candela dove vuoi posizionarla. Definisci un punto alto e un punto basso, e l’indicatore calcola automaticamente: Una zona magenta che mostra dove gli interessi di tori e orsi sono più vicini, ossia l

Rivelare le Visioni del Trading con Auto Anchored VWAPs: Auto Anchored VWAPs sono la tua guida nel mondo del trading. Questi indicatori individuano i punti cruciali di inversione del mercato e li illustrano sul tuo grafico utilizzando le linee VWAP. Questo rappresenta un cambiamento epocale per i trader che utilizzano strategie ancorate alle VWAP. Come Funziona? Identificazione dei Punti Altai: Se il prezzo più alto della candela corrente è inferiore al prezzo più alto della candela precedente,

Auto Optimized RSI è un indicatore a freccia intelligente e facile da usare, progettato per fornire segnali di acquisto e vendita precisi. Utilizza simulazioni di trading su dati storici per individuare automaticamente i livelli RSI più efficaci per ogni strumento e timeframe. Questo indicatore può essere utilizzato come sistema di trading autonomo o integrato nella tua strategia esistente, ed è particolarmente utile per i trader a breve termine. A differenza dei livelli fissi tradizionali del

This indicator provides the ability to recognize the SMC pattern, essentially a condensed version of the Wyckoff model. Once the pattern is confirmed by RTO, it represents a significant investment opportunity. There are numerous indicators related to SMC beyond the market, but this is the first indicator to leverage patterns to identify specific actions of BigBoy to navigate the market. The SMC (Smart Money Concept) pattern is a market analysis method used to understand the behavior of "smart
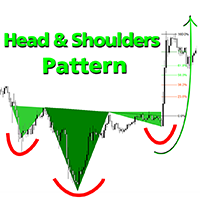
Prezzo di benvenuto: 35 $ Il modello Testa e Spalle è ideale per i trader che cercano un riconoscimento affidabile dei modelli, includendo formazioni rialziste e ribassiste di Testa e Spalle, con livelli di Fibonacci integrati, rilevamento della rottura del neckline e tecniche di previsione anticipata. Uno strumento MT5 potente per chi apprezza l'analisi tecnica e la precisione nell'identificare strutture grafiche e inversioni di tendenza. Metodi di Rilevamento Doppio Metodo 1 - Rilevamento

Synthetic Reverse Bar is an evolution of Reverse Bar indicator. It is well-known that candlestick patterns work best at higher timeframes (H1, H4). However, candlesticks at such timeframes may form differently at different brokers due to dissimilarities in the terminal time on the single symbol, while the history of quotes on M1 and M5 remains the same! As a result, successful patterns are often not formed at higher timeframes! Synthetic Reverse Bar solves that problem! The indicator works on M5

Contact me to send you instruction and add you in group.
QM (Quasimodo) Pattern is based on Read The Market(RTM) concepts. The purpose of this model is to face the big players of the market (financial institutions and banks), As you know in financial markets, big traders try to fool small traders, but RTM prevent traders from getting trapped. This style is formed in terms of price candles and presented according to market supply and demand areas and no price oscillator is used in it. RTM conc

MarketCrack – Whale Detector: Allineati con il Denaro Intelligente MarketCrack – Whale Detector è un indicatore professionale progettato per rilevare visivamente e in anticipo l'attività dei grandi partecipanti al mercato, noti come "balene". Il suo scopo è identificare i momenti chiave di significativa pressione istituzionale, consentendo al trader di allinearsi con la direzione del denaro intelligente e prendere decisioni strategiche con maggiore fiducia. Funzionalità e Obiettivo MarketCrack –
Bande di Machine Learning VWAP: Il Vantaggio Predittivo per i Trader Sblocca il livello successivo dell'analisi di mercato con le Bande di Machine Learning VWAP – un innovativo indicatore MQL5 progettato per fornire intuizioni impareggiabili sulle tendenze di mercato, le zone dinamiche di supporto/resistenza e i segnali di trading ad alta probabilità. Sfruttando un algoritmo proprietario di apprendimento automatico adattivo integrato con la potenza del Volume Weighted Average Price (VWAP), quest

Questo indicatore è un predittore di direzione del trend semplice ma estremamente affidabile, pensato per i trader che preferiscono segnali puliti e accurati. Caratteristiche principali Frecce di previsione del trend – segnali Buy/Sell basati sull’azione del prezzo. Pochi segnali, ma molto accurati – circa 1 al giorno. Segnali di uscita integrati – frecce Exit per chiudere al momento ideale. Nessun repainting – le frecce non cambiano mai. Include buffer – perfetto per strumenti personalizzati o

VeMAs è uno strumento di trading innovativo progettato per migliorare la vostra strategia di trading analizzando le dinamiche dei volumi e la struttura del mercato. Che siate principianti o trader esperti, VeMAs vi offre un vantaggio. L'indicatore VeMAs è disponibile a soli 50 dollari. Il prezzo originale dell'indicatore è di 299 dollari.
OFFERTA A TEMPO LIMITATO. Version MT4
Here are some blogs on the VeMAs indicator
Il volume e la struttura del mercato sono alcuni dei principali elementi da

This is advanced Multi-Symbol and Multi-Timeframe version of the "Candle Pattern Finder" indicator (search for candlestick patterns based on the book by Gregory L. Morris "Candlesticks charting explained. Timeless techniques for trading stocks and futures" ). The indicator searches for candlestick patterns for ALL symbols of the "Market Watch" window and for ALL standard timeframes from M1 to MN1. When patterns appear on any symbol / timeframe, the indicator gives a signal (text, sound, sending

VM SuperAshi Trend Precision Trend Sniper using Smoothed Heiken Ashi, Supertrend and EMA Trend
Optimized for M1–M5 Scalping
Overview VM SuperAshi Trend is an indicator that combines a standardized Supertrend with smoothed Heiken-Ashi candles to deliver clear, confirmed, and non-repainting buy/sell signals directly on the chart. It automatically draws Buy/Sell arrows, displays Fast, Slow, and Trend EMA lines, and provides Popup, Email, and Push notifications.
Key Features Supertrend-based signal

Session Finder – Track Forex Market Sessions with Precision
Stay ahead of the market with Session Finder , a sleek HUB style design for MetaTrader 5. It provides real-time visibility into the world’s major trading sessions—Sydney, Tokyo, London, and New York—so you always know which markets are open, closed, or about to change. Key Features: Live Session Status: See whether a session is currently open or closed at a glance. Countdown Timers: Track exactly how long until a session opens or close

Sfrutta il Potenziale delle Tue Operazioni con l'Indicatore AlphaWave! Porta Serenità alle Tue Operazioni: L'Indicatore AlphaWave è progettato per portare calma alle tue operazioni, levigando il grafico e offrendo una lettura precisa della direzione del trend. Prendere decisioni di trading chiare non è mai stato così facile. Tecnologia di Levigatura Rivoluzionaria con 10 Modalità: Scopri una presentazione fluida e chiara del grafico con l'Indicatore AlphaWave. La tecnologia rivoluzionaria di lev

A useful and convenient tool for traders when analyzing and making decisions.
Peculiarity
The main feature of this indicator is its fast algorithm . The gain in the speed of calculating the polynomial and its value of the standard deviation in comparison with classical algorithms reaches several thousand times. Also, this indicator includes a Strategy Tester with a clear visualization of transactions, an equity chart and simultaneous calculation and display of the following data in the form of
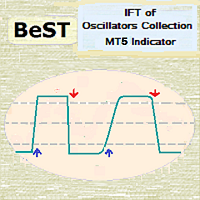
BeST_IFT of Oscillators Collection is a Composite MT4/5 Indicator that is based on the IFT ( Inverse Fisher Transformation ) applied to RSI , CCI , Stochastic and DeMarker Oscillators in order to find the best Entry and Exit points while using these Oscillators in our trading. The IFT was first used by John Ehlers to help clearly define the trigger points while using for this any common Oscillator ( TASC – May 2004 ). All Buy and Sell Signals are derived by the Indicator’s crossings of the Bu
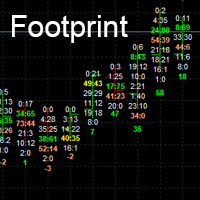
Footprint charts can add a level of depth to your visuals that standard charts cannot achieve.
Footprint charts are a powerful way to visualize the ups and downs of the market, helping you potentially to make better trading decisions. Orderflow Footprint in MT5. show # of market orders at each tick.
Inputs
Point Scale *1 to *10000
Number of candle to show. Font Size Max Bid Color (Top Seller) Max Ask Color (Top Buyer) Max Bid and Ask Color
Normal color

MonsterDash Harmonics Indicator is a harmonic pattern dashboard. It recognizes all major patterns. MonsterDash is a dashboard that displays all detected patterns for all symbols and (almost) all timeframes in sortable and scrollable format. Users can add their own user defined patterns . MonsterDash can open and update charts with the pattern found.
Settings MonsterDash's default settings are good enough most of the time. Feel free to fine tune them to your needs. The color settings are for tho

The indicator is designed for easy construction of synthetic charts based on data of various financial instruments. It will be useful both arbitrage and pair trading, as well as for analysis purposes. Its main advantage is simplicity and clarity. Each chart is given as a common mathematical formula. For example, if you want to plot the spread (difference) between EURUSD and GBPUSD with coefficients 4 and 3, then set the following formula: EURUSD * 4 - GBPUSD * 3 The resulting chart is shown in t

Contesto Anni fa sono arrivato su questo sito in cerca di un indicatore per le opzioni binarie. Come molti principianti, ero tanto sicuro quanto ingenuo: pensavo di trovare il “Santo Graal” che mi avrebbe fatto guadagnare ogni giorno seguendo le frecce sullo schermo. Ho provato centinaia di indicatori, a pagamento e gratuiti. Nessuno ha dato risultati stabili. Col tempo sono tornato qui — non più da novizio, ma come qualcuno che ha percorso tutta la strada: alti e bassi, euforia e frustrazione —

L'indicatore Market Steps è progettato e costruito sulla base delle correlazioni tempo/prezzo di Gann e ottimizzato da regole di Price Action specifiche per il mercato Forex. Utilizza i concetti del flusso degli ordini di mercato per prevedere le potenziali zone di prezzo per un alto volume di ordini.
Indicator Levels può essere usato per il trading da solo o come combinazione per filtrare i segnali sbagliati di altre strategie/indicatori. Ogni trader ha bisogno di uno strumento così potente
KT Trend Reversal Probability calcola in tempo reale la probabilità di un'inversione di tendenza utilizzando un algoritmo avanzato basato sull’RSI. Mostrata come una percentuale chiara, questa probabilità ti aiuta a capire se una tendenza in corso sta perdendo forza o se è probabile che se ne stia formando una nuova. Che tu stia pianificando un’entrata o stringendo una posizione in uscita, questo indicatore ti offre un vantaggio basato sui dati nelle decisioni di trading.
Funzionalità
Mostra u

In the "Masters of Risk" trading system, one of the main concepts is related to places where markets change direction. In fact, this is a change in priority and a violation of the trend structure at the extremes of the market, where supposedly there are or would be stop-losses of "smart" participants who are outside the boundaries of the accumulation of volume. For this reason, we call them "Reversal Patterns" —places with a lot of weight for the start of a new and strong trend. The important ad

Struggling with false breakouts and poor timing on Gold? Because most indicators generate random arrows and lag behind the real market structure. This tool provides clear Visual Signals with automated SL/TP projections based on volatility alignment. Key Features: Market State Engine: Continuously analyzes volatility to classify the market into Compression, Trap, Building, or Expansion phases. Automated SL/TP Projection: Dynamically calculates precise Stop Loss and Take Profit levels using ATR di
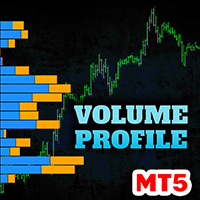
Contact me after payment to send you the user manual PDF file. Download the MT4 version here. Volume Profile Indicator A functional and useful tool that can improve your trading plan.
This indicator calculates volume in price levels(typical volume indicator shows only candle volumes).
With the volume of price levels, you can identify important areas that have the potential to reverse. You can also see the volume of support and resistance levels and decide on them.
Using volume profiles along

Gold Master Indicator MT5 Professional Gold Signal System This advanced indicator has been designed and optimized specifically for Gold (XAU) trading, utilizing a technical confluence approach : trend, momentum, volume, market structure (S/R), and multi-timeframe validation. It is the ideal tool for traders who prioritize signal quality and operational noise reduction over the sheer quantity of entries. 1. Functional Overview The system detects high-probability buy and sell opportunities in XAU

Buyer Seller Balance Analyzer offre una panoramica completa della forza di acquirenti e venditori su diversi timeframe. Componenti principali: Tabella Buyer/Seller Balance Mostra il rapporto tra acquirenti e venditori Copre i timeframe da M1 a MN1 Valori codificati a colori (verde = acquirenti, rosso = venditori) Metriche chiave: Buyers (%) – Percentuale di acquirenti Sellers (%) – Percentuale di venditori ️ Balance – Differenza tra acquirenti e venditori Strength –
Williams Fr actals (v 2 ) — segnali più puliti , meno rum ore Indicatore ott im izzato : seg na mass imi /minimi confermati , cal cola solo su nuove c ande le e filtra con ATR e log ica di cluster. P unti chi ave Ottim izzato : calcolo su nuove candele ; r icalcolo completo solo se serve Frec ce pulite : colore , dimension e e spazio regol abili Fil tri (opz .) : sp azi atura ATR e scelta del fractal più forte nel cluster Multi ‑TF : timeframe corrente
ICONIC TITAN SIGNAL v1.6
“Don’t trade like the crowd – trade like a legend.”
The ICONIC TITAN SIGNAL is more than just an indicator. It’s your personal mentor. Your scanner. Your signal provider. A hybrid masterpiece of market experience, mathematical logic, and institutional precision – crafted for those who aim not just to trade, but to dominate.
What does the ICONIC TITAN do?
It filters 24/7 through the chaos of the four most relevant markets in the world:
XAUUSD
EURUSD
BTCUSD
NAS100

Segnali di trading con precisione del 98% Entrate precise, uscite chiare | Multi-timeframe | Tutti i mercati
Come funziona in 3 semplici passaggi 1️⃣ INGRESSO OPERAZIONI (Regole Acquisto/Vendita) Innesco del segnale: Due linee (X) si incrociano al di fuori della zona colorata (rossa per acquisto/blu per vendita).
Conferma: La candela del prezzo deve toccare l'incrocio (durante o entro 1-5 candele successive).
Ingresso alternativo (No Touch):
Segnale di vendita (Zona blu): Il prezzo rimane so

The indicator is stable on noise fluctuations in price and quickly reacts to the trend. It is based on an algorithm from a system of hyperbolic functions that allows you to aggressively smooth the flat with minimal lag on the trend. It can be applied directly to the price chart, to itself, or to other indicators in order to eliminate false signals. The main purpose of the indicator is to smooth out small sawtooth price movements as much as possible. The higher the Hyperbolic parameter, the stron

The Gann Box (or Gann Square) is a market analysis method based on the "Mathematical formula for market predictions" article by W.D. Gann. This indicator can plot three models of Squares: 90, 52(104), 144. There are six variants of grids and two variants of arcs. You can plot multiple squares on one chart simultaneously
Parameters Square — selection of a Gann square model: 90 — square of 90 (or square of nine); 52 (104) — square of 52 (or 104); 144 — universal square of 144; 144 (full) — "full
BUY INDICATOR AND GET A PIVOT POINT EA FOR FREE AS A BONUS + SOME OTHER GIFTS! Attention, the MT5 version of this application does not work on strategy tester, only on live accounts or demo accounts on live market. If you need an MT5 demo version of the Indicator send me a private message here: https://www.mql5.com/en/users/italobr ITALO PIVOTS INDICATOR is the best pivot point indicator for strong price reversals and continuations of price movements ever created, and why is that? You

BUY INDICATOR AND GET EA FOR FREE AS A BONUS + SOME OTHER GIFTS! ITALO TREND INDICATOR is the best trend indicator on the market, the Indicator works on all time-frames and assets, indicator built after 7 years of experience on forex and many other markets. You know many trend indicators around the internet are not complete, does not help, and it's difficult to trade, but the Italo Trend Indicator is different , the Italo Trend Indicator shows the signal to buy or sell, to confirm the signal t

Volume Footprint Analysis is a precision-engineered, volume-based indicator that transforms raw market volume into an intuitive, color-coded signal system. Built on concepts from Volume Spread Analysis (VSA) and Smart Money principles, this tool removes the guesswork from volume interpretation and gives traders clear, actionable insights on when to buy or sell — on any timeframe and across any trading instrument. MT4 Version - https://www.mql5.com/en/market/product/138564/ Join To Learn Mark

The indicator displays volume clusters or volume profiles to choose from. For trading symbols which contain the tape of deals, the indicator can perform calculations based on the tape of deals.
Input variables
StepPoint - cluster step in points, if the value is zero, the step is assigned automatically. HistoryTicks - size of tick history (for VolumeType in the mode TimeAndSales). AssociatedTimeframe - binding the indicator to the specified timeframe of the chart, if the value is equal to Cu

Un indicatore di scalping professionale multi-timeframe con avvisi mobili in tempo reale, zone intelligenti di acquisto/vendita e statistiche giornaliere dei segnali. Progettato per day trader e scalper che richiedono precisione. Panoramica Questo indicatore è pensato per day trader e scalper che puntano su precisione, velocità e chiarezza. Combina l’analisi multi-timeframe con un filtraggio intelligente dei segnali per offrire opportunità di trading ad alta probabilità. Con avvisi in tempo real

CDV Candle Engine Pro is a MetaTrader 5 indicator designed to visualize Cumulative Delta Volume (CDV) directly on the price chart. It helps traders read market pressure more clearly by showing the balance between buying and selling activity in a clean, customizable layout. If you trade on MetaTrader 4, the MT4 edition is available here: CDV Candle Engine Pro MT4 Public channel: CLICK HERE
Main Features CDV candle visualization on the main chart for easy reading in real time. Optional subwind

Immagina: sei sull'orlo di enormi profitti, ma il mercato cambia improvvisamente e perdi l'occasione. O peggio, invece di profitti, ottieni perdite. E se avessi un alleato affidabile che sussurra in anticipo: "preparati – le onde stanno arrivando!"? Incontra Harbinger , un indicatore rivoluzionario per MetaTrader 5 appositamente progettato per i trader che sono stanchi del caos e vogliono anticipare i cambiamenti del mercato! Harbinger è un algoritmo intelligente che analizza i modelli nascosti

Heiken Ashi Smoothed – The Ultimate Trend Filtering Indicator for MT5 Enhance Your Trading with Smoother Trends! The Heiken Ashi Smoothed indicator is a powerful tool designed for traders who want clearer trend signals while eliminating market noise. Unlike traditional Heiken Ashi candles, this smoothed version provides fluid, lag-free price action , making it perfect for swing trading, trend following, and long-term analysis. Key Features: Crystal-Clear Trends – Filters out market noise for

The Volume+ and VSA Signals indicator for MT5 is based on the Volume Spread Analysis (VSA) methodology to provide the signals. The signals are displayed at closing of bars on the main window or subwindow in the form of symbols. The symbols are not repainting. The indicator produces a signal on an individual bar and this signal is not buy or sell signal. When a minor trend goes in the opposite direction of a major trend, there are sequences of major trend-following signals that give a higher pro

VISUAL ATR CANDLESTICK SCANNER PRO - Riconoscimento di Pattern Migliorato Il Visual ATR Candlestick Scanner Pro è un indicatore progettato per identificare e filtrare automaticamente i comuni pattern di candele, fornendo una visione più chiara di potenziali inversioni o continuazioni del mercato. I. Caratteristiche Principali e Funzionalità 1. Riconoscimento Automatico dei Pattern di Candele L'indicatore riconosce automaticamente oltre 25 pattern di candele professionali, classificati in gruppi
Il MetaTrader Market offre un luogo pratico e sicuro dove acquistare applicazioni per la piattaforma MetaTrader. Scarica versioni demo gratuite di Expert Advisors e indicatori direttamente dal tuo terminale e testali nello Strategy Tester.
Prova le applicazioni in diverse modalità per monitorare le prestazioni ed effettuare pagamenti per i prodotti desiderati, utilizzando il sistema di pagamento MQL5.community.
Ti stai perdendo delle opportunità di trading:
- App di trading gratuite
- Oltre 8.000 segnali per il copy trading
- Notizie economiche per esplorare i mercati finanziari
Registrazione
Accedi
Se non hai un account, registrati
Consenti l'uso dei cookie per accedere al sito MQL5.com.
Abilita le impostazioni necessarie nel browser, altrimenti non sarà possibile accedere.