Conor Mcnamara / Profil
- Informations
|
1 année
expérience
|
6
produits
|
5
versions de démo
|
|
0
offres d’emploi
|
0
signaux
|
0
les abonnés
|
I started learning C programming in 2010. From there I picked up many languages.
I have worked with MQL for just a year now. I pick up programming languages very quickly because I'm no stranger to programming.
I'm working on several indicator projects and EA concepts.
I have worked with MQL for just a year now. I pick up programming languages very quickly because I'm no stranger to programming.
I'm working on several indicator projects and EA concepts.
Conor Mcnamara


Rajesh Kumar Nait
2025.05.13
Ireland
Conor Mcnamara
2025.05.13
Aye
Conor Mcnamara
produit partagé
Download it now and give it a try. Let me know if it is something that works for you. In the upcoming release, there can be an option to load your own moving average, or even another indicator. The beta is about highlighting the zigzag process itself and not the SMA which it takes information from. It should provide increased clarity with market structure compared to a bare moving average plot, as moving averages normally repaint up and down on the current unclosed bar. Using a backstep of 1 is more suitable for entry signals or automation, and using a higher backstep is more suited for wave analysis
MagZag ( Beta) — A Trend- Based Reinvention of the ZigZag MagZag is a complete remodel of the traditional ZigZag indicator, built on trend- based logic instead of reactive price confirmation. Unlike a traditional ZigZag that works off of price action and relies on future bars to confirm a swing, MagZag calculates new legs immediately — with no forward correction , no lag , and no repainting . Once a leg is drawn, it's final. MagZag includes parameters for deviation and backstep, but it
Conor Mcnamara
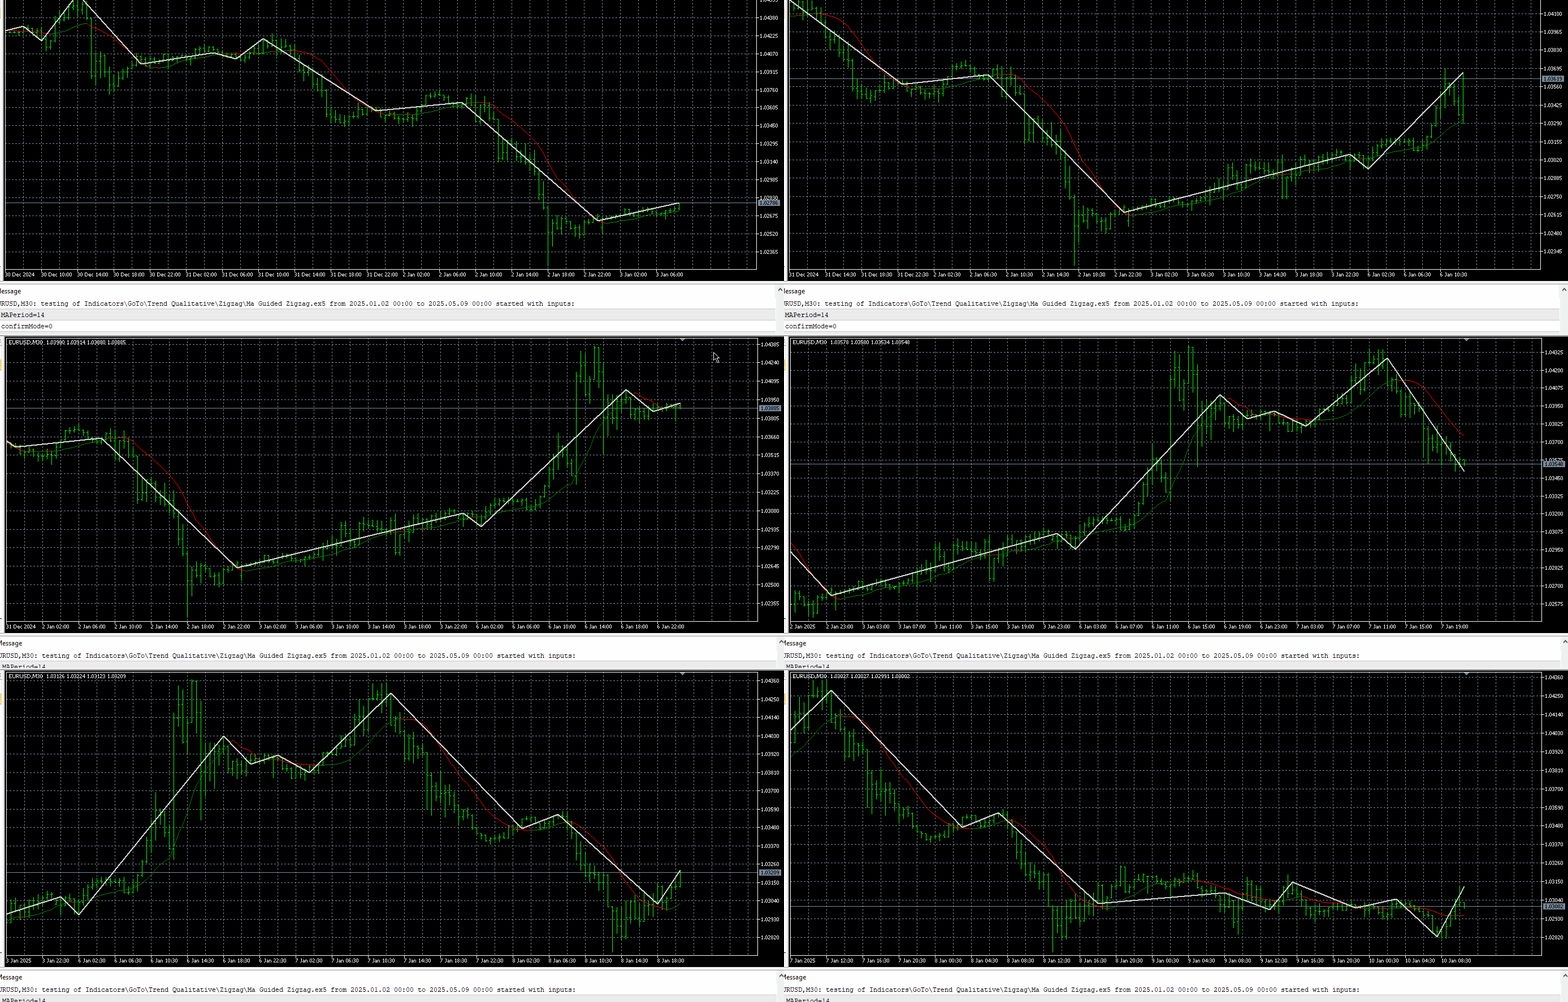


this is now doing an impressive job of providing harmony and clarity in chaotic sideways market zones that make no sense with a moving average

Afficher tous les commentaires (5)
Conor Mcnamara
2025.05.10
370 lines of code, the code kept changing and evolving...I am finished with it now. - A trend can be confirmed by bars or points
- Unlike a traditional zigzag, the price action does not confirm a trend, so there is no "depth" parameter, and the zigzag does not have to do confirmations - Confirmations are done with the trend in advance to "prepare" the zigzag on every subsequent bar so that the zigzag can start the new leg immediately It's a complete remodel of a zigzag indicator. Downloadable beta for free soon.
- Unlike a traditional zigzag, the price action does not confirm a trend, so there is no "depth" parameter, and the zigzag does not have to do confirmations - Confirmations are done with the trend in advance to "prepare" the zigzag on every subsequent bar so that the zigzag can start the new leg immediately It's a complete remodel of a zigzag indicator. Downloadable beta for free soon.
Conor Mcnamara
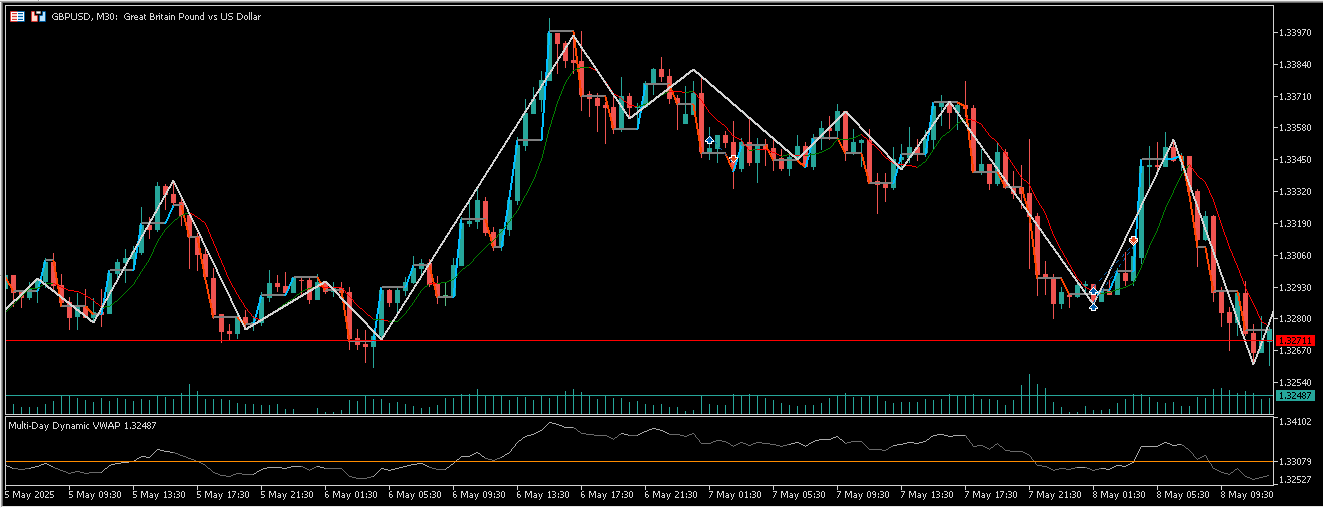
I'm building a brand new Zigzag which, once again, has instant trend detection and no delayed legs. No bar confirmations are needed in confirming the swings, and the legs always end at the current live bar.
How it works:
- It is guided by an MA trend, therefore there is no traditional ZigZag operation, as a moving average slope provides instant trend direction.
- The whipsaws and false signals you find in a moving average are completely ignored by two filters:
A traditional point deviation filter (comparing the previous swing to the current swing price).
An MA slope point confirmation filter, to bypass short, inconsequential moving average trends.
- A backstep is used so that the leg is constantly seeking the highest price (on a peak swing search) or lowest price (on a bottom swing search).
- If the moving average trend changes to mark a shift in the market, the leg does not need to alter the swing location at the point of the trend change if it already found a higher or lower price a few bars before.
- Keeping the backstep small keeps the swings in tune with the trend while never veering too far from the live moving average trend.
- A forward step is also implemented, but it's actually unnecessary as it would correct the Zigzag forward - and then it would be after the fact.
The zigzag I constructed here is very similar to the one I made for the Parabolic SAR indicator, but this one is more sophisticated, with both deviation and backstep logic.
It's definitely one of my more advanced codes. While it may not always capture the truest peaks and bottoms down to the end of candle wicks, it provides high-quality turning points, as can be seen in the screenshot.
Conor Mcnamara
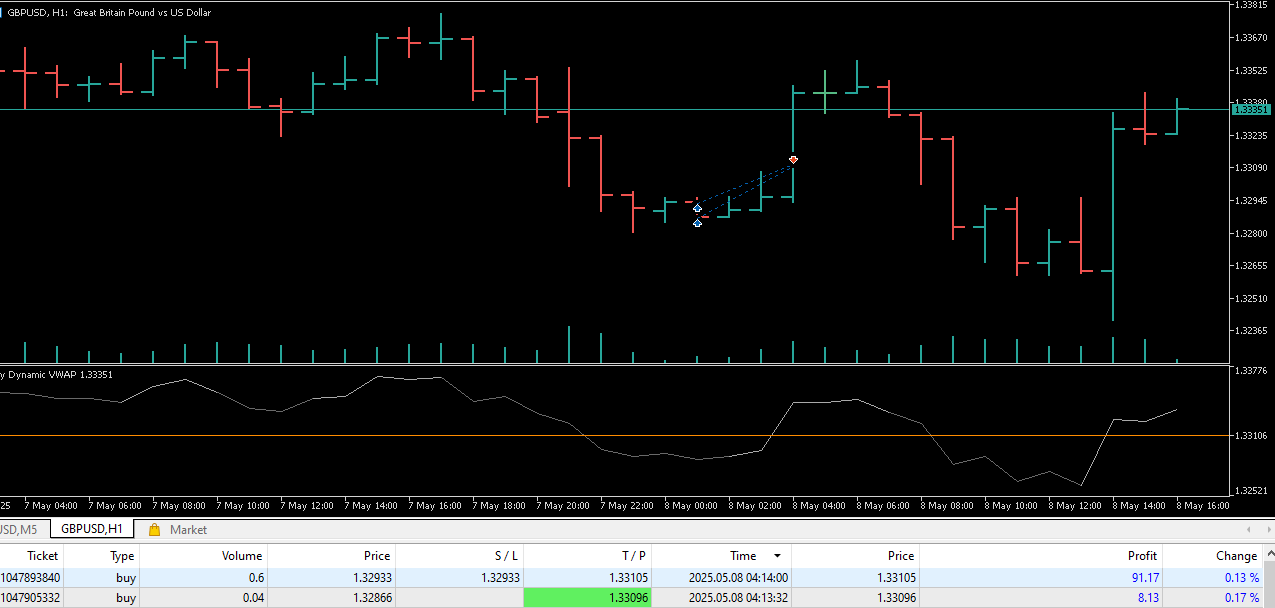
last night I wanted to test mean reversion on the new VWAP indicator I published in the codebase. After noticing a support, I expected the market to move up and retreat to VWAP, so I set the TP to the VWAP price at that time. Both trades hit the TP at 4am GMT+3
Conor Mcnamara
Code publié Multi-Day Dynamic VWAP
Dynamic VWAP level which can be averaged over multiple days
Partager sur les réseaux sociaux · 1
192
Conor Mcnamara

In this new indicator I built, I combined 3 worlds. I combine trend, volume, and tick trend into one indicator. The moving average is based on volume, the volume bars are colored by the heiken ashi trend, and the color of histogram bars are replaced by the tick trend during high volume events - to capture the trend of high bearish volume, and high bullish volume during the time that normal trend indicators would be lagging.

Conor Mcnamara
Code publié Volume MA with candle color tracking
A moving average of pure tick volume with histogram bars tracking bullish/bearish candle color
Partager sur les réseaux sociaux · 2
147
Conor Mcnamara
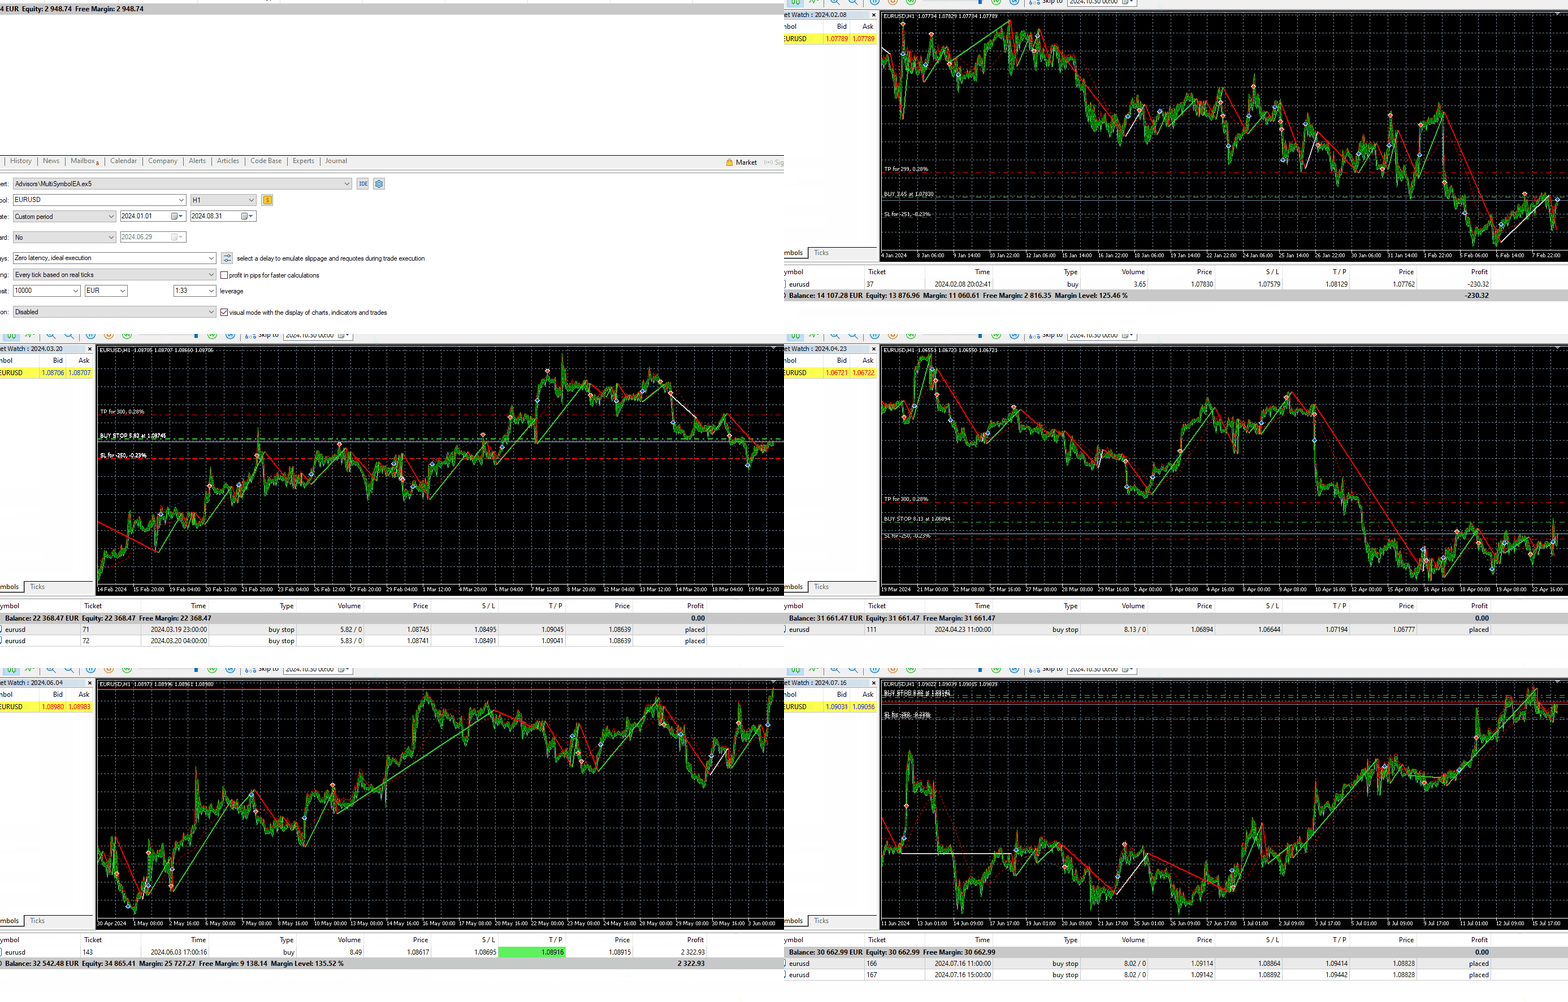
I automated my static zigzag based on macross. I did put this indicator on the codebase as well
backtest timelapse on the real ticks model- EURUSD H1- 8 months- Fast period length 2- Slow period length 30
Stop orders used in this simulation with 80 point offset
A different strategy will also be tested with limit orders
backtest timelapse on the real ticks model- EURUSD H1- 8 months- Fast period length 2- Slow period length 30
Stop orders used in this simulation with 80 point offset
A different strategy will also be tested with limit orders

Conor Mcnamara


The dilemma with EA ideas sometimes is that after you build the new idea, it could be no good. Experimental strategies sometimes end up as failures
Conor Mcnamara
2025.04.15
All the work counts for something. You learn what works and what doesn't, and you get a deeper understanding of the dangers in the market and why some things aren't safe enough
Conor Mcnamara
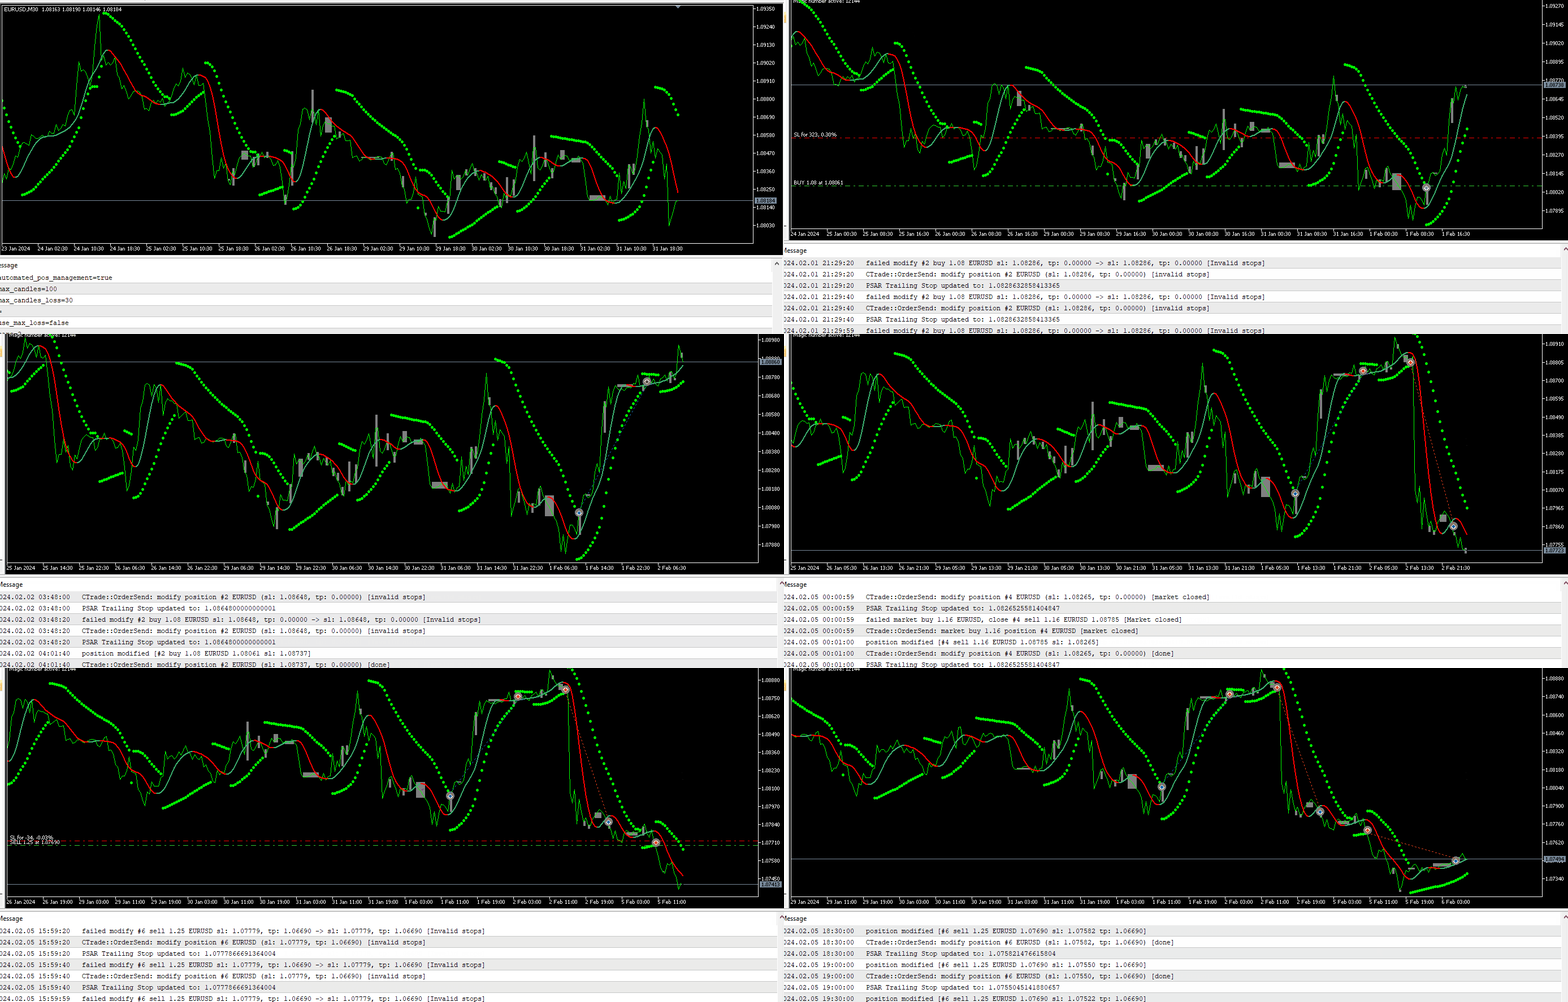

PSAR strategy:
Signal trade entry at the psar trend change
Confirm entry with MA slope trend
Trail stop loss with psar acceleration and a small offset
Filter signals with ranging market detection
Signal trade entry at the psar trend change
Confirm entry with MA slope trend
Trail stop loss with psar acceleration and a small offset
Filter signals with ranging market detection

Conor Mcnamara
2025.04.19
There are still caveats with this strategy. Psar will fail in thin markets. Will try a time filter and remove summer months.
Conor Mcnamara

It looks like there's a strong support at 3017 on Gold now, but it's hard to know if it will hold
Conor Mcnamara

xauusd is no longer for trading, it's a casino now, it looks like there will soon be a new normal
Conor Mcnamara


It's fascinating how different engineering backgrounds can shape someone's perspective on market behaviour.Wilder, the person who created the Parabolic sar - had a background in mechanical engineering and he viewed markets as a vehicle that drive with prices. John Ehlers, the person who created interesting smoother non lagging moving averages had a background in Electrical Engineering, and he viewed market prices as electrical signals.
Conor Mcnamara
Code publié PSAR Zigzag (Non lagging)
A zigzag based on the trend change of the parabolic sar
Partager sur les réseaux sociaux · 2
426
Conor Mcnamara
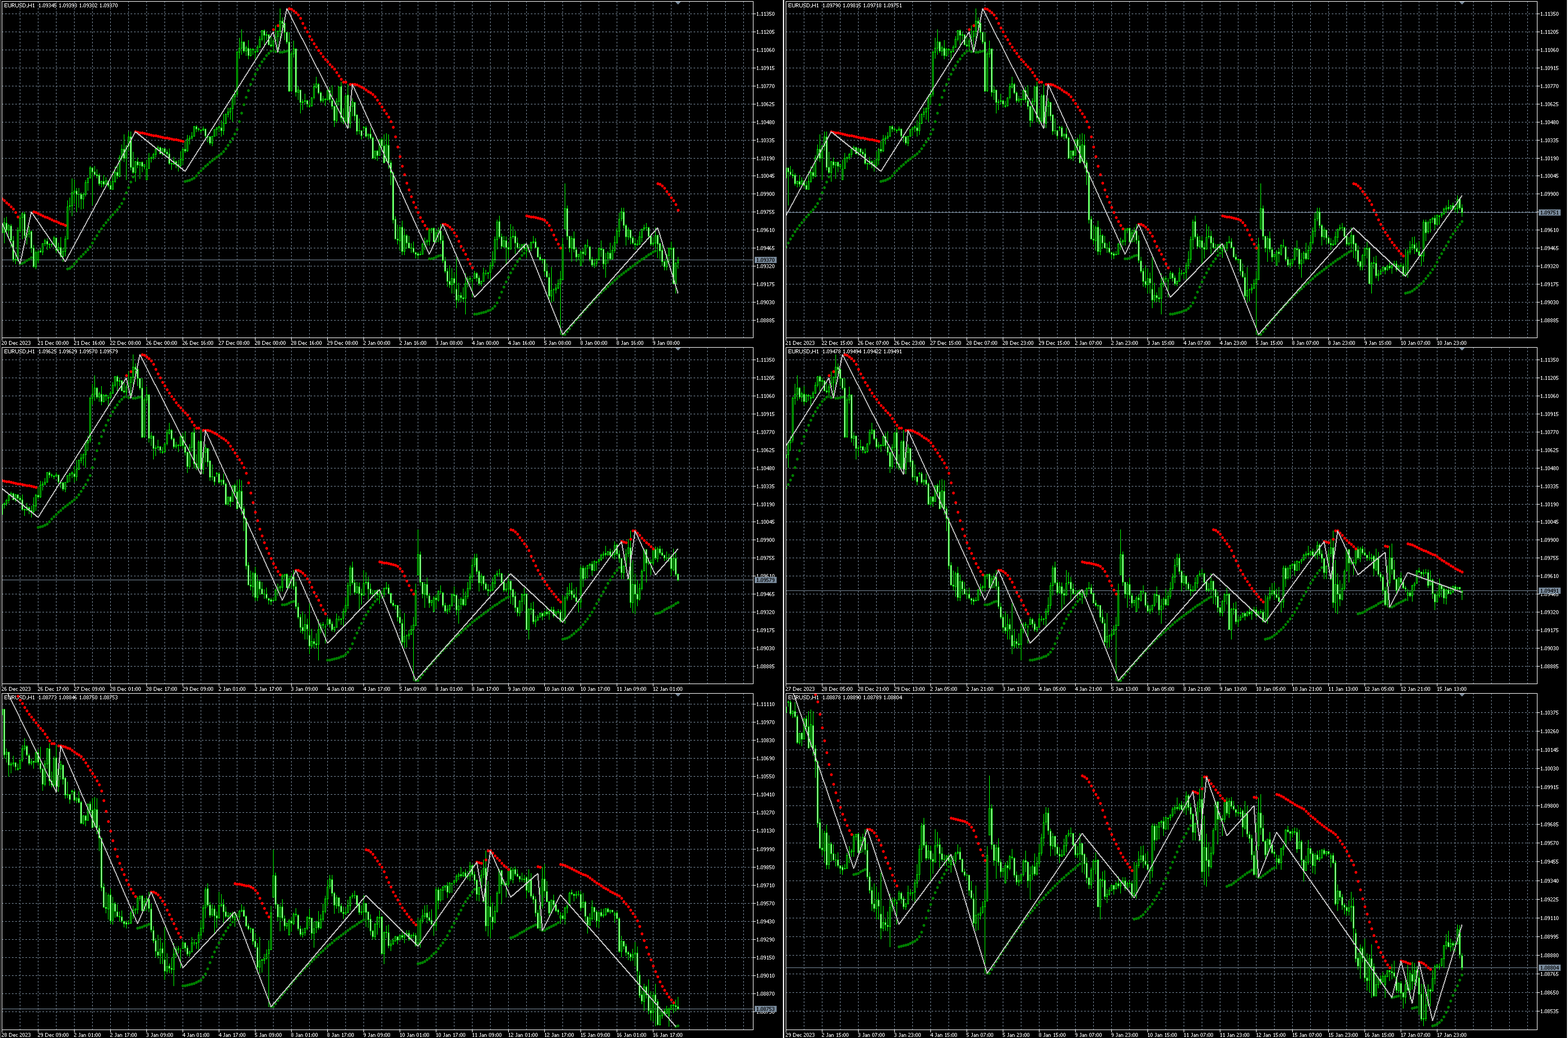


A zigzag sharper than your ex’s mood swings.
A zigzag that made hedge funds jealous and your neighbor reconsider Forex.
A zigzag that would make your granny yell ‘BUY!’
It's a zigzag coming soon to a codebase near you...
A zigzag that made hedge funds jealous and your neighbor reconsider Forex.
A zigzag that would make your granny yell ‘BUY!’
It's a zigzag coming soon to a codebase near you...

Conor Mcnamara
2025.04.07
had this idea in my mind for a while, but didn't really know how to code it to get it working right. I nearly went as far as thinking that I need to do a linear regression calculation to get a straight leg to the current bar, but it was much easier than that
Conor Mcnamara
last night I was building a zigzag which is non lagging and continuous to the current bar. It's not so obvious to make this work correctly. The zigzag drawing should maintain straight legs, but if you don't delete previous leg values when new highs and lows come, then it will turn into a line chart... I have it working now and I base the zigzag trend this time on psar which is non lagging
Conor Mcnamara
Code publié Ranging Market Detector
An indicator which attempts to highlight a ranging market area
Partager sur les réseaux sociaux · 1
390
:


