• Aperçu
  • Avis
  • Commentaires

Managed Trades

This utility is specifically designed for No Nonsense Forex traders.

What it does:-

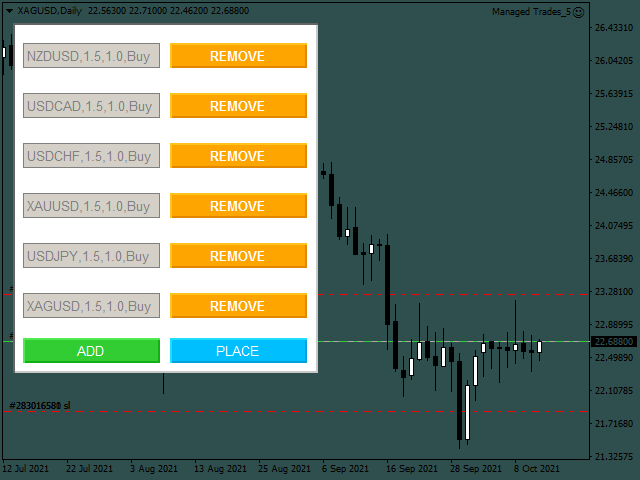
  • Let traders add or remove symbols to trade
  • Editable boxes in panel for updating inputs
  • Automatically applies money management to the trades
  • Places all orders with a single click 

How it calculates:-

  • Two trades are opened per symbol
  • By default max risk per trade is 1%
  • By default total risk is 6% which can changed in inputs tab(recommended to keep it 6 or below) 
  • On addition of symbols the total risk will be divided equally among all assets. For example if total added symbols are 6 then risk will be 1% per symbol and 0.5% per trade
  • Risk can be by account balance or equity which can be selected in inputs tab also
  • Volatility metric for lot calculation is ATR(Average True Range)
  • Editable inputs are in format(Symbol,Stop loss multiplier,Take profit multiplier,Order type). The first input is a constant and doesn't need to be changed

What it doesn't do:-

The utility doesn't check if sessions are opened for all added symbols so the user needs be aware of the session status of the symbol added. Roll over times need to taken into consideration also.

Produits recommandés
Golden Flash Scalper
Felipe Jose Costa Pereira
Golden Scalper XAU/USD – L'indicateur parfait pour le scalping sur le marché de l'or (XAU/USD) Pour les traders qui souhaitent maximiser leurs stratégies de scalping sur le marché de l'or, le Golden Scalper XAU/USD est l'outil idéal. Cet indicateur utilise des techniques avancées de reconnaissance de modèles pour générer des signaux d'entrée très précis, optimisant ainsi les transactions sur l'or (XAU/USD). Caractéristiques principales : Précision inégalée pour le scalping : Le Golden Scalper XA
Program Overview: This program is a trading tool designed to monitor and analyze the 7 major currency pairs. It is a variant of a similar program used for tracking stock indices, but this version focuses on the seven major currency pairs. The program helps in identifying and calculating significant price movements (gaps) between the high and low prices of these currency pairs over a specified time frame. It then provides insights through comments and alerts based on the calculated gaps. Major Cu
The indicator allows you to trade binary options. The recommended time frame is М1 and the expiration time is 1,2,3 minutes. The indicator suitable for auto and manual trading. A possible signal is specified as a arrows above/under a candle. You should wait until the candle closes! Arrows are not re-painted Trade sessions: TOKYO section (Half-end) Currency pairs: USD/JPY Working time frame: M1 Expiration time: 1,2,3 minutes. The indicator also shows good results when using the martingale strateg
FREE
Super Reversal Pattern
Parfait Mujinga Ndalika
Super Reversal Pattern Indicator Unlock the power of advanced pattern recognition with our Super Reversal Pattern Indicator. Designed for traders seeking precision and reliability, this indicator identifies one of the most effective reversal patterns in technical analysis, offering a significant edge in your trading strategy. Key Features: Non-Repainting Accuracy: Enjoy the confidence of non-repainting technology. Once a Super Reversal Pattern is detected, it remains static, providing consiste
Antabod Gamechanger
Rev Anthony Olusegun Aboderin
*Antabod GameChanger Indicator – Transform Your Trading!*   Are you tired of chasing trends too late or second-guessing your trades? The *Antabod GameChanger Indicator* is here to *revolutionize your trading strategy* and give you the edge you need in the markets!   Why Choose GameChanger? *Accurate Trend Detection* – GameChanger identifies trend reversals with *pinpoint accuracy*, ensuring you enter and exit trades at the optimal time.   *Clear Buy & Sell Signals* – No more guesswork! T
VR Cub
Vladimir Pastushak
VR Cub est un indicateur permettant d'obtenir des points d'entrée de haute qualité. L'indicateur a été développé pour faciliter les calculs mathématiques et simplifier la recherche de points d'entrée dans un poste. La stratégie de trading pour laquelle l'indicateur a été rédigé prouve son efficacité depuis de nombreuses années. La simplicité de la stratégie de trading est son grand avantage, qui permet même aux traders débutants de négocier avec succès avec elle. VR Cub calcule les points d'ouve
Master Scalping M1 est un indicateur innovant qui utilise un algorithme pour déterminer rapidement et avec précision la tendance. L'indicateur calcule le temps d'ouverture et de fermeture des positions, les algorithmes de l'indicateur vous permettent de trouver les moments idéaux pour entrer dans une transaction (acheter ou vendre un actif), ce qui augmente le succès des transactions pour la plupart des commerçants. Avantages de l'indicateur : Facile à utiliser, ne surcharge pas le graphique ave
Daily Candle Predictor est un indicateur qui prédit le cours de clôture d'une bougie. L'indicateur est principalement destiné à être utilisé sur les graphiques D1. Cet indicateur convient à la fois au trading forex traditionnel et au trading d'options binaires. L'indicateur peut être utilisé comme un système de trading autonome, ou il peut servir de complément à votre système de trading existant. Cet indicateur analyse la bougie actuelle, calcule certains facteurs de force à l'intérieur du corps
Horizontal tick volumes (HTV) Horizontal tick volumes - an easy and convenient indicator of a horizontal market profile in a user-selected time. Produces a visual image of strong trading levels by maximum peaks past volumes and trading direction by color (sell or buy), and also allows you to detect smaller trading levels by differentiating past volumes. In the "Optimal" mode, when displayed on chart periods up to and including "M30", the data of one-minute bars are used, on H1 and H4 - five-minu
Noize Absorption Index MT4
Ekaterina Saltykova
5 (1)
Noize Absorption Index - is the manual trading system that measures the difference of pressure between bears forces and bulls forces. Green line - is a noize free index that showing curent situation. Zero value of index shows totally choppy/flat market.Values above zero level shows how powerfull bullish wave is and values below zero measures bearish forces.Up arrow appears on bearish market when it's ready to reverse, dn arrow appears on weak bullish market, as a result of reverse expectation. S
Ugenesys AI MT4
Odaine Ramon Mcmillan
5 (1)
uGenesys AI - 90% Accurate Daytrading Indicator Introducing the ultimate forex trading indicator system, uGenesys AI, powered by cutting-edge AI technology and advanced analytical techniques, including Time-Series Analysis and Genetic Algorithms. Our AI-powered trading system leverages the power of time-series analysis to identify trends and patterns in historical price data, allowing traders to make informed predictions about future market movements. By analyzing vast amounts of data, our syst
Blahtech Market Profile
Blahtech Limited
4.53 (15)
Was: $249  Now: $149   Market Profile defines a number of day types that can help the trader to determine market behaviour. A key feature is the Value Area, representing the range of price action where 70% of trading took place. Understanding the Value Area can give traders valuable insight into market direction and establish the higher odds trade. It is an excellent addition to any system you may be using. Blahtech Limited presents their Market Profile indicator for the MetaTrader community. In
L'une des séquences de numéros s'appelle « Séquence des incendies de forêt ». Il a été reconnu comme l'une des plus belles nouvelles séquences. Sa principale caractéristique est que cette séquence évite les tendances linéaires, même les plus courtes. C'est cette propriété qui a constitué la base de cet indicateur. Lors de l'analyse d'une série chronologique financière, cet indicateur essaie de rejeter toutes les options de tendance possibles. Et seulement s'il échoue, il reconnaît alors la prés
Description: Please tick "Show object descriptions" in chart properties to enable hrays views That utility converts a trendline into a horizontal ray known as tool for drawing supply and demand zones. Simply create a trendline on a chart and once selected, it will get converted. Ray remains horizontal while dragging.  Quick ray plot: press "R" key to create horizontal ray. It will be snapped to the nearest OHLC value Further versions will be improved. For feature request please post new comm
ICT Kill zone and Macros Indicator mark and display the following zone times on the chart: Kill zones   Kill zone Forex Asian London Open New York Open London Close Central Bank Dealing range Kill zone Indices Asian London Open New York AM New York Lunch New York PM Power Hour Macros London 1 London 2 New York Am 1 New York AM 2 New York Lunch New York PM 1 New York PM 2 Silver bullet London Open New York AM New York PM Sessions Asian London New York Chart The display of  Kill zone , Macro ,
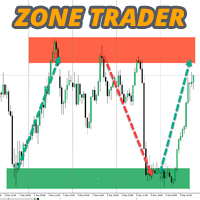
For sure, this indicator has become very popular amongst traders. Through coding this indicator will give you the most accurate levels possible for your trading analysis. We have also added in the ability for you to receive alerts when the price breaks above or below a Support or Resistance lines! HOW TO USE The red rectangles represent your resistance/supply zone. The green rectangles represent your support/demand zone.  BONUS FEATURES We coded this indicator with the ability to switch between
Profile Map
Dmitriy Sapegin
5 (11)
Market Profile helps the trader to identify the behavior if major market players and define zones of their interest. The key feature is the clear graphical display of the range of price action, in which 70% of the trades were performed. Understanding of the location of volume accumulation areas can help traders increase the probability of success. The tool can be used as an independent system as well as in combination with other indicators and trading systems. this indicator is designed to suit
Prop Trade Assistant – Panneau de Trading pour MT4 Prop Trade Assistant est un panneau de trading pour la plateforme MetaTrader 4, conçu pour aider les traders à gérer efficacement leurs opérations manuelles. Cet outil calcule automatiquement les profits et pertes potentiels, permet de définir des limites maximales de profits et pertes quotidiens, et ferme toutes les positions automatiquement lorsque ces limites sont atteintes. Fonctionnalités : Calcul des Profits et Pertes Calcule automatique
EARLY REMINDER: The Starting price is 65 price will rise soon up to 365$ and then 750$ after first 10 copies of sales. Grab this offer now! Introduction Hello, traders! Welcome to the demonstration of the Forex Beast Indicator , a comprehensive tool designed to assist aspiring traders in navigating the complexities of the forex market. This indicator incorporates seven essential components to provide a well-rounded trading experience: Moving Averages Colored Zones Support and Resistance Levels
Are you tired of plotting fibonacci retracements or extensions manually? This indicator displays fibonacci retracements or extensions automatically, calculated from two different price points, without human intervention or manual object anchoring.  [ Installation Guide | Update Guide | Troubleshooting | FAQ | All Products ] Easy to use Manual anchoring is not needed Perfect for price confluence studies The indicator evaluates if retracements or extensions are needed Once drawn, you can manually
"Auto FIBO Pro" Crypto_Forex indicator - est un excellent outil auxiliaire dans le trading ! - L'indicateur calcule et place automatiquement sur le graphique les niveaux de Fibo et les lignes de tendance locales (couleur rouge). - Les niveaux de Fibonacci indiquent les zones clés où le prix peut s'inverser. - Les niveaux les plus importants sont 23,6 %, 38,2 %, 50 % et 61,8 %. - Vous pouvez l'utiliser pour le scalping inversé ou pour le trading en grille de zones. - Il existe également de nomb
The Best One Scalping Trade Panel functional manual trade panel with risk reward, auto SL by candle ( original solution), lot size calculation, one-click trading, scale in and out of trades (partial close),  Works with all symbols not just currency pairs, perfect works on DAX, NASDAQ, GOLD, ...... I earn every day during live stream on ZakopiecFX - join Me Risk by lot Risk by percent SL by points SL by Candle, Renko, RangeBar ( original solution) TP by point TP by Risk/Reward Auto Trailing by P
We present you the indicator "Candle closing counter", which will become your indispensable assistant in the world of trading. That’s why knowing when the candle will close can help: If you like to trade using candle patterns, you will know when the candle will be closed. This indicator will allow you to check if a known pattern has formed and if there is a possibility of trading. The indicator will help you to prepare for market opening and market closure. You can set a timer to create a pre
The Penta-O is a 6-point retracement harmonacci pattern which usually precedes big market movements. Penta-O patterns can expand and repaint quite a bit. To make things easier this indicator implements a twist: it waits for a donchian breakout in the right direction before signaling the trade. The end result is an otherwise repainting indicator with a very reliable trading signal. The donchian breakout period is entered as an input. [ Installation Guide | Update Guide | Troubleshooting | FAQ | A
TWO PAIRS SQUARE HEDGE METER INDICATOR Try this brilliant 2 pairs square indicator It draws a square wave of the relation between your two inputs symbols when square wave indicates -1 then it is very great opportunity to SELL pair1 and BUY Pair2 when square wave indicates +1 then it is very great opportunity to BUY pair1 and SELL Pair2 the inputs are : 2 pairs of symbols         then index value : i use 20 for M30 charts ( you can try other values : 40/50 for M15 , : 30 for M30 , : 10 for H1 ,
Trade with Gann on your side!! MASTER CIRCLE 360 CIRCLE CHART, originally created by Gann admitted that this is “The Mother of all charts”. It is one of the last studies that this great trader left for us. The numeric tab le is apparently quite simple like all the tables and is based on square numbers, the SQUARE OF 12 and is by evolution, one of the most important square numbers. Here we can find CYCLE, PRICE AND TIME thanks to angles and grades, to show past and future support and resistance.
Cosmic Diviner X Planet
Olena Kondratenko
4 (2)
This unique multi-currency strategy simultaneously determines the strength of trends and market entry points, visualizing this using histograms on the chart. The indicator is optimally adapted for trading on the timeframes М5, М15, М30, Н1. For the convenience of users, the indicator renders the entry point (in the form of an arrow), recommended take profit levels (TP1, TP2 with text labels) and the recommended Stop Loss level. The take profit levels (TP1, TP2) are automatically calculated for
Real-time spread tracking and monitoring software Displays spread values in form of histograms on current timeframe of chart Convenient for analyzing spread changes, as well as for comparing trading conditions of different brokers By placing on desired chart, the spread changes at different trading times are displayed Additionally Fully customizable Works on any instrument Works with any broker
Angry bull Option Binary
Fabio Oliveira Magalhaes
1 (1)
Angry Bull Option Binary   This is a Binary Options robot, which contains 7 strategies, you can backtest it to check what the best strategies are Settings Initial Batch Value Dynamic Investment = If activated it will use an automatic lot according to its capital Balance ($) w/ backtest = Starting balance to backtest PorcRiscoInvestment = It will be the value of % for the automatic lot if it is activated Expiration (in minutes) = It will be the expiration time of orders in Binary Options Magic
L'unicité de cet indicateur réside dans l'algorithme de comptabilisation des volumes : l'accumulation se fait directement pour la période sélectionnée sans référence au début de la journée. Les dernières barres peuvent être exclues du calcul, alors les données courantes auront moins d'influence sur les niveaux significatifs (volumes) formés précédemment. Pour un calcul plus précis, les données du graphique M1 sont utilisées par défaut. L'étape de répartition des volumes de prix est réglementée.
Les acheteurs de ce produit ont également acheté
Trade Assistant MT4
Evgeniy Kravchenko
4.43 (183)
It helps to calculate the risk per trade, the easy installation of a new order, order management with partial closing functions, trailing stop of 7 types and other useful functions. Additional materials and instructions Installation instructions   -   Application instructions   -   Trial version of the application for a demo account Line function -   shows on the chart the Opening line, Stop Loss, Take Profit. With this function it is easy to set a new order and see its additional characteris
Bienvenue sur Trade Manager EA, l’outil ultime de gestion des risques conçu pour rendre le trading plus intuitif, précis et efficace. Ce n’est pas seulement un outil d’exécution d’ordres ; c’est une solution complète pour la planification des trades, la gestion des positions et le contrôle des risques. Que vous soyez débutant, trader expérimenté ou scalpeur ayant besoin d’une exécution rapide, Trade Manager EA s’adapte à vos besoins, offrant une flexibilité sur tous les marchés, des devises et i
Local Trade Copier EA MT4
Juvenille Emperor Limited
5 (90)
Découvrez une expérience exceptionnellement rapide de copie de trades avec le Local Trade Copier EA MT4 . Avec sa configuration facile en 1 minute, ce copieur de trades vous permet de copier des trades entre plusieurs terminaux MetaTrader sur le même ordinateur Windows ou Windows VPS avec des vitesses de copie ultra-rapides de moins de 0.5 seconde. Que vous soyez un trader débutant ou professionnel, le Local Trade Copier EA MT4 offre une large gamme d'options pour le personnaliser en fonction d
Grid Manual MT4
Alfiya Fazylova
4.71 (17)
Grid Manual est un panneau de trading permettant de travailler avec une grille d'ordres. L'utilitaire est universel, possède des paramètres flexibles et une interface intuitive. Il fonctionne avec une grille d'ordres non seulement dans le sens des pertes, mais aussi dans le sens de l'augmentation des profits. Le commerçant n'a pas besoin de créer et de maintenir une grille d'ordres, l'utilitaire le fera. Il suffit d'ouvrir une commande et "Grid Manual" créera automatiquement une grille de comman
Trade Manager MT4 DaneTrades
Levi Dane Benjamin
4.4 (10)
Trade Manager pour vous aider à entrer et sortir rapidement des transactions tout en calculant automatiquement votre risque. Y compris des fonctionnalités pour vous aider à éviter le sur-trading, le trading de vengeance et le trading émotionnel. Les transactions peuvent être gérées automatiquement et les mesures de performances du compte peuvent être visualisées dans un graphique. Ces fonctionnalités rendent ce panneau idéal pour tous les traders manuels et contribuent à améliorer la plateforme
Exp COPYLOT CLIENT for MT4
Vladislav Andruschenko
4.69 (65)
Copieur commercial pour MetaTrader 4.       Il copie les transactions de change, les positions et les ordres de tous les comptes. C'est l'un des meilleurs copieurs commerciaux       MT4 - MT4, MT5 - MT4       pour le       COPYLOTE MT4       version (ou       MT4 - MT5 MT5 - MT5       pour le       COPYLOTE MT5       version). Version MT5 Description complète   +DEMO +PDF Comment acheter Comment installer     Comment obtenir des fichiers journaux     Comment tester et optimiser     Tous les p
Le MT4 to Telegram Signal Provider est un outil facile à utiliser et entièrement personnalisable qui permet d'envoyer des signaux à Telegram, transformant ainsi votre compte en fournisseur de signaux. Le format des messages est entièrement personnalisable ! Cependant, pour une utilisation simple, vous pouvez également opter pour un modèle prédéfini et activer ou désactiver des parties spécifiques du message. [ Démonstration ]   [ Manuel ] [ Version MT5 ] [ Version Discord ] [ Canal Telegram ] C
HFT Fast Scalping EA
Sami George Saba Zeidan
HFT FAST SCALPING EA the High Frequency Trading which use stop orders to enter the trades when market is trending. Limited price $350 is only for 10 first sales. After 10 sales, the price will be raised +$100. Final price for  HFT FAST SCALPING EA    $1200 STARTING FROM 1 JANUARY 2025. best use for 1- Low slippage brokers for us30 and DE40 . 2- LOW OR ZERO COMMISSION BROKERS FOR EUR AND GOLD. 3-Prop firms like ftmo ,tff,.......etc This EA UNLIKE Other HFT EAs , You can see that in the parame
Forex copier
Alexandr Bryzgalov
We offer simple and reliable software that can  copy trades  between any MT4 accounts. Easy to use MetaTrader copier which saves valuable time Reliable, so you are protected from technical issues Powerful, with a lot of features available Who can use this MT4 copier? Forex Copier is a solution for individual traders or account managers who need to execute trade signals from external sources or who need to  manage several MetaTrader 4 accounts  at the same time. We do not offer you “yet another
Trade Dashboard MT4
Fatemeh Ameri
5 (46)
Tired of complex order placement and manual calculations? Trade Dashboard is your solution. With its user-friendly interface, placing orders becomes effortless, by a single click, you can open trades, set stop loss and take profit levels, manage trade lot size, and calculate risk to reward ratios, allowing you to only focus on your strategy. Say goodbye to manual calculations and streamline your trading experience with Trade Dashboard. Download  Demo Version  right now. You can find  Details of
Consultez instantanément l'historique de vos transactions clôturées par jour et par semaine, vos transactions ouvertes actuelles et votre exposition au forex sur un seul graphique ! Utilisez la carte thermique pour identifier les transactions rentables et où se situe votre baisse actuelle au sein de votre portefeuille de trading. Boutons de fermeture rapide Utilisez les boutons de fermeture rapide pour clôturer chaque transaction sur un seul symbole, clôturer des transactions individuelles en
Custom Alerts MT4
Daniel Stein
5 (6)
Custom Alerts : Surveillez plusieurs marchés et ne ratez plus aucune opportunité clé Vue d’ensemble Custom Alerts est une solution dynamique pour les traders souhaitant suivre, de manière centralisée, les signaux potentiels sur différents instruments. En intégrant les données de nos outils phares — comme FX Power, FX Volume et IX Power — Custom Alerts vous informe automatiquement des évolutions cruciales du marché, sans avoir à jongler entre de multiples graphiques ou risquer de passer à côté
TradePanel MT4
Alfiya Fazylova
4.9 (86)
Trade Panel est un assistant commercial multifonctionnel. L'application contient plus de 50 fonctions de trading pour le trading manuel et vous permet d'automatiser la plupart des opérations de trading. Attention, l'application ne fonctionne pas dans le testeur de stratégie. Avant d'acheter, vous pouvez tester la version démo sur un compte démo. Version démo ici . Instructions complètes ici . Commerce. Permet d'effectuer des opérations de trading en un clic : Ouvrez des ordres et des positions e

The product will copy all telegram signal to MT4   ( which you are member  ) , also it can work as remote copier.  Easy to set up, copy order instant, can work with almost signal formats, image signal, s upport to translate other language to English Work with all type of channel or group, even channel have "Restrict Saving Content", work with  multi channel, multi MT5 Work as remote copier: with signal have ticket number, it will copy exactly via ticket number. Support to backtest signal. How to
Trade copier MT4
Alfiya Fazylova
4.52 (29)
Trade Copier est un utilitaire professionnel conçu pour copier et synchroniser les commandesentre les comptes de trading. Les commandes sont copiées du compte/terminal du fournisseur vers le compte/terminal du destinataire, qui sont installés sur le même ordinateur ou vps. Avant d'acheter, vous pouvez tester la version démo sur un compte démo. Version démo ici . Instructions complètes ici . Principales fonctionnalités et avantages: Prend en charge la copie des commandes MT4> MT4, MT4> MT5, MT5>
Trade Assistant Pro 36 in 1
Makarii Gubaydullin
4.95 (19)
Outil multifonctionnel : plus de 65 fonctions, dont : calcul de lot, price action, facteur R/R, gestionnaire des trades, zones d'offre et de demande Version de démonstration   |   Manuel de l'Utilisateur   |    MT5 L'utilitaire ne fonctionne pas dans le testeur de stratégie : vous pouvez télécharger la   version de démonstration ICI   pour tester le produit. Contactez-moi pour toutes questions / idées d'amélioration / en cas de bug trouvé Simplifiez, accélérez et automatisez votre processus de
Copieur ->Interaction d'interface pratique et rapide, les utilisateurs peuvent l'utiliser immédiatement       ->>>> Recommandé pour une utilisation sur des ordinateurs Windows ou VPS Windows Caractéristiques: Paramètres de copy trading diversifiés et personnalisés : 1. Différents modes de lot peuvent être définis pour différentes sources de signaux 2. Différentes sources de signaux peuvent être définies pour le copy trading avant et arrière 3. Les signaux peuvent être définis avec des commentai
Trend Line Optimizer
Evgenii Aksenov
4.06 (18)
Il s'agit d'un optimiseur de paramètres automatique pour l'indicateur Trend Line PRO Vous pouvez facilement et rapidement trouver les paramètres optimaux pour votre indicateur Trend Line PRO préféré.  L'optimisation ne prend que quelques secondes. L'optimiseur vous permet de trouver les meilleurs paramètres pour chaque paire et période: Amplitude, TP1-TP3, StopLoss, ainsi que les valeurs pour Time Filter et HTF Filter sur la section sélectionnée de l'histoire (Days)  Pour optimiser différents
Edge Zone EA
FXsolutions
5 (1)
With this Expert Advisor you will follow the sound trading principle Buy Low and Sell High by default ! And you can do that even with a normal day job . You will be even able to trade on lower timeframes which you could never do without such an Expert Advisor. And the best thing is that you are in control! You can tell the Edge Zone EA where it has to enter and where it has to exit. And you can do that even many hours before the trade will occur . This EA is therefore an excellent assistant for
Comprehensive on chart trade panel with the unique ability to be controllable from mobile as well. Plus has a library of downloadable configuration, e.g. exit rules, extra panel buttons, pending order setup and more. Please see our product video. Works with all symbols not just currency pairs. Features On chart panel plus controllable from free app for Windows, iPhone and Android Built-in script engine with library of downloadable configuration, e.g. add 'Close All Trades in Profit' button, exit
Une stratégie d'arbitrage triangulaire exploite les inefficacités entre trois paires de devises liées, plaçant des transactions compensatoires qui s'annulent pour un bénéfice net lorsque l'inefficacité est résolue. Un accord implique trois transactions, échangeant la devise initiale contre une seconde, la deuxième devise contre une troisième et la troisième devise contre la première. Avec la troisième transaction, l'arbitragiste s'assure un profit sans risque de l'écart qui existe lorsque le ta
Négociez automatiquement les zones de support et de résistance ou d'offre et de demande une fois que vous avez identifié les zones clés à partir desquelles vous souhaitez négocier. Cet EA vous permet de dessiner des zones d'achat et de vente en un seul clic, puis de les placer exactement là où vous vous attendez à ce que le prix change. L'EA surveille ensuite ces zones et effectuera automatiquement des transactions en fonction de l'action des prix que vous spécifiez pour les zones. Une fois la
Auto Trade Copier
Vu Trung Kien
4.7 (90)
Auto Trade Copier is designed to copy trades to multiple MT4, MT5 and cTrader accounts/terminals with 100% accuracy. The provider and receiver accounts must be on the same PC/VPS. With this tool, you can copy trades to receiver accounts on the same PC/VPS. All trading actions will be copied from provider to receiver perfectly. This version can be used on MT4 accounts only. For MT5 accounts, you must use Auto Trade Copier for MT5 . Reference: - For MT4 receiver, please download Trade Receiver Fre
FSS Report
Bao Ying Huang
5 (2)
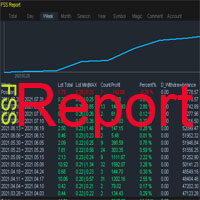
This is a professional report statistical indicator, which can be counted by day, week, month, quarter, year, magic and comment, and display the growth curve. install: select "File" in your MT4 client,and open the folder "MQL4\indicators",then copy file "FSS_Report.ex4",reload MT4 and enjoy. Para List: UI_XY_Setting=21 UI_X_default=0 UI_Y_default=21 custom_title=FSS Report UI_reload_time_interval=5 report_time_from=0 report_time_to=0 filter_demo=____________symool, magic and comment, all supp
CAP Strategy Builder EA
MEETALGO LLC
4.84 (31)
The top-selling EAs on the market cost a lot and one day they are suddenly gone. This is because one strategy will not work in the forex market all the time. Our product is unique from all others in the MQL Marketplace because our EA comes with 34+ built-in indicators that allow adding more strategies every time.  You build your strategy and keep updating it. If one strategy does not work, simply build another all using only one EA. This is All-In-One EA in this market place. You can use as trad
Summer 40% discount ($149 -> $88) Everything for chart Technical Analysis indicator mt4 in one tool Draw your supply demand zone with rectangle and support resistance with trendline and get alerts to mobile phone or email alert -  Risk reward indicator Video tutorials, manuals, DEMO download   here .  Find contacts on my   profile . 1.   Extended rectangles and trendlines Object will be extended to the right edge of the chart when price will draw new candles on chart. This is rectangle extende
DrawDown Limiter MT4
Haidar, Lionel Haj Ali
5 (8)
Expert Advisor "Drawdown Limiter"  Vous êtes au bon endroit si vous recherchez un contrôle de drawdown, un limiteur de drawdown, une protection du solde, une protection de l'équité ou une limite quotidienne de drawdown en rapport avec les entreprises de gestion de capitaux (Prop Firm), FTMO, My Forex Fund, ou si vous souhaitez protéger votre compte de trading. Avez-vous déjà eu du mal à contrôler votre drawdown en tradant sur des comptes financés ? Cet EA est fait pour vous. Les entreprises de
Engulfing Dashboard is a forex system that can help you generate forex profits easily without having to work hard to learn forex knowledge because this Dashboard is complete with all the facilities and functions that are sophisticated and effective. This system is made based on Supply and Demand techniques to measure Market Direction (trend) more accurately than using indicators such as Moving Average, MACD, trendline and so on. It is made using a certain formula so that the accuracy of the mar
News Trader Pro
Vu Trung Kien
4.41 (17)
News Trader Pro is a unique robot that allows you to trade the news by your predefined strategy. It loads every piece of news from several popular Forex websites. You can choose any news and preset the strategy to trade it, and then News Trader Pro will trade that news by selected strategy automatically when the news comes. News release gives opportunity to have pips since the price usually has big move at that time. Now, with this tool, trading news becomes easier, more flexible and more exciti
CloseIfProfitorLoss with Trailing
Vladislav Andruschenko
4.86 (28)
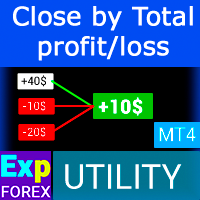
Clôture des positions dans MetaTrader 4 après avoir atteint le bénéfice/perte total avec la fonction de suivi des bénéfices. Vous pouvez activer les arrêts virtuels (ordre séparé) . Calcul et clôture des positions ACHAT et VENTE séparément (ACHAT VENTE séparé) . Fermeture et calcul de tous les symboles ou du symbole courant uniquement (Tous les symboles) . Activer le suivi pour le profit ( Trailing Profit ). Clôture sur le total des profits et pertes en devise de dépôt, en points, ou en % du so
Plus de l'auteur
IBB Candles is a tool that is based on the concept of Inverse Bollinger Bands. It compares price relative to state of the bands and plots candles with different colors defining the current state of the market i.e range | trend | strong trend. As the name suggests IBB(Inverse Bollinger Bands) is a technique which is completely different from the traditional Bollinger Bands and proves to be much more effective in analyzing market. This personal implementation makes this tool a more reliable option
CMA dashboard is designed to help traders in identifying trend on multiple timeframes and symbols. It displays a clear state of the overall trend at one place without the need to navigate between different charts and timeframes. This saves time and makes decision making process fast so that potential opportunities are not missed. It is based on Corrected moving averages available here Features Parameters for signal optimization Inputs for multiple timeframes and symbols  Usage Higher timeframe
Renko bars builder
Navdeep Singh
4.2 (5)
The indicator builds a Renko chart in the sub window for the current symbol. The bars are formed from live data and the desired bar size can be set in the inputs tab. Most importantly, because the Renko chart only uses price to construct bars and ignores time, the indicator can be applied to any time frame and same results can be achieved. Recommended usage As Renko charts are famous for eliminating noise so traders can use this tool to see clear picture of the trend to help their analysis, entr
FREE
ZigZag New
Navdeep Singh
4 (2)
Informative & optimized Zigzag, Accumulated volume, Price change   A rewrite of the traditional zigzag tool with new additions. Features:- Optimized code Displays accumulated volume between peaks Displays price change between peaks Usage:- Identify trend swings Identify high volume swings Compare price changes between swings Drawing Fibonacci tool on strong price change or high volume swings
FREE
RSI Scanner, Multiple Symbols and Timeframes, Graphical User Interface An indicator that scans multiple symbols added from the market watch and timeframes and displays result in a graphical panel. Features: Multi symbol Multi timeframe Alerts and Notifications Live Monitoring Sorting modes One click to change symbol and timeframe Inputs for RSI and scanner settings
FREE
ADR Bands
Navdeep Singh
4.5 (2)
Average daily range, Projection levels, Multi time-frame ADR bands shows levels based on the selected time-frame. Levels can be used as projections for potential targets, breakouts or reversals depending on the context in which the tool is used. Features:- Multi time-frame(default = daily) Two coloring modes(trend based or zone based) Color transparency  
FREE
50+ Candlestick Patterns, Simulated Trading Results, Top Five Performers Candle Analysis extends Candlesticks Pattern Analysis by not only identifying Patterns but also recording the Past Performance of the Patterns. What it Does:- Identifies and plots results on chart Displays Top Patterns for both Bullish and Bearish type.  Log can be printed in experts tab to see Simulated Trading results Displays All or Selected Patterns Alerts on Pattern formation More detailed information in   Blog
RSI Scanner, Multiple Symbols and Timeframes, Graphical User Interface An indicator that scans multiple symbols added from the market watch and timeframes and displays result in a graphical panel. Features: Multi symbol Multi timeframe Alerts and Notifications Live Monitoring Sorting modes One click to change symbol and timeframe Inputs for RSI and scanner settings
FREE
Algorithmic Signals indicator   is not an indicator but a strategy that generates entry/exit signals. The entry arrows are formed after multiple conditions are met. The indicator is using an   Adaptive Algorithm   which automatically adjust to the symbol and time frame (see the screenshots below) . Signals can be used for scalping or even trend trading. Main features:- Non repainting signals Entry signals Exit signals Alert for price reaching 1 x ATR(14) (could be utilized for initial take prof
Stochastic force is an advanced version of the stochastic oscillator. Instead of using the regular price a more efficient price data is provided as an input for the oscillator which takes into account the price efficiency, volume and market noise. Also price is pre-filtered with the selected average type and then post-filtered by a hull moving average which provides a smooth transition of the oscillator. It eliminates maximum false signals and has the potential to become an integral part of any
This is the new version of the Algorithmic signals featuring a new algorithm. It is a blend of technical and candlestick analysis. Candlestick analysis are often ignored while creating technical strategies but this version has a feature to include that and make confirmations more strong.  Usage:- Traders can use the signals for buying and selling assets or even blend their own favorite indicators with it.
TDI Signals generates buy and sell arrows based on a TDI(Traders Dynamic Index) algorithm. It looks for price breakouts, continuations and reversals. By default it runs in the trend mode but user is provided with the option to change that to reversal mode. Trader can use the mode which compliments his/her trading style.  Usage:-   TDI Signals can be used as a stand alone indicator with context or even be added to strategies to make confirmations more strong. Volatility based stop loss, take pro
RSI Levels generates buy and sell arrows based on RSI analysis. Signals are based on extreme levels breakouts and can be further filtered by a volatility metric. Trader can use the mode which compliments his/her trading style.  Features:- Parameters for signal optimization and alerts. Usage:-   RSI Levels can be used as a stand alone indicator with context or even be added to strategies to make confirmations more strong. Volatility based stop loss, take profit & position sizing can be very helpf
The indicator helps the trader in identifying potential liquidity levels. The algorithm used in this indicator checks the behavior of the asset taking into account the price levels, momentum and volume analysis. Features:- Parameters for signal optimization and alerts. Usage:- The levels formed by the indicator can be helpful to traders in identifying potential entries, breakouts or reversals. it can assist traders of technical trading background or even pure price action trading. Examples of
Step force index is a modified version of the famous force index indicator. As the name suggests it incorporates a step feature to filter the force index values thus eliminating small fluctuations in the indicator. It also utilizes the smooth algorithm library thereby providing multiple smoothing options for the index values. This personal implementation makes it a more easy to use and a reliable tool. Main features A wide range of parameters for signals optimization Alerts, emails and push noti
Market structures, Market balance, Range breakouts This tools helps to identify areas of market ranges, structures and plots colored boxes on breakout of those areas. User is given the option to receive alerts and notifications on the formation of the blocks. The tool has the ability to become an essential part of a technical trading system or even pure price action trading. Usage:- An essential tool for price action or technical traders.  More information in the blog
Horizontal volume bars, Cluster analysis, Volume profile Volume in Range gets information about the accumulated volume in a specified vertical range and period in bars. The received data is then plotted on the chart as rectangular boxes with the volume quantity inside. Usage:- The tool acts as a support resistance levels but most importantly it should be used to check in which direction the price breaks out of the significant levels formed by this indicator and then actions to be taken on correc
Price breakouts, Levels, Multi-time frame Inside bars checks for price failure to break from the previous high/low and on breakout draws a breakout box on the chart. The choice of breakout price is given to the user i.e. close or high/low of bar. Alerts can be received on breakouts. Features:- Multi-time frame Alerts, notifications & emails Usage:- Breakout signals Check how price action is evolving with the help of boxes Get multi-time frame bias
Market Fractal Analysis, Fractal Swing, Market Flow Fractal Cycles looks for Similar Patterns in the Market that repeat themselves because of the Market Fractal Nature. These patterns are displayed with help of Graphical Objects and Alerts can be received on their arrival. Read the Blog for full information. Features:- Auto Detection of Patterns Customization for Color and Line Styles Alerts, Emails & Push Notifications 
50+ Candlestick Patterns, Simulated Trading Results, Top Five Performers Candle Analysis extends Candlesticks Pattern Analysis by not only identifying Patterns but also recording the Past Performance of the Patterns. What it Does:- Identifies and plots results on chart Displays Top Patterns for both Bullish and Bearish type.  Log can be printed in experts tab to see Simulated Trading results Displays All or Selected Patterns Alerts on Pattern formation More detailed information in Blog
Stochastic force is an advanced version of the stochastic oscillator. Instead of using the regular price a more efficient price data is provided as an input for the oscillator which takes into account the price efficiency, volume and market noise. Also price is pre-filtered with the selected average type and then post-filtered by a hull moving average which provides a smooth transition of the oscillator. It eliminates maximum false signals and has the potential to become an integral part of any
The indicator helps the trader in identifying potential liquidity levels. The algorithm used in this indicator checks the behavior of the asset taking into account the price levels, momentum and volume analysis. Features:- Parameters for signal optimization and alerts. Usage:- The levels formed by the indicator can be helpful to traders in identifying potential entries, breakouts or reversals. it can assist traders of technical trading background or even pure price action trading.
IBB Candles is a tool that is based on the concept of Inverse Bollinger Bands. It compares price relative to state of the bands and plots candles with different colors defining the current state of the market i.e range | trend | strong trend. As the name suggests IBB(Inverse Bollinger Bands) is a technique which is completely different from the traditional Bollinger Bands and proves to be much more effective in analyzing market. This personal implementation makes this tool a more reliable optio
Horizontal volume bars, Cluster analysis, Volume profile Volume in Range gets information about the accumulated volume in a specified vertical range and period in bars. The received data is then plotted on the chart as rectangular boxes with the volume quantity inside. Usage:- The tool acts as a support resistance levels but most importantly it should be used to check in which direction the price breaks out of the significant levels formed by this indicator and then actions to be taken on correc
Market structures, Market balance, Range breakouts This tools helps to identify areas of market ranges, structures and plots colored boxes on breakout of those areas. User is given the option to receive alerts and notifications on the formation of the blocks. The tool has the ability to become an essential part of a technical trading system or even pure price action trading. Usage:- An essential tool for price action or technical traders.  More information in the blog
Market Fractal Analysis, Fractal Swing, Market Flow Fractal Cycles looks for Similar Patterns in the Market that repeat themselves because of the Market Fractal Nature. These patterns are displayed with help of Graphical Objects and Alerts can be received on their arrival. Read the   Blog   for full information. Features:- Auto Detection of Patterns Customization for Color and Line Styles Alerts, Emails & Push Notifications
The indicator is designed to detect range market or consolidation areas on the chart. It does this by using the market volatility and price momentum. The indicator signals the start and stop of the range with icons on the chart and various  type of alerts options provided in the input settings. Usage: The indicator can be used to check the state of the market i.e. trending or ranging to make appropriate decision and use strategies designed for specific market state. Please see the attached video
Filtrer:
Aucun avis
Répondre à l'avis