• Información general
  • Comentarios
  • Discusión

Managed Trades

This utility is specifically designed for No Nonsense Forex traders.

What it does:-

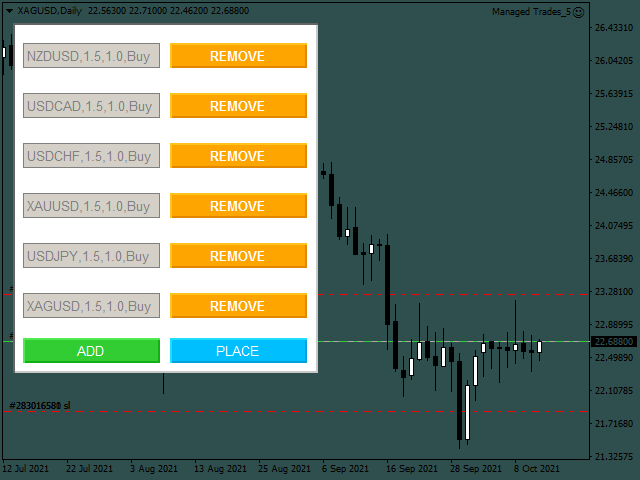
  • Let traders add or remove symbols to trade
  • Editable boxes in panel for updating inputs
  • Automatically applies money management to the trades
  • Places all orders with a single click 

How it calculates:-

  • Two trades are opened per symbol
  • By default max risk per trade is 1%
  • By default total risk is 6% which can changed in inputs tab(recommended to keep it 6 or below) 
  • On addition of symbols the total risk will be divided equally among all assets. For example if total added symbols are 6 then risk will be 1% per symbol and 0.5% per trade
  • Risk can be by account balance or equity which can be selected in inputs tab also
  • Volatility metric for lot calculation is ATR(Average True Range)
  • Editable inputs are in format(Symbol,Stop loss multiplier,Take profit multiplier,Order type). The first input is a constant and doesn't need to be changed

What it doesn't do:-

The utility doesn't check if sessions are opened for all added symbols so the user needs be aware of the session status of the symbol added. Roll over times need to taken into consideration also.

Productos recomendados
Golden Flash Scalper
Felipe Jose Costa Pereira
Golden Scalper XAU/USD – El Indicador Perfecto para el Trading de Scalping en Oro (XAU/USD) Si eres un trader en el mercado de oro (XAU/USD) y estás buscando una herramienta poderosa para maximizar tus ganancias con una estrategia de scalping eficiente, entonces Golden Scalper XAU/USD es la opción perfecta para ti. Este indicador utiliza técnicas avanzadas de reconocimiento de patrones para ofrecerte señales de entrada altamente precisas , asegurando que cada operación esté respaldada por datos
Program Overview: This program is a trading tool designed to monitor and analyze the 7 major currency pairs. It is a variant of a similar program used for tracking stock indices, but this version focuses on the seven major currency pairs. The program helps in identifying and calculating significant price movements (gaps) between the high and low prices of these currency pairs over a specified time frame. It then provides insights through comments and alerts based on the calculated gaps. Major Cu
The indicator allows you to trade binary options. The recommended time frame is М1 and the expiration time is 1,2,3 minutes. The indicator suitable for auto and manual trading. A possible signal is specified as a arrows above/under a candle. You should wait until the candle closes! Arrows are not re-painted Trade sessions: TOKYO section (Half-end) Currency pairs: USD/JPY Working time frame: M1 Expiration time: 1,2,3 minutes. The indicator also shows good results when using the martingale strateg
FREE
Super Reversal Pattern
Parfait Mujinga Ndalika
Super Reversal Pattern Indicator Unlock the power of advanced pattern recognition with our Super Reversal Pattern Indicator. Designed for traders seeking precision and reliability, this indicator identifies one of the most effective reversal patterns in technical analysis, offering a significant edge in your trading strategy. Key Features: Non-Repainting Accuracy: Enjoy the confidence of non-repainting technology. Once a Super Reversal Pattern is detected, it remains static, providing consiste
Antabod Gamechanger
Rev Anthony Olusegun Aboderin
*Antabod GameChanger Indicator – Transform Your Trading!*   Are you tired of chasing trends too late or second-guessing your trades? The *Antabod GameChanger Indicator* is here to *revolutionize your trading strategy* and give you the edge you need in the markets!   Why Choose GameChanger? *Accurate Trend Detection* – GameChanger identifies trend reversals with *pinpoint accuracy*, ensuring you enter and exit trades at the optimal time.   *Clear Buy & Sell Signals* – No more guesswork! T
VR Cub
Vladimir Pastushak
VR Cub es un indicador para obtener puntos de entrada de alta calidad. El indicador fue desarrollado para facilitar los cálculos matemáticos y simplificar la búsqueda de puntos de entrada a una posición. La estrategia comercial para la cual se diseñó el indicador ha demostrado su eficacia durante muchos años. La simplicidad de la estrategia comercial es su gran ventaja, que permite que incluso los operadores novatos negocien con éxito con ella. VR Cub calcula los puntos de apertura de posiciones
Master Scalping M1 es un indicador innovador que utiliza un algoritmo para determinar la tendencia de forma rápida y precisa. El indicador calcula el tiempo de apertura y cierre de posiciones, los algoritmos del indicador le permiten encontrar los momentos ideales para ingresar a una operación (comprar o vender un activo), lo que aumenta el éxito de las transacciones para la mayoría de los comerciantes. Beneficios del indicador: Fácil de usar, no sobrecarga el gráfico con información innecesari
Daily Candle Predictor es un indicador que predice el precio de cierre de una vela. El indicador está destinado principalmente para su uso en gráficos D1. Este indicador es adecuado tanto para el comercio de divisas tradicional como para el comercio de opciones binarias. El indicador se puede utilizar como un sistema de negociación independiente o puede actuar como una adición a su sistema de negociación existente. Este indicador analiza la vela actual, calculando ciertos factores de fuerza dent
Horizontal tick volumes (HTV) Horizontal tick volumes - an easy and convenient indicator of a horizontal market profile in a user-selected time. Produces a visual image of strong trading levels by maximum peaks past volumes and trading direction by color (sell or buy), and also allows you to detect smaller trading levels by differentiating past volumes. In the "Optimal" mode, when displayed on chart periods up to and including "M30", the data of one-minute bars are used, on H1 and H4 - five-minu
Noize Absorption Index MT4
Ekaterina Saltykova
5 (1)
Noize Absorption Index - is the manual trading system that measures the difference of pressure between bears forces and bulls forces. Green line - is a noize free index that showing curent situation. Zero value of index shows totally choppy/flat market.Values above zero level shows how powerfull bullish wave is and values below zero measures bearish forces.Up arrow appears on bearish market when it's ready to reverse, dn arrow appears on weak bullish market, as a result of reverse expectation. S
Ugenesys AI MT4
Odaine Ramon Mcmillan
5 (1)
uGenesys AI - 90% Accurate Daytrading Indicator Introducing the ultimate forex trading indicator system, uGenesys AI, powered by cutting-edge AI technology and advanced analytical techniques, including Time-Series Analysis and Genetic Algorithms. Our AI-powered trading system leverages the power of time-series analysis to identify trends and patterns in historical price data, allowing traders to make informed predictions about future market movements. By analyzing vast amounts of data, our syst
Blahtech Market Profile
Blahtech Limited
4.53 (15)
Was: $249  Now: $149   Market Profile defines a number of day types that can help the trader to determine market behaviour. A key feature is the Value Area, representing the range of price action where 70% of trading took place. Understanding the Value Area can give traders valuable insight into market direction and establish the higher odds trade. It is an excellent addition to any system you may be using. Blahtech Limited presents their Market Profile indicator for the MetaTrader community. In
Una de las secuencias numéricas se llama "Secuencia de incendios forestales". Ha sido reconocida como una de las secuencias nuevas más bellas. Su característica principal es que esta secuencia evita tendencias lineales, incluso las más cortas. Es esta propiedad la que formó la base de este indicador. Al analizar una serie de tiempo financiera, este indicador intenta rechazar todas las opciones de tendencia posibles. Y solo si falla, entonces reconoce la presencia de una tendencia y da la señal
Description: Please tick "Show object descriptions" in chart properties to enable hrays views That utility converts a trendline into a horizontal ray known as tool for drawing supply and demand zones. Simply create a trendline on a chart and once selected, it will get converted. Ray remains horizontal while dragging.  Quick ray plot: press "R" key to create horizontal ray. It will be snapped to the nearest OHLC value Further versions will be improved. For feature request please post new comm
ICT Kill zone and Macros Indicator mark and display the following zone times on the chart: Kill zones   Kill zone Forex Asian London Open New York Open London Close Central Bank Dealing range Kill zone Indices Asian London Open New York AM New York Lunch New York PM Power Hour Macros London 1 London 2 New York Am 1 New York AM 2 New York Lunch New York PM 1 New York PM 2 Silver bullet London Open New York AM New York PM Sessions Asian London New York Chart The display of  Kill zone , Macro ,
For sure, this indicator has become very popular amongst traders. Through coding this indicator will give you the most accurate levels possible for your trading analysis. We have also added in the ability for you to receive alerts when the price breaks above or below a Support or Resistance lines! HOW TO USE The red rectangles represent your resistance/supply zone. The green rectangles represent your support/demand zone.  BONUS FEATURES We coded this indicator with the ability to switch between
Profile Map
Dmitriy Sapegin
5 (11)
Market Profile helps the trader to identify the behavior if major market players and define zones of their interest. The key feature is the clear graphical display of the range of price action, in which 70% of the trades were performed. Understanding of the location of volume accumulation areas can help traders increase the probability of success. The tool can be used as an independent system as well as in combination with other indicators and trading systems. this indicator is designed to suit
Prop Trade Assistant – Panel de Trading para MT4 Prop Trade Assistant es un panel de trading para la plataforma MetaTrader 4, diseñado para ayudar a los traders a gestionar eficientemente sus operaciones manuales. Esta herramienta calcula las ganancias y pérdidas potenciales, permite establecer límites diarios de ganancias y pérdidas, y cierra automáticamente todas las operaciones cuando se alcanzan estos límites. Características: Cálculo de ganancias y pérdidas Calcula automáticamente las gan
EARLY REMINDER: The Starting price is 65 price will rise soon up to 365$ and then 750$ after first 10 copies of sales. Grab this offer now! Introduction Hello, traders! Welcome to the demonstration of the Forex Beast Indicator , a comprehensive tool designed to assist aspiring traders in navigating the complexities of the forex market. This indicator incorporates seven essential components to provide a well-rounded trading experience: Moving Averages Colored Zones Support and Resistance Levels
Are you tired of plotting fibonacci retracements or extensions manually? This indicator displays fibonacci retracements or extensions automatically, calculated from two different price points, without human intervention or manual object anchoring.  [ Installation Guide | Update Guide | Troubleshooting | FAQ | All Products ] Easy to use Manual anchoring is not needed Perfect for price confluence studies The indicator evaluates if retracements or extensions are needed Once drawn, you can manually
El indicador "Auto FIBO Pro" de Crypto_Forex es una gran herramienta auxiliar para operar. - El indicador calcula y coloca automáticamente en el gráfico los niveles de Fibonacci y las líneas de tendencia locales (color rojo). - Los niveles de Fibonacci indican áreas clave donde el precio puede revertirse. - Los niveles más importantes son 23,6 %, 38,2 %, 50 % y 61,8 %. - Puede usarlo para scalping de reversión o para operar en cuadrículas de zonas. - También existen muchas oportunidades para m
The Best One Scalping Trade Panel functional manual trade panel with risk reward, auto SL by candle ( original solution), lot size calculation, one-click trading, scale in and out of trades (partial close),  Works with all symbols not just currency pairs, perfect works on DAX, NASDAQ, GOLD, ...... I earn every day during live stream on ZakopiecFX - join Me Risk by lot Risk by percent SL by points SL by Candle, Renko, RangeBar ( original solution) TP by point TP by Risk/Reward Auto Trailing by P
Le presentamos el indicador "Candle closing counter", que se convertirá en su asistente indispensable en el mundo del trading. Es por eso que saber cuándo se cerrará la vela puede ayudar: Si usted tiene gusto de negociar usando patrones de la vela, usted sabrá cuando la vela será cerrada. Este indicador le permitirá comprobar si se ha formado un patrón conocido y si hay una posibilidad de negociación. El indicador le ayudará a prepararse para la apertura del mercado y el cierre del mercado. P

The Penta-O is a 6-point retracement harmonacci pattern which usually precedes big market movements. Penta-O patterns can expand and repaint quite a bit. To make things easier this indicator implements a twist: it waits for a donchian breakout in the right direction before signaling the trade. The end result is an otherwise repainting indicator with a very reliable trading signal. The donchian breakout period is entered as an input. [ Installation Guide | Update Guide | Troubleshooting | FAQ | A
TWO PAIRS SQUARE HEDGE METER INDICATOR Try this brilliant 2 pairs square indicator It draws a square wave of the relation between your two inputs symbols when square wave indicates -1 then it is very great opportunity to SELL pair1 and BUY Pair2 when square wave indicates +1 then it is very great opportunity to BUY pair1 and SELL Pair2 the inputs are : 2 pairs of symbols         then index value : i use 20 for M30 charts ( you can try other values : 40/50 for M15 , : 30 for M30 , : 10 for H1 ,
Trade with Gann on your side!! MASTER CIRCLE 360 CIRCLE CHART, originally created by Gann admitted that this is “The Mother of all charts”. It is one of the last studies that this great trader left for us. The numeric tab le is apparently quite simple like all the tables and is based on square numbers, the SQUARE OF 12 and is by evolution, one of the most important square numbers. Here we can find CYCLE, PRICE AND TIME thanks to angles and grades, to show past and future support and resistance.
Cosmic Diviner X Planet
Olena Kondratenko
4 (2)
This unique multi-currency strategy simultaneously determines the strength of trends and market entry points, visualizing this using histograms on the chart. The indicator is optimally adapted for trading on the timeframes М5, М15, М30, Н1. For the convenience of users, the indicator renders the entry point (in the form of an arrow), recommended take profit levels (TP1, TP2 with text labels) and the recommended Stop Loss level. The take profit levels (TP1, TP2) are automatically calculated for
Real-time spread tracking and monitoring software Displays spread values in form of histograms on current timeframe of chart Convenient for analyzing spread changes, as well as for comparing trading conditions of different brokers By placing on desired chart, the spread changes at different trading times are displayed Additionally Fully customizable Works on any instrument Works with any broker
Angry bull Option Binary
Fabio Oliveira Magalhaes
1 (1)
Angry Bull Option Binary   This is a Binary Options robot, which contains 7 strategies, you can backtest it to check what the best strategies are Settings Initial Batch Value Dynamic Investment = If activated it will use an automatic lot according to its capital Balance ($) w/ backtest = Starting balance to backtest PorcRiscoInvestment = It will be the value of % for the automatic lot if it is activated Expiration (in minutes) = It will be the expiration time of orders in Binary Options Magic
La singularidad de este indicador radica en el algoritmo de contabilidad de volumen: la acumulación se produce directamente para el período seleccionado sin referencia al comienzo del día. Las últimas barras se pueden excluir del cálculo, entonces los datos actuales tendrán menos influencia en los niveles significativos (volúmenes) formados anteriormente. Para un cálculo más preciso, los datos del gráfico M1 se utilizan de forma predeterminada. El paso de distribución de los volúmenes de precios
Los compradores de este producto también adquieren
Trade Assistant MT4
Evgeniy Kravchenko
4.43 (183)
Ayuda a calcular el riesgo por operación, la fácil instalación de una nueva orden, gestión de órdenes con funciones de cierre parcial, trailing stop de 7 tipos y otras funciones útiles. Materiales e instrucciones adicionales. Instrucciones de instalación - Instrucciones para la aplicación - Versión de prueba de la aplicación para una cuenta demo Función de línea -   Muestra en el gráfico la línea de apertura, Stop Loss, Take Profit. Con esta función es fácil establecer una nueva orden y ver su
Local Trade Copier EA MT4
Juvenille Emperor Limited
5 (90)
Experimente una copia de operaciones excepcionalmente rápida con Local Trade Copier EA MT4 . Con su fácil configuración de 1 minuto, este copiador de operaciones le permite copiar operaciones entre múltiples terminales de MetaTrader en la misma computadora con Windows o en Windows VPS con velocidades de copiado ultra rápidas de menos de 0.5 segundos. Ya seas un trader principiante o profesional, el Local Trade Copier EA MT4 ofrece una amplia gama de opciones para personalizarlo según tus necesi
Bienvenido a Trade Manager EA: la herramienta definitiva de gestión de riesgos diseñada para hacer que el trading sea más intuitivo, preciso y eficiente. No es solo una herramienta para realizar órdenes; es una solución integral para la planificación de operaciones, gestión de posiciones y control del riesgo. Ya seas un principiante, un trader avanzado o un scalper que necesita ejecuciones rápidas, Trade Manager EA se adapta a tus necesidades, ofreciendo flexibilidad en todos los mercados, desde
Trade Manager MT4 DaneTrades
Levi Dane Benjamin
4.4 (10)
Trade Manager para ayudarle a entrar y salir rápidamente de operaciones mientras calcula automáticamente su riesgo. Incluye funciones que le ayudarán a evitar el exceso de operaciones, las operaciones de venganza y las operaciones emocionales. Las operaciones se pueden gestionar automáticamente y las métricas de rendimiento de la cuenta se pueden visualizar en un gráfico. Estas características hacen que este panel sea ideal para todos los operadores manuales y ayuda a mejorar la plataforma MetaT
Grid Manual MT4
Alfiya Fazylova
4.71 (17)
Grid Manual es un panel de negociación para trabajar con una cuadrícula de órdenes. La utilidad es universal, tiene configuraciones flexibles y una interfaz intuitiva. Funciona con una cuadrícula de pedidos no solo en la dirección de promediar pérdidas, sino también en la dirección de aumentar las ganancias. El usuario no necesita crear y mantener una cuadrícula de pedidos, la utilidad lo hará. Basta con abrir un pedido y el "Grid manual" creará automáticamente una grilla de pedidos para el mism
Exp COPYLOT CLIENT for MT4
Vladislav Andruschenko
4.69 (65)
Copiadora comercial para MetaTrader 4. Copia operaciones de forex, posiciones, pedidos de cualquier cuenta. Es una de las mejores copiadoras comerciales   MT4 - MT4, MT5 - MT4 para la versión  COPYLOT MT4  (o MT4 - MT5 MT5 - MT5 para la versión COPYLOT MT5 ). Versión MT 5 Descripción completa +DEMO +PDF Cómo comprar Cómo instalar    Cómo obtener archivos de registro    Cómo probar y optimizar    Todos los productos de Expforex Versión copiadora para  MetaTrader 5 terminal (МТ5 - МТ5, МТ4 - МТ5
El MT4 to Telegram Signal Provider es una herramienta fácil de usar y completamente personalizable que permite enviar señales a Telegram, transformando su cuenta en un proveedor de señales. El formato de los mensajes es completamente personalizable! Sin embargo, para un uso sencillo, también puede optar por una plantilla predefinida y habilitar o deshabilitar partes específicas del mensaje. [ Demo ]  [ Manual ] [ Versión MT5 ] [ Versión Discord ] [ Canal de Telegram ] Configuración Está disponi
HFT Fast Scalping EA
Sami George Saba Zeidan
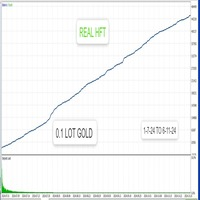
HFT FAST SCALPING EA the High Frequency Trading which use stop orders to enter the trades when market is trending. Limited price $350 is only for 10 first sales. After 10 sales, the price will be raised +$100. Final price for  HFT FAST SCALPING EA    $1200 STARTING FROM 1 JANUARY 2025. best use for 1- Low slippage brokers for us30 and DE40 . 2- LOW OR ZERO COMMISSION BROKERS FOR EUR AND GOLD. 3-Prop firms like ftmo ,tff,.......etc This EA UNLIKE Other HFT EAs , You can see that in the parame
Forex copier
Alexandr Bryzgalov
We offer simple and reliable software that can  copy trades  between any MT4 accounts. Easy to use MetaTrader copier which saves valuable time Reliable, so you are protected from technical issues Powerful, with a lot of features available Who can use this MT4 copier? Forex Copier is a solution for individual traders or account managers who need to execute trade signals from external sources or who need to  manage several MetaTrader 4 accounts  at the same time. We do not offer you “yet another
TradePanel MT4
Alfiya Fazylova
4.9 (86)
Trade Panel es un asistente comercial multifuncional. La aplicación contiene más de 50 funciones comerciales para operaciones manuales y le permite automatizar la mayoría de las acciones comerciales. Atención, la aplicación no funciona en el probador de estrategias. Antes de comprar, puede probar la versión demo en una cuenta de demostración. Versión de demostración aquí . Instrucciones completas aquí . Comercio. Permite realizar operaciones comerciales con un solo clic: Abrir órdenes y posicion
Trade Dashboard MT4
Fatemeh Ameri
5 (46)
Tired of complex order placement and manual calculations? Trade Dashboard is your solution. With its user-friendly interface, placing orders becomes effortless, by a single click, you can open trades, set stop loss and take profit levels, manage trade lot size, and calculate risk to reward ratios, allowing you to only focus on your strategy. Say goodbye to manual calculations and streamline your trading experience with Trade Dashboard. Download  Demo Version  right now. You can find  Details of
¡Vea instantáneamente su historial de operaciones cerradas por día y semana, sus operaciones abiertas actuales y su exposición al mercado de divisas en un solo gráfico! Utilice el mapa de calor para identificar operaciones rentables y dónde se encuentra su reducción actual dentro de su cartera de operaciones. Botones de cierre rápido Utilice los botones de cierre rápido para cerrar cada operación en un solo símbolo, cerrar operaciones individuales en su totalidad o tomar ganancias o pérdidas p
Custom Alerts MT4
Daniel Stein
5 (6)
Custom Alerts: Monitorea varios mercados y no te pierdas ninguna oportunidad clave Descripción general Custom Alerts es una solución dinámica para traders que desean una forma consolidada de seguir posibles setups en múltiples instrumentos. Al integrar datos de nuestras herramientas principales —como FX Power, FX Volume y IX Power—, Custom Alerts te notifica automáticamente sobre eventos cruciales del mercado sin que tengas que manejar múltiples gráficos o arriesgarte a perder oportunidades im
Trade copier MT4
Alfiya Fazylova
4.52 (29)
Trade Copier es una utilidad profesional diseñada para copiar y sincronizar operaciones entre cuentas comerciales. La copia ocurre desde la cuenta / terminal del proveedor a la cuenta / terminal del destinatario, instalada en la misma computadora o vps. Antes de comprar, puede probar la versión de demostración en una cuenta de demostración. Versión de demostración aquí . Instrucciones completas aquí . Principales funcionalidades y beneficios: Admite la copia de MT4> MT4, MT4> MT5, MT5> MT4, incl
The product will copy all telegram signal to MT4   ( which you are member  ) , also it can work as remote copier.  Easy to set up, copy order instant, can work with almost signal formats, image signal, s upport to translate other language to English Work with all type of channel or group, even channel have "Restrict Saving Content", work with  multi channel, multi MT5 Work as remote copier: with signal have ticket number, it will copy exactly via ticket number. Support to backtest signal. How to
Trade Assistant Pro 36 in 1
Makarii Gubaydullin
4.95 (19)
Herramienta multifuncional con más de 65 funciones, incluidas: Calculadora de lotaje, Acción del precio, Calculo RR, Gestor de posiciones, Zonas de Oferta y Demanda Versión demo   |   Manual de usuario   |   MT5 La utilidad no funciona en el probador de estrategias: puede descargar la Versión Demo AQUÍ para probar el producto. Pongase en contacto conmigo para cualquier pregunta / ideas para mejorar / en caso de encontrar un problema Simplifica, acelera y automatiza su operativa de trading. Aume
Copiadora->Interfaz de interacción cómoda y rápida, los usuarios pueden usarla de inmediato       ->>>> Recomendado para usar en computadoras Windows o VPS Windows Características: Configuraciones de copy trading personalizadas y diversificadas: 1. Se pueden configurar diferentes modos de lote para diferentes fuentes de señal 2. Se pueden configurar diferentes fuentes de señal para copy trading hacia adelante y hacia atrás 3. Las señales se pueden configurar con comentarios 4. Si se debe calibr
The Expert Advisor will help you forward all pop-up alert with screenshot from  MetaTrader 4 to Telegram channel/ group, also forward all notifications to Telegram. Parameters  -  Telegram Bot Token - create bot on Telegram and get token.  -  Telegram Chat ID  - input your Telegram user ID,  group / channel ID  -  Forward Alert - default true, to forward alert.  -  Send message as caption of Screenshot - default false, set true to send message below Screenshot  How to setup and guide  - Telegram
Exp SafetyLock PRO
Vladislav Andruschenko
4.7 (27)
SAFETYLOCK ofrece a los operadores una solución avanzada para protegerse contra las fuertes reversiones del mercado, colocando de manera automática una orden opuesta para cualquier posición ya abierta. Cuando un operador o un EA abre una posición, SAFETYLOCK crea inmediatamente una orden pendiente opuesta. Si la posición comienza a generar pérdidas, esta orden pendiente se activa, formando un bloqueo (lock) que minimiza el riesgo y protege su capital. Este potente EA ofrece una amplia gama de o
Trend Line Optimizer
Evgenii Aksenov
4.06 (18)
Este es un optimizador de parámetros automático para el indicador Trend Line PRO Fácil y rápidamente, seleccionará los parámetros óptimos para su indicador favorito Trend Line PRO.  La optimización toma solo unos segundos. El optimizador le permite encontrar los mejores parámetros para cada par y período: Amplitude, TP1-TP3, StopLoss, así como los valores para Time Filter y HTF Filter en la sección seleccionada de la historia (Days)  Para optimizar diferentes Marcos de tiempo, necesita un rang
Edge Zone EA
FXsolutions
5 (1)
With this Expert Advisor you will follow the sound trading principle Buy Low and Sell High by default ! And you can do that even with a normal day job . You will be even able to trade on lower timeframes which you could never do without such an Expert Advisor. And the best thing is that you are in control! You can tell the Edge Zone EA where it has to enter and where it has to exit. And you can do that even many hours before the trade will occur . This EA is therefore an excellent assistant for
Una estrategia de arbitraje triangular explota las ineficiencias entre tres pares de divisas relacionados, colocando transacciones de compensación que se cancelan entre sí para obtener una ganancia neta cuando se resuelve la ineficiencia. Un trato implica tres intercambios, intercambiando la moneda inicial por una segunda, la segunda moneda por una tercera y la tercera moneda por la inicial. Con la tercera operación, el arbitrajista asegura una ganancia sin riesgo de la discrepancia que existe c
Zone Trader MT4
LEE SAMSON
5 (2)
Opera con soporte y resistencia o con zonas de oferta y demanda automáticamente una vez que hayas identificado las áreas clave desde las que quieres operar. Este EA te permite dibujar zonas de compra y venta con un solo clic y luego colocarlas exactamente donde esperas que gire el precio. El EA luego monitorea esas zonas y automáticamente tomará operaciones en función de la acción del precio que especifiques para las zonas. Una vez que se realiza la operación inicial, el EA obtendrá ganancias e
Auto Trade Copier
Vu Trung Kien
4.7 (90)
El Asesor Experto Auto Trade Copier se utiliza para copiar las operaciones en varias cuantas/terminales de MetaTrader 4 con una precisión de 100%. Utilizando esta herramienta Usted puede actuar como proveedor (fuente), o bien como receptor. Todas las acciones de trading serán copiadas desde el proveedor hasta el receptor sin retardos. Demo: Puede descargar su versión demo para probarla: https://www.mql5.com/es/market/product/4904 Información: Si quiere realizar el copiado a varios ordenadores ví
FSS Report
Bao Ying Huang
5 (2)
This is a professional report statistical indicator, which can be counted by day, week, month, quarter, year, magic and comment, and display the growth curve. install: select "File" in your MT4 client,and open the folder "MQL4\indicators",then copy file "FSS_Report.ex4",reload MT4 and enjoy. Para List: UI_XY_Setting=21 UI_X_default=0 UI_Y_default=21 custom_title=FSS Report UI_reload_time_interval=5 report_time_from=0 report_time_to=0 filter_demo=____________symool, magic and comment, all supp
Account Info Manager (AIM)   es una utilidad diseñada para ver información sobre los resultados del trabajo de los asesores en una cuenta comercial. La utilidad puede agrupar órdenes por sus magias o comentarios, lo que permite analizar por separado los resultados del trabajo de cada Asesor Experto que negoció en la cuenta. Con esta utilidad, puede ver información sobre el número de pedidos abiertos por el asesor, el porcentaje de pedidos ganadores, el valor de beneficio, el factor de beneficio,
CAP Strategy Builder EA
MEETALGO LLC
4.84 (31)
The top-selling EAs on the market cost a lot and one day they are suddenly gone. This is because one strategy will not work in the forex market all the time. Our product is unique from all others in the MQL Marketplace because our EA comes with 34+ built-in indicators that allow adding more strategies every time.  You build your strategy and keep updating it. If one strategy does not work, simply build another all using only one EA. This is All-In-One EA in this market place. You can use as trad
Summer 40% discount ($149 -> $88) Everything for chart Technical Analysis indicator mt4 in one tool Draw your supply demand zone with rectangle and support resistance with trendline and get alerts to mobile phone or email alert -  Risk reward indicator Video tutorials, manuals, DEMO download   here .  Find contacts on my   profile . 1.   Extended rectangles and trendlines Object will be extended to the right edge of the chart when price will draw new candles on chart. This is rectangle extende
DrawDown Limiter MT4
Haidar, Lionel Haj Ali
5 (8)
Drawdown Limiter EA You are in the right place if you were searching for Drawdown control, Drawdown limiter, Balance protection, Equity Protection or Daily Drawdown Limit related to Prop Firm, FTMO, or Funded account trading, or if you want to protect your trading account. Have you suffered from controlling your drawdown when trading funded accounts? This EA is meant for you. Prop firms usually set a rule called “Trader Daily Drawdown”, and if it is not respected, you are disqualified.  I am an
Engulfing Dashboard is a forex system that can help you generate forex profits easily without having to work hard to learn forex knowledge because this Dashboard is complete with all the facilities and functions that are sophisticated and effective. This system is made based on Supply and Demand techniques to measure Market Direction (trend) more accurately than using indicators such as Moving Average, MACD, trendline and so on. It is made using a certain formula so that the accuracy of the mar
Otros productos de este autor
IBB Candles is a tool that is based on the concept of Inverse Bollinger Bands. It compares price relative to state of the bands and plots candles with different colors defining the current state of the market i.e range | trend | strong trend. As the name suggests IBB(Inverse Bollinger Bands) is a technique which is completely different from the traditional Bollinger Bands and proves to be much more effective in analyzing market. This personal implementation makes this tool a more reliable option
CMA dashboard is designed to help traders in identifying trend on multiple timeframes and symbols. It displays a clear state of the overall trend at one place without the need to navigate between different charts and timeframes. This saves time and makes decision making process fast so that potential opportunities are not missed. It is based on Corrected moving averages available here Features Parameters for signal optimization Inputs for multiple timeframes and symbols  Usage Higher timeframe
Renko bars builder
Navdeep Singh
4.2 (5)
The indicator builds a Renko chart in the sub window for the current symbol. The bars are formed from live data and the desired bar size can be set in the inputs tab. Most importantly, because the Renko chart only uses price to construct bars and ignores time, the indicator can be applied to any time frame and same results can be achieved. Recommended usage As Renko charts are famous for eliminating noise so traders can use this tool to see clear picture of the trend to help their analysis, entr
FREE
ZigZag New
Navdeep Singh
4 (2)
Informative & optimized Zigzag, Accumulated volume, Price change   A rewrite of the traditional zigzag tool with new additions. Features:- Optimized code Displays accumulated volume between peaks Displays price change between peaks Usage:- Identify trend swings Identify high volume swings Compare price changes between swings Drawing Fibonacci tool on strong price change or high volume swings
FREE
RSI Scanner, Multiple Symbols and Timeframes, Graphical User Interface An indicator that scans multiple symbols added from the market watch and timeframes and displays result in a graphical panel. Features: Multi symbol Multi timeframe Alerts and Notifications Live Monitoring Sorting modes One click to change symbol and timeframe Inputs for RSI and scanner settings
FREE
ADR Bands
Navdeep Singh
4.5 (2)
Average daily range, Projection levels, Multi time-frame ADR bands shows levels based on the selected time-frame. Levels can be used as projections for potential targets, breakouts or reversals depending on the context in which the tool is used. Features:- Multi time-frame(default = daily) Two coloring modes(trend based or zone based) Color transparency  
FREE
50+ Candlestick Patterns, Simulated Trading Results, Top Five Performers Candle Analysis extends Candlesticks Pattern Analysis by not only identifying Patterns but also recording the Past Performance of the Patterns. What it Does:- Identifies and plots results on chart Displays Top Patterns for both Bullish and Bearish type.  Log can be printed in experts tab to see Simulated Trading results Displays All or Selected Patterns Alerts on Pattern formation More detailed information in   Blog
RSI Scanner, Multiple Symbols and Timeframes, Graphical User Interface An indicator that scans multiple symbols added from the market watch and timeframes and displays result in a graphical panel. Features: Multi symbol Multi timeframe Alerts and Notifications Live Monitoring Sorting modes One click to change symbol and timeframe Inputs for RSI and scanner settings
FREE
Algorithmic Signals indicator   is not an indicator but a strategy that generates entry/exit signals. The entry arrows are formed after multiple conditions are met. The indicator is using an   Adaptive Algorithm   which automatically adjust to the symbol and time frame (see the screenshots below) . Signals can be used for scalping or even trend trading. Main features:- Non repainting signals Entry signals Exit signals Alert for price reaching 1 x ATR(14) (could be utilized for initial take prof
Stochastic force is an advanced version of the stochastic oscillator. Instead of using the regular price a more efficient price data is provided as an input for the oscillator which takes into account the price efficiency, volume and market noise. Also price is pre-filtered with the selected average type and then post-filtered by a hull moving average which provides a smooth transition of the oscillator. It eliminates maximum false signals and has the potential to become an integral part of any
This is the new version of the Algorithmic signals featuring a new algorithm. It is a blend of technical and candlestick analysis. Candlestick analysis are often ignored while creating technical strategies but this version has a feature to include that and make confirmations more strong.  Usage:- Traders can use the signals for buying and selling assets or even blend their own favorite indicators with it.
TDI Signals generates buy and sell arrows based on a TDI(Traders Dynamic Index) algorithm. It looks for price breakouts, continuations and reversals. By default it runs in the trend mode but user is provided with the option to change that to reversal mode. Trader can use the mode which compliments his/her trading style.  Usage:-   TDI Signals can be used as a stand alone indicator with context or even be added to strategies to make confirmations more strong. Volatility based stop loss, take pro
RSI Levels generates buy and sell arrows based on RSI analysis. Signals are based on extreme levels breakouts and can be further filtered by a volatility metric. Trader can use the mode which compliments his/her trading style.  Features:- Parameters for signal optimization and alerts. Usage:-   RSI Levels can be used as a stand alone indicator with context or even be added to strategies to make confirmations more strong. Volatility based stop loss, take profit & position sizing can be very helpf
The indicator helps the trader in identifying potential liquidity levels. The algorithm used in this indicator checks the behavior of the asset taking into account the price levels, momentum and volume analysis. Features:- Parameters for signal optimization and alerts. Usage:- The levels formed by the indicator can be helpful to traders in identifying potential entries, breakouts or reversals. it can assist traders of technical trading background or even pure price action trading. Examples of
Step force index is a modified version of the famous force index indicator. As the name suggests it incorporates a step feature to filter the force index values thus eliminating small fluctuations in the indicator. It also utilizes the smooth algorithm library thereby providing multiple smoothing options for the index values. This personal implementation makes it a more easy to use and a reliable tool. Main features A wide range of parameters for signals optimization Alerts, emails and push noti
Market structures, Market balance, Range breakouts This tools helps to identify areas of market ranges, structures and plots colored boxes on breakout of those areas. User is given the option to receive alerts and notifications on the formation of the blocks. The tool has the ability to become an essential part of a technical trading system or even pure price action trading. Usage:- An essential tool for price action or technical traders.  More information in the blog
Horizontal volume bars, Cluster analysis, Volume profile Volume in Range gets information about the accumulated volume in a specified vertical range and period in bars. The received data is then plotted on the chart as rectangular boxes with the volume quantity inside. Usage:- The tool acts as a support resistance levels but most importantly it should be used to check in which direction the price breaks out of the significant levels formed by this indicator and then actions to be taken on correc
Price breakouts, Levels, Multi-time frame Inside bars checks for price failure to break from the previous high/low and on breakout draws a breakout box on the chart. The choice of breakout price is given to the user i.e. close or high/low of bar. Alerts can be received on breakouts. Features:- Multi-time frame Alerts, notifications & emails Usage:- Breakout signals Check how price action is evolving with the help of boxes Get multi-time frame bias
Market Fractal Analysis, Fractal Swing, Market Flow Fractal Cycles looks for Similar Patterns in the Market that repeat themselves because of the Market Fractal Nature. These patterns are displayed with help of Graphical Objects and Alerts can be received on their arrival. Read the Blog for full information. Features:- Auto Detection of Patterns Customization for Color and Line Styles Alerts, Emails & Push Notifications 
50+ Candlestick Patterns, Simulated Trading Results, Top Five Performers Candle Analysis extends Candlesticks Pattern Analysis by not only identifying Patterns but also recording the Past Performance of the Patterns. What it Does:- Identifies and plots results on chart Displays Top Patterns for both Bullish and Bearish type.  Log can be printed in experts tab to see Simulated Trading results Displays All or Selected Patterns Alerts on Pattern formation More detailed information in Blog
Stochastic force is an advanced version of the stochastic oscillator. Instead of using the regular price a more efficient price data is provided as an input for the oscillator which takes into account the price efficiency, volume and market noise. Also price is pre-filtered with the selected average type and then post-filtered by a hull moving average which provides a smooth transition of the oscillator. It eliminates maximum false signals and has the potential to become an integral part of any
The indicator helps the trader in identifying potential liquidity levels. The algorithm used in this indicator checks the behavior of the asset taking into account the price levels, momentum and volume analysis. Features:- Parameters for signal optimization and alerts. Usage:- The levels formed by the indicator can be helpful to traders in identifying potential entries, breakouts or reversals. it can assist traders of technical trading background or even pure price action trading.
IBB Candles is a tool that is based on the concept of Inverse Bollinger Bands. It compares price relative to state of the bands and plots candles with different colors defining the current state of the market i.e range | trend | strong trend. As the name suggests IBB(Inverse Bollinger Bands) is a technique which is completely different from the traditional Bollinger Bands and proves to be much more effective in analyzing market. This personal implementation makes this tool a more reliable optio
Horizontal volume bars, Cluster analysis, Volume profile Volume in Range gets information about the accumulated volume in a specified vertical range and period in bars. The received data is then plotted on the chart as rectangular boxes with the volume quantity inside. Usage:- The tool acts as a support resistance levels but most importantly it should be used to check in which direction the price breaks out of the significant levels formed by this indicator and then actions to be taken on correc
Market structures, Market balance, Range breakouts This tools helps to identify areas of market ranges, structures and plots colored boxes on breakout of those areas. User is given the option to receive alerts and notifications on the formation of the blocks. The tool has the ability to become an essential part of a technical trading system or even pure price action trading. Usage:- An essential tool for price action or technical traders.  More information in the blog
Market Fractal Analysis, Fractal Swing, Market Flow Fractal Cycles looks for Similar Patterns in the Market that repeat themselves because of the Market Fractal Nature. These patterns are displayed with help of Graphical Objects and Alerts can be received on their arrival. Read the   Blog   for full information. Features:- Auto Detection of Patterns Customization for Color and Line Styles Alerts, Emails & Push Notifications
The indicator is designed to detect range market or consolidation areas on the chart. It does this by using the market volatility and price momentum. The indicator signals the start and stop of the range with icons on the chart and various  type of alerts options provided in the input settings. Usage: The indicator can be used to check the state of the market i.e. trending or ranging to make appropriate decision and use strategies designed for specific market state. Please see the attached video
Filtro:
No hay comentarios
Respuesta al comentario