Bar Status 9 TFs
- Indicateurs
- Makarii Gubaydullin
- Version: 3.0
- Mise à jour: 9 juillet 2023
- Activations: 5
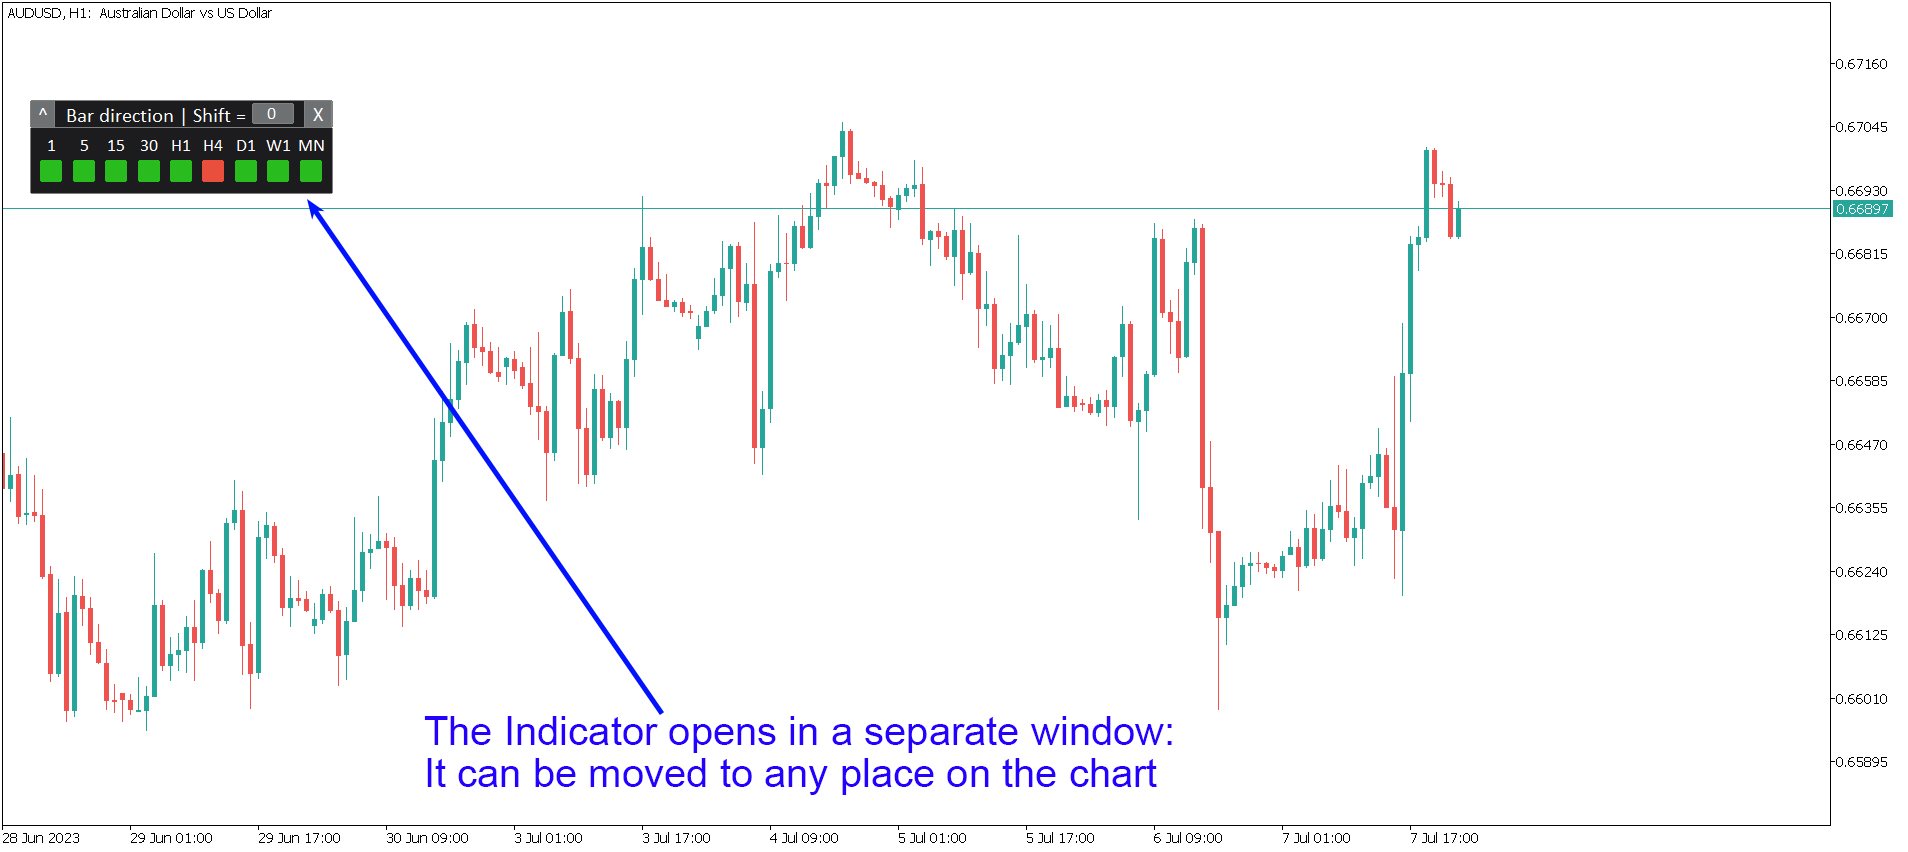
Shows the direction of the bars on all major timeframes.
The meaning of the visual signals (squares):
- Red: Close price is lower than the Open price: Close < Open;
- Green: Close price is higher than the Open price: Close > Open;
- Blue: Close price is equal to the Open price: Close = Open;
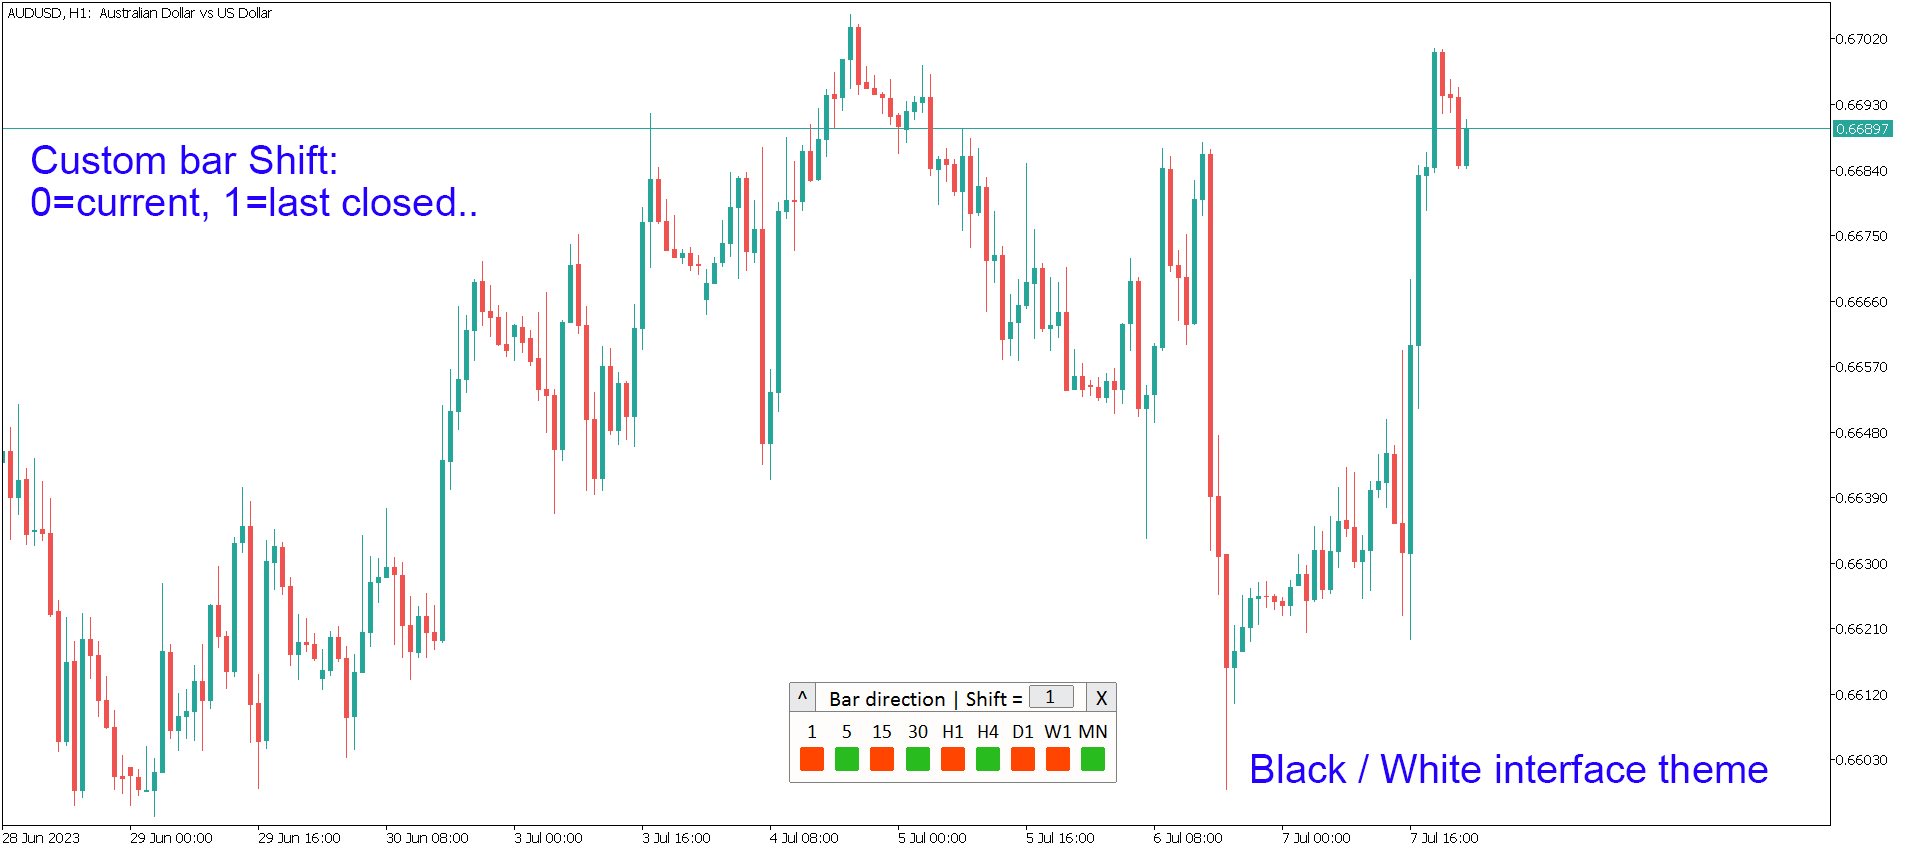
You can set the Shift of the calculated bar, relative to the current bar:
- Shift = 0: the direction of the currenttly open (floating) bars,
- Shift = 1: the direction of the last closed bars (previous),
- Shift = 2: 2 bars away from the current, and so on...
This indicator:
- Helps to see the overall market trend;
- Useful when trading binary options;
- Useful for finding corrective movements;
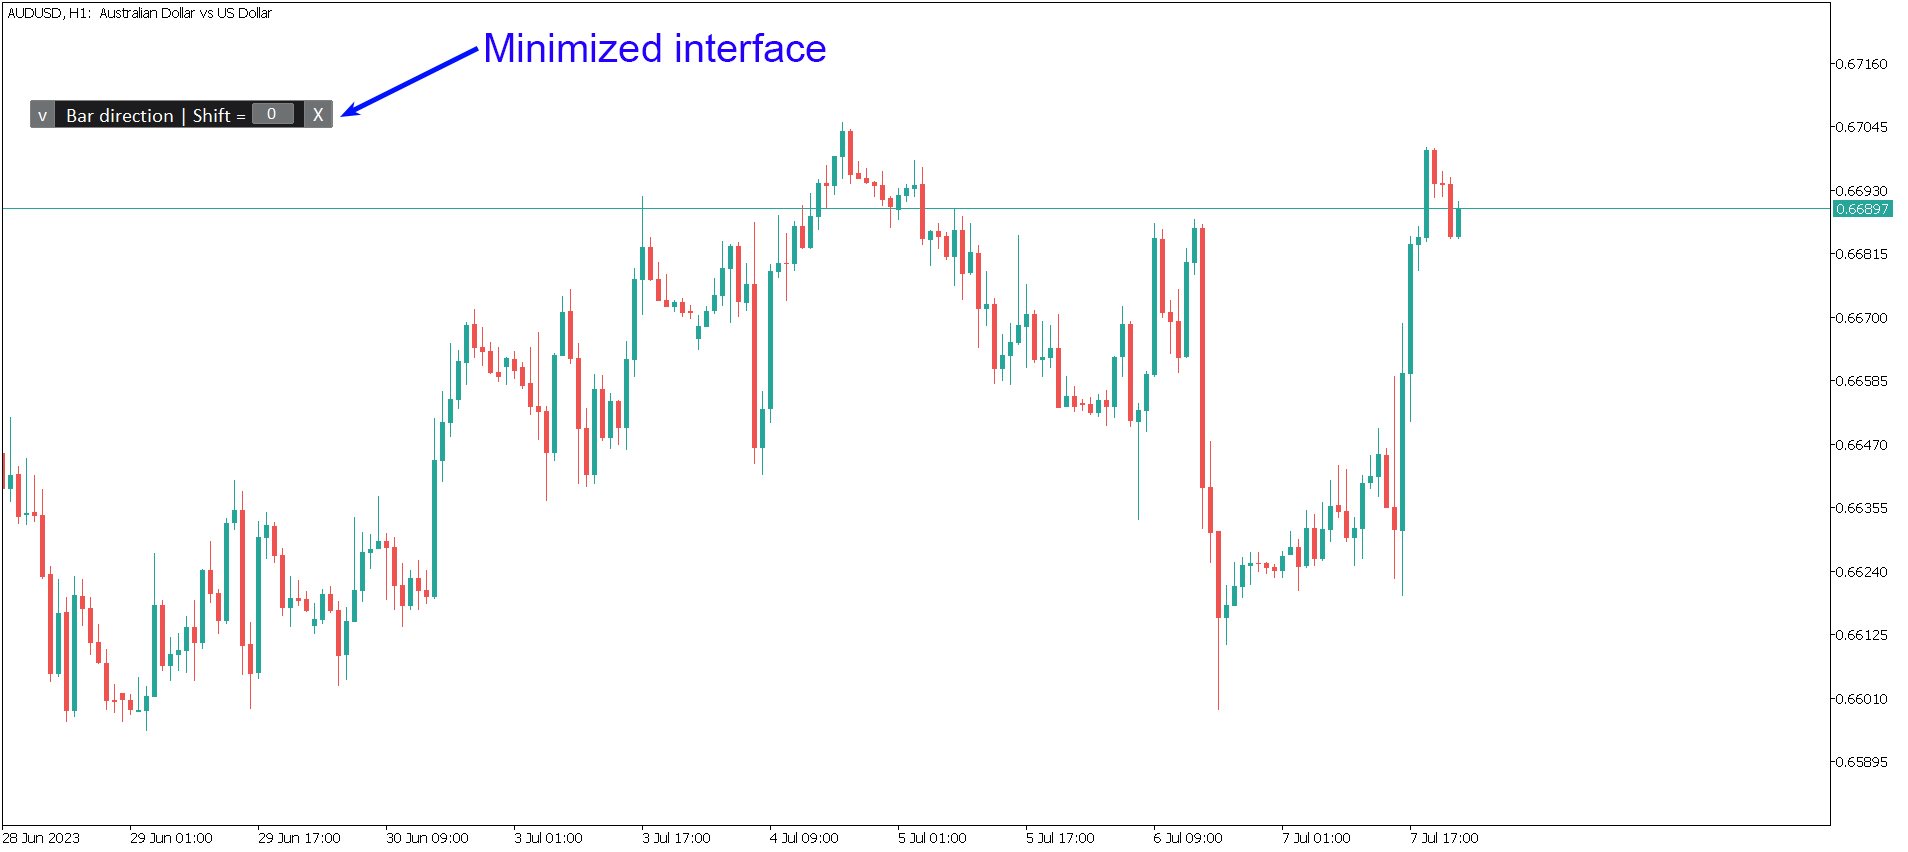
The Indicator opens in a separate window:
- The window can be moved to any place on the chart: drag anywhere;
- The window can also be minimized to save space: [^] button;
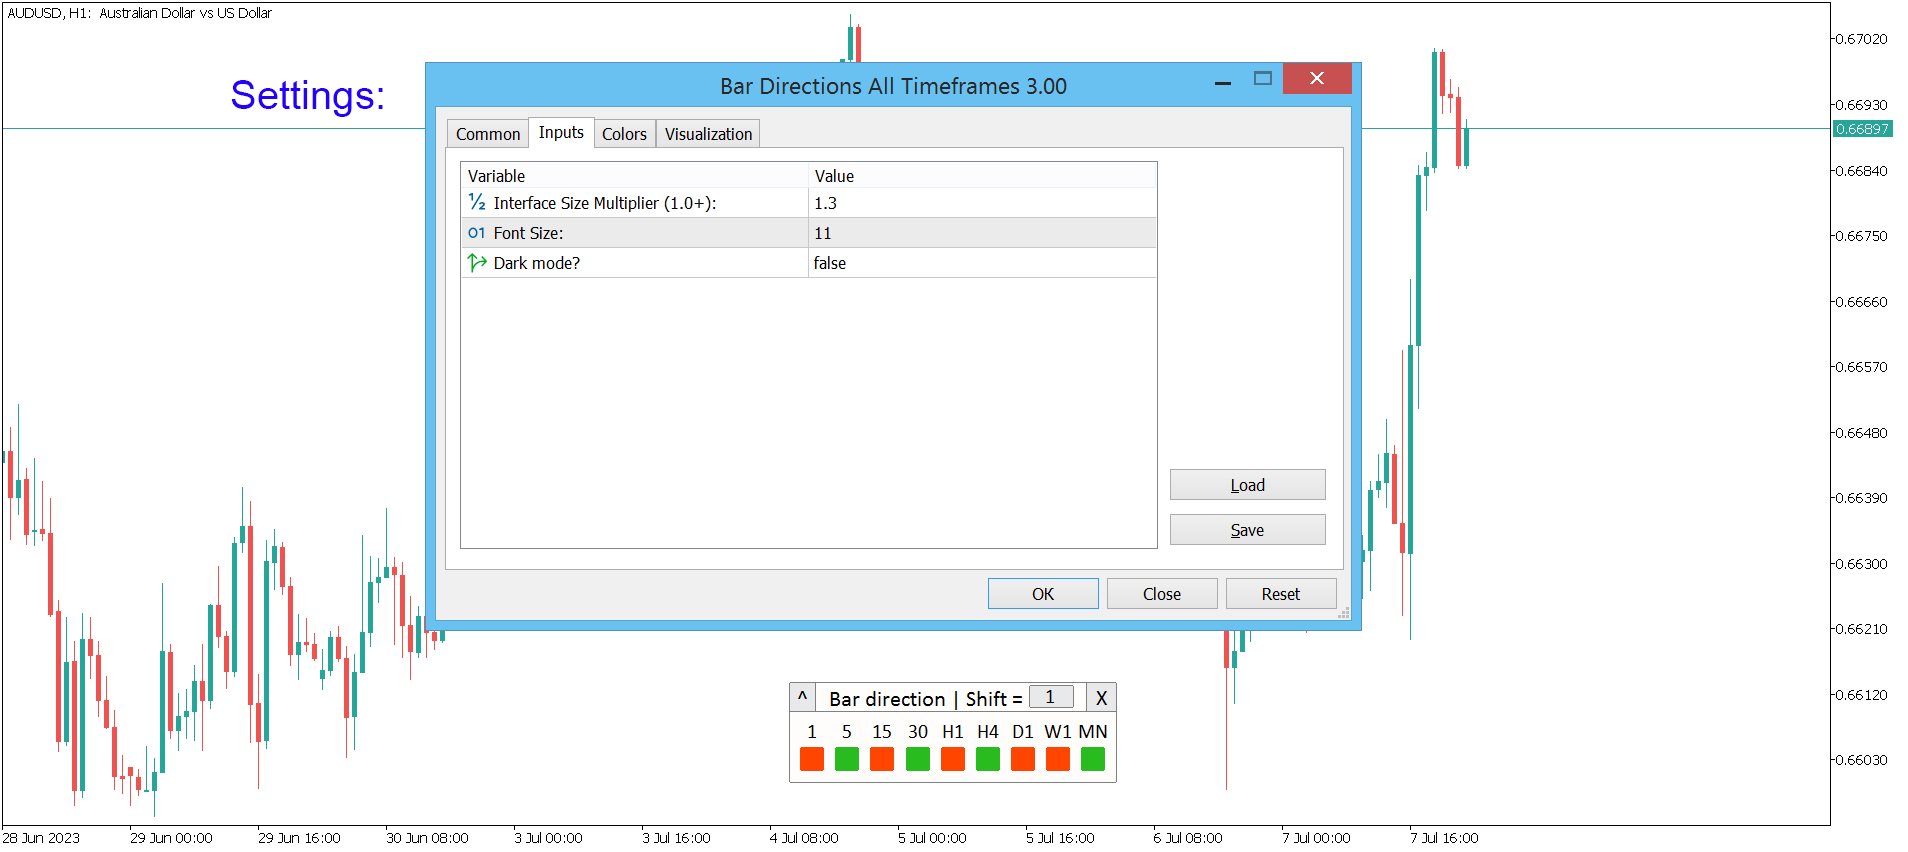
In the settings of the indicator, you can configure:
- Dark / Light interface theme;
- Interface Size Multiplier;
- Font size;
The program file must be placed in the "Indicators" directory.