• Aperçu
  • Avis (1)
  • Commentaires (2)
  • Nouveautés

TheStrat Levels MT5

5

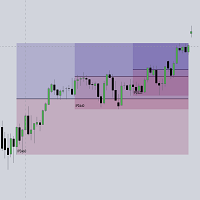
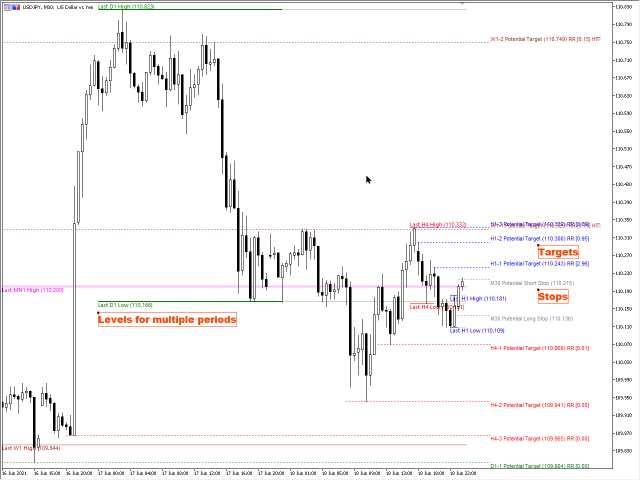
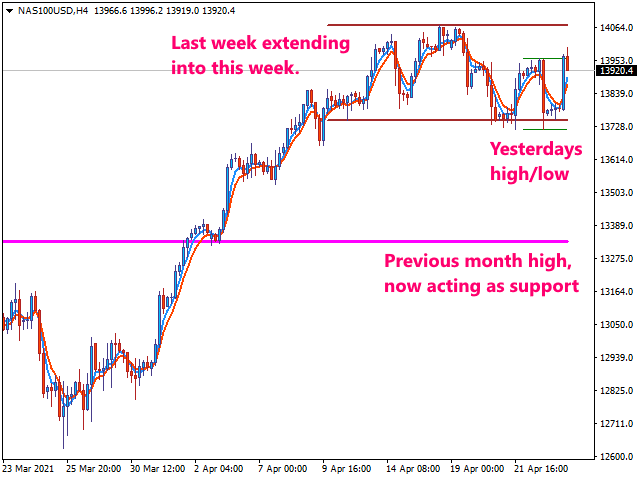
This indicator draws the prior Highs and Lows for multiple timeframes, and can display potential Take Profit and Stop Loss levels.

In Rob Smith's #The Strat terms, these are potential entry points, or alternatively potential targets for open positions. I like to use them in both ways. On a lower timeframe, say 5 minutes to get a good entry on a daily or weekly level, and then as a potential target. Very small stops required giving an excellent risk/reward ratio.

Key Features

 - Levels from Hourly, Four Hourly, Daily, Weekly and Monthly timeframes
 - Potential Take Profit levels
 - Potential Stop Loss levels based on the current or higher timeframe
 - Risk / Reward calculated continuously for each potential target level based on potential stop level
 - Pivot Machine Gun identification
 - Labelling for each level so you can identify what there
 - Comprehensive options to make it look as you wish

    Please watch the DEMO video for more details as the pictures do not do the indicator justice.


    Settings

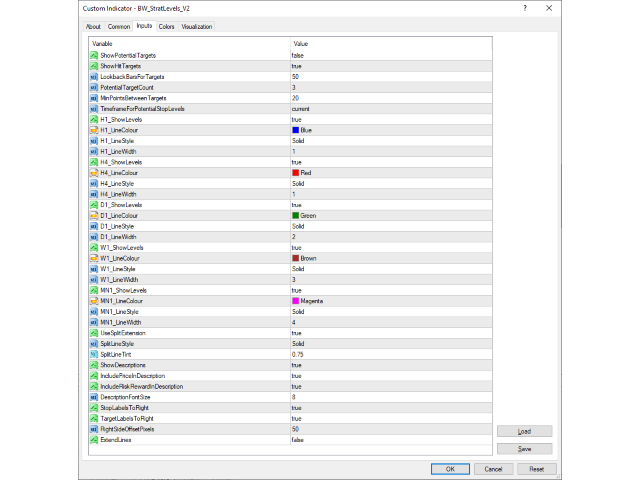
    There are a number of settings, repeated for each timeframe.

    ShowLevels

    When true, the levels are drawn for this timeframe. The lines are drawn from the last period start to the current time. Once a new period is started, the lines will be redrawn to the new levels.

    LineColour

    You can set the line colour to any value from the standard colour selection.

    LineStyle

    The line style can vary from the simple solid line, dots, dashes or dots and dashes.

    LineWidth

    If the line style is solid, the line width can be any value from the selection available, 1 to 5.


    UseSplitExtension

    When set to True, the lines drawn are split into the historic part drawn using the line styles, width and colours above, and the projected part using a modified style based on the following settings.

    SplitLineStyle

    If you wish you can set the line style so it is clearly visibly different to the historic part of the line. If you set it to STYLE_SOLID, then the projected line will retain the width set above.

    SplitLineTint

    You can modify the colour of the projected line by giving it a tint. That is a reduction in intensity of the main colour selected for the historic line set above. The default value here is 0.5 which means halve the intensity of the colour.


    Stop and Target Levels

    ShowPotentialTargets

    When true, potential target levels are shown for each timeframe enabled using the ShowLevels settings.

    ShowHitTargets

    When true, if a target level has been hit it will stay on the chart until the timeframe has expired. Otherwise, once hit, potential target levels are removed.

    LookbackBarsForTargets

    Controls how far back in the history the system should look for target levels. Default is 50 bars.

    PotentialTargetCount

    This allows you to choose how many potential target levels you want to see per timeframe. Default is 3.

    MinPointsBetweenTargets

    Having targets too close together is not very helpful, so this setting allows you to define how many points should be between one target and the next. Calculated per timeframe.

    TimeframeForPotentialStopLevels

    Allows you to choose the timeframe stop loss levels should be calculated from. By default it uses the current timeframe, giving a very tight stop loss.


    Descriptive Labels

    ShowDescriptions

    When true, descriptive labels are drawn for every level shown.

    IncludePriceInDescription

    When true, puts the price value of the level in the description.

    IncludeRiskRewardInDescription

    When true, adds the risk / reward value in the description.

    DescriptionFontSize

    Choose how big the descriptive labels should be.

    StopLabelsToRight

    When true, the labels for stop levels are drawn to the right of the stop level. Set to false, the description will be drawn to the left of the level.

    TargetLabelsToRight

    When true, the labels for target levels are drawn to the right of the stop level. Set to false, the description will be drawn to the left of the level.

    RightSideOffsetPixels

    Allows you to choose how far from the current time the stop and target labels should be drawn. Only relevant if you use StopLabelsToRight or TargetLabelsToRight.


    ExtendLines

    By default, this is false. When True, the lines are extended off to the right hand side of the chart.

    Avis 1
    renetrader07
    135
    renetrader07 2023.11.23 18:24 
     

    This greatly helps with being more mechanical with my trading

    Produits recommandés
    Vanguard's Volatility indicator is based on the analysis of long and short price volatility. It helps to determine market entry points by displaying favorable entry points with arrows. This indicator can be used as a filter in trading or as a tool to show the exact direction of the trend. It is suitable for both scalping on small time intervals and long-term trading. It is important to remember that successful trading requires a comprehensive approach, and additional information is needed to en
    This product is designed for the MT5 platform and offers two key features: VWAP (Volume Weighted Average Price) calculation and Volume Profile analysis. Advantages: VWAP Calculation: The product calculates the VWAP, which is a popular indicator used by traders to determine the average price of a security based on its trading volume. It helps identify potential buying or selling opportunities by comparing the current price to the average price weighted by volume. Volume Profile Analysis: The prod
    Holiday Sales Zones Indicator The Zones Indicator is your everyday Trading tool that  leverages advanced algorithms, including ICT institutional concepts like order blocks , engulfing candle patterns , and Level interactions , to identify critical levels of supply and demand (Resistance & Support). Visual signals are generated and clearly marked on the chart, providing a straightforward guide for traders to spot key opportunities. Key Features Advanced Algorithmic Analysis : Identifies supply
    Automatic Vwap Midas
    Ricardo Almeida Branco
    5 (1)
    The 3 Automatic Vwap (Midas) Indicator can be used for Price and Volume studyers to map the movement of market drivers. It automatically plots 3 Vwaps, two of which are dynamic and will be updated throughout the day if new highs or new lows emerge. The third Vwap is daily and can help if the trend is up or down. Also, an auxiliary indicator that plots (also dynamic) points of interest with OHLC prices (Open, High and Low of the current day and Close of the previous day) was inserted. Success and
    TickDelta
    Andrey Gladyshev
    The TickDelta indicator shows the difference in the number of oscillations of the best prices per unit of time. In this case, the unit of time is the specified timeframe (M1, M2, M5, M15, etc.). This value indirectly shows the market "sentiment". Due to the "tick-wise" nature, the indicator is more appropriate for use in scalping strategies. When applied in conjunction with real volumes and monitoring of various instrument charts, it is possible to identify certain reversal setups. In some cases
    Visual Heatmap Book Analyzer
    Alexandre Moraes De Souza Lima
    Visual Heatmap Book Analyser This indicator monitors the market liquidity and generates colors based on order patterns, quantities, and renewal activities in the book. This allows you to visualize the order flow and identify areas of high and low liquidity and activity. The indicator uses machine learning techniques to analyze the order behavior in the book, enabling it to detect patterns and trends in orders, allowing you to make informed decisions about your trading operations. The color pale
    The chaos wave
    Letlhogo Mokgatle
    This is the best indicator we have created by far, this indicator replicates the well known heiken ashi indicator,  but with a more precise entry point, this indicator can work on all time-frames and is strong on all the time frames , this indicator does not repaint nor does it lag , this indicator strategy combined with price action will change your trading experience , elevate your experience to the next level.
    Adjustable Consecutive Fractals  looks for 2 or more fractals in one direction and sends out a on screen alert, sound alert and push notification, for strong reversal points . Adjustable Consecutive Fractals, shows the fractals on chart along with a color changing text for buy and sell signals when one or more fractals appear on one side of price. Adjustable Consecutive Fractals is based Bill Williams Fractals . The standard Bill Williams fractals are set at a non adjustable 5 bars, BUT withe th
    Vwap Freeze
    Ricardo Almeida Branco
    5 (1)
    The previous day's vwap is used by some traders as a support and resistance point, after all it is one of the ways to consider the fair price of that asset or that pair the day before. Possible defenses can occur in this region indicating a reversal, or triggering stops starting a new, more directional movement. It is a matter of analyzing how it will add to your operational. To avoid manually drawing the previous day's vwaps and saving time for your analysis, use the Vwap Freeze indicator, as
    Displays trends in current chart. You can display trends of multiple timeframes in one chart by inserting this indicator as often as you want. Key features: displays trend line by finding highs and lows counts number of high/low of current trend in different color (long/short) allows you to display multiple timeframe trends in one chart Settings: Indicator Name: if you want to show M5 and H1 on one chart add TITrend twice to your current chart and rename M5 to "TITrendM5" and H1 to "TITrendH1" C
    Anchored VWAP with Alert MT5
    Trade The Volume Waves Single Member P.C.
    5 (1)
    What is the Volume Weighted Average Price (VWAP)? The volume weighted average price (VWAP) is a trading benchmark used by traders that gives the average price an instrument has traded at throughout the day, based on both volume and price.  It is important because it provides traders with insight into both the trend and value of the instrument. What is the Difference between VWAP and AVWAP? While VWAP is having as starting point the beggining of the day,week,month etc. in the AVWAP you can pla
    Market Noise Le bruit du marché est un indicateur qui détermine les phases du marché sur un graphique de prix et distingue également les mouvements de tendance clairs et fluides des mouvements plats et bruyants lorsqu'une phase d'accumulation ou de distribution se produit. Chaque phase est bonne pour son propre type de trading : tendance pour les systèmes qui suivent les tendances et plate pour les systèmes agressifs. Lorsque le bruit du marché commence, vous pouvez décider de quitter les trans
    Buy Sell Visual MTF
    Naththapach Thanakulchayanan
    This MT5 indicator, Bull Bear Visual MTF (21 Time Frames), summarize the strength color graphic and percentages of power for both  Bull and Bear in current market emotion stage which will show you in multi time frames and sum of the total Bull and Bear power strength which is an important information for traders especially you can see all Bull and Bear power in visualized graphic easily, Hope it will be helpful tool for you for making a good decision in trading.
    Volume Trade Levels
    Mahmoud Sabry Mohamed Youssef
    The idea behind this indicator is very simple , First it contains 2 mechanisms to place your trades: 1- Enter the Pips you want to duplicate to price levels. 2- Automatically let the indicator specify the largest Buy / Sell Volume Candle and place duplicated levels based on the candle itself. How it works: 1- Enter the Pips you want to duplicate to price levels:    1- once the indicator is loaded you will need first to Specify the number of pips in the indicator Configuration window ,you can g
    ScalperGun
    Mikhail Nazarenko
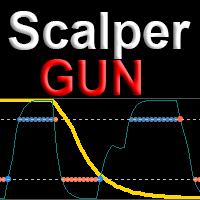
    Scalper gun  - главное оружие для торговли скальпингом и свингом, с визуализацией и алертом точек входа. Индикатор работает как в трендовых, так и в нетрендовых рыночных условиях. Подходит начинающим и опытным трейдерам.  SCALPER GUN превосходит по скорости, качеству визуализации и точности входа популярные топовые индикаторы этого сайта!!! Перед покупкой скачайте демо Scalper gun и сравните с аналогичными индикаторами для скальпинга в тестере MT4. Особенности Это готовая торговая система с визу
    VWAP Indicator MT5
    Kyra Nickaline Watson-gordon
    Description : VWAP (Volume-Weighted Average Price) is the ratio of the value traded to total volume traded over a particular time horizon. It is a measure of the average price at which pair is traded over the trading horizon. Read More. All Symbols and All Timeframes are supported. Indicator Inputs :     VWAP Mode : Mode of VWAP Calculation. Options can be selected : Single,Session,Daily,Weekly,Monthly     Volumes : Real Volumes,Tick Volumes     Price Type : Used price for calculating. O
    Sinal IFR
    Aurenice Barros De Abreu Carvalho
    Sinal com base no indicador RSI, que indica compra marcando com uma seta verde quando o preco sai da região de sobrevendido, e sinaliza venda quando o preco sai da regiao de sobrecomprado. A sinalizacão é  feita com uma seta verde para compra e seta rosa para venda. Permite configurar o nível de sobrecompra e de sobrevenda, além do período do RSI. Funciona em qualquer período gráfico.
    Wave Box Market Frenquency
    Jean Jacques Huve Ribeiro
    4.75 (4)
    Totally linked to the result of a movement and the duration he had. Its height records how many ticks the asset walked during a given movement, its width shows us the duration that movement had. Its configuration must be in line with the Weis Wave Indicator configuration to observe the movement force and can indicate a possible accumulation or distribution of the movement;
    FREE
    Hello There, Today I want to show you my new researchable fore BUY SELL indicator, it work all asset, and also work Derive Volatility asset! it work all time frame, but i recommend start 5 minute to H1 when you receive a signal just take trade and stay wait for your take profit asset All Major Pair And minor IT WORK ALSO XAUUSD Fantastic results,  for more info,,, message us thank you   
    Limitless MT5
    Dmitriy Kashevich
    Limitless MT5 is a universal indicator suitable for every beginner and experienced trader. works on all currency pairs, cryptocurrencies, raw stocks Limitless MT5 - already configured and does not require additional configuration And now the main thing Why Limitless MT5? 1 complete lack of redrawing 2 two years of testing by the best specialists in trading 3 the accuracy of correct signals exceeds 80% 4 performed well in trading during news releases Trading rules 1 buy signal - the ap
    G-Labs Market Maker Dashboard - Exclusive Seasonal Offer Elevate your trading with the original G-Labs Market Maker Dashboard, available for a limited time at just $70 USD. Ideal for starter traders, this dashboard has been enhanced with new features and now includes a comprehensive training video. This indicator is for people trading the market makers method and is the entry level dashboard for that strategy is available for both mt4 and mt5. its a market scanner in real time showing peak forma
    Novato
    Juan Manuel Rojas Perez
    5 (1)
    Descubre el poderoso aliado que te guiará en el laberinto de los mercados financieros. Este indicador revolucionario te llevará de la incertidumbre a la claridad, permitiéndote identificar con precisión los puntos de inflexión del mercado. Mejora tus decisiones de entrada y salida, optimiza tus operaciones y ¡multiplica tus ganancias con confianza. ¡Para más información, te invitamos a unirte a nuestro canal de Telegram en https://t.me/Profit_Evolution  ¡Allí encontrarás contenido exclusivo, an
    FREE
    Novato alertas
    Juan Manuel Rojas Perez
    4.75 (4)
    Descubre el poderoso aliado que te guiará en el laberinto de los mercados financieros. Este indicador revolucionario te llevará de la incertidumbre a la claridad, permitiéndote identificar con precisión los puntos de inflexión del mercado. Mejora tus decisiones de entrada y salida, optimiza tus operaciones y ¡multiplica tus ganancias con confianza. Ahora con alertas en tu pc o móvil ¡Para más información, te invitamos a unirte a nuestro canal de Telegram en   https://t.me/Profit_Evolution  ¡Al
    FREE
    This script automatically calculates and updates ICT's daily IPDA look back time intervals and their respective discount / equilibrium / premium, so you don't have to :) IPDA stands for Interbank Price Delivery Algorithm. Said algorithm appears to be referencing the past 20, 40, and 60 days intervals as points of reference to define ranges and related PD arrays. Intraday traders can find most value in the 20 Day Look Back box, by observing imbalances and points of interest. Longer term traders c
    This z-score indicator shows the correct z-score of an asset, as it uses the normalized price data for calculation, which is the only correct way. Z-score is only applicable for normal distributed data, therefore not the actual price is considered, but the normalised returns, which were assumed to follow a normal distribution. Returns are mean reverting and assumed to follow a normal distribution, therefore z-score calculation of returns is more reliable than z-score on price, as price is NOT m
    Boom and Crash Pro Indicator
    Savia Forex Software Solutions
    Boom and Crash Pro Indicator The Savia Forex Solutions Boom and Crash Pro Indicator gives you highly accurate entries on all Boom and Crash Indices. The Boom and Crash Pro Indicator is dynamic and powerful and is optimized for all timeframes. Trade with improved confidence and maximize your success rate. Benefits Dynamic and Powerful. Boom and Crash Pro Indicator is fully optimized for all chart timeframes. Whether price action is an uptrend, downtrend or trading sideways, Boom and Crash Pro Ind
    RAD CRITICAL LEVES RAD indicator tracks “Relevant Volume” in real time, identifying accumulation and distribution processes, projecting them in the chart as SUPPORT or RESISTANCE zones. Natural   support   and resistance levels are generated by Volume Accumulation and Distribution processes. As these processes evolve, levels at which the relevant volume in the market place is positioned, become difficult areas to cross upwards or downwards. By using this information, traders can identify very s
    L'indicateur vous permet de déterminer la direction actuelle des prix et la volatilité du marché. Cette version du Traders Dynamic Index a supprimé le redessinage des données historiques, la vitesse de calcul de l'algorithme optimisée, plus de paramètres externes pour des ajustements plus précis, et ses fonctionnalités étendues : ajout de la sélection de l'oscillateur initial et des méthodes de lissage des moyennes . Paramètres: Mode Osc - estimation sélection de l'oscillateur Period Osc - la pé
    Three Candles Pattern
    Edson Cavalca Junior
    5 (1)
    The patterns of 3 (three) Candles: Three White Soldiers; Three Black Crows; These are reversal patterns widely used by traders, as they have a high probability of showing the inversion of the current market movement. For example, if in a bullish trend there are three black crows, there is a high probability of reversing the current bullish movement. The Three White Soldiers have the following characteristics: There are 3 consecutive candles with a good body, that is, the difference between th
    Trend driver bars is the manual trading system, which defines current trend continue or it's pull-back/reverse. "Driver" bars - are price action patterns that has powerfull affect on market, defining it's near future direction. Generally, driver bars represents trend "skeleton" and often anticipates new market impulse. System plots arrows when market shows 3 pattenrs in a row(most powerfull combo-pattern), and makes fast scalping of incomming movement. Loss positions closes by common profit. Lot
    Les acheteurs de ce produit ont également acheté
    Quantum TrendPulse
    Bogdan Ion Puscasu
    5 (7)
    Présentation de   Quantum TrendPulse   , l'outil de trading ultime qui combine la puissance de   SuperTrend   ,   RSI   et   Stochastic   dans un seul indicateur complet pour maximiser votre potentiel de trading. Conçu pour les traders qui recherchent précision et efficacité, cet indicateur vous aide à identifier les tendances du marché, les changements de dynamique et les points d'entrée et de sortie optimaux en toute confiance. Caractéristiques principales : Intégration SuperTrend :   suivez f
    TPSproTREND PrO MT5
    Roman Podpora
    4.54 (13)
    TPSpro TREND PRO  - is a trend indicator that automatically analyzes the market and provides information about the trend and each of its changes, as well as giving signals for entering trades without redrawing! The indicator uses each candle, analyzing them separately. referring to different impulses - up or down impulse. Exact entry points into transactions for currencies, crypto, metals, stocks, indices!  ИНСТРУКЦИЯ RUS         INSTRUCTIONS  ENG       R ecommended to use with an indicator   -
    Top indicator for MT5   providing accurate signals to enter a trade without repainting! It can be applied to any financial assets:   forex, cryptocurrencies, metals, stocks, indices .  Watch  the video  (6:22) with an example of processing only one signal that paid off the indicator! MT4 version is here It will provide pretty accurate trading signals and tell you when it's best to open a trade and close it. Most traders improve their trading results during the first trading week with the help of
    TPSpro RFI Levels MT5
    Roman Podpora
    4.71 (17)
    INSTRUCTIONS       RUS   -   ANGLAIS       Il   est recommandé de l'utiliser avec un indicateur       -       TPSpro   TENDANCE PRO -   Version MT4         Un élément clé du trading est constitué par les zones ou les niveaux à partir desquels les décisions d'achat ou de vente d'un instrument de trading sont prises. Malgré les tentatives des principaux acteurs de dissimuler leur présence sur le marché, ils laissent inévitablement des traces. Notre tâche était d'apprendre à identifier ces traces
    FX Volume MT5
    Daniel Stein
    4.93 (14)
    FX Volume : Découvrez le Sentiment du Marché tel que perçu par un Courtier Présentation Rapide Vous souhaitez faire passer votre approche de trading au niveau supérieur ? FX Volume vous fournit, en temps réel, des informations sur la manière dont les traders particuliers et les courtiers sont positionnés—bien avant la publication de rapports retardés comme le COT. Que vous visiez des gains réguliers ou recherchiez simplement un avantage plus solide sur les marchés, FX Volume vous aide à repére
    Tout d'abord, il convient de souligner que ce système de trading est un indicateur non repeint, non redessiné et non retardé, ce qui le rend idéal pour le trading manuel et automatisé. Cours en ligne, manuel et téléchargement de préréglages. Le "Système de Trading Smart Trend MT5" est une solution de trading complète conçue pour les traders débutants et expérimentés. Il combine plus de 10 indicateurs premium et propose plus de 7 stratégies de trading robustes, ce qui en fait un choix polyvalent
    FX Power MT5 NG
    Daniel Stein
    5 (7)
    FX Power : Analysez la force des devises pour des décisions de trading plus intelligentes Aperçu FX Power est l'outil essentiel pour comprendre la force réelle des principales devises et de l'or, quelles que soient les conditions du marché. En identifiant les devises fortes à acheter et les faibles à vendre, FX Power simplifie vos décisions de trading et révèle des opportunités à forte probabilité. Que vous suiviez les tendances ou anticipiez les retournements à l'aide de valeurs extrêmes de D
    IX Power MT5
    Daniel Stein
    4.17 (6)
    IX Power : Découvrez des insights de marché pour les indices, matières premières, cryptomonnaies et forex Vue d’ensemble IX Power est un outil polyvalent conçu pour analyser la force des indices, matières premières, cryptomonnaies et symboles forex. Tandis que FX Power offre une précision maximale pour les paires de devises en utilisant toutes les données disponibles, IX Power se concentre exclusivement sur les données du symbole sous-jacent. Cela fait de IX Power un excellent choix pour les m
    Trend Forecaster
    Alexey Minkov
    5 (6)
    !SPECIAL SALE!  The Trend Forecaster indicator utilizes a unique proprietary algorithm to determine entry points for a breakout trading strategy. The indicator identifies price clusters, analyzes price movement near levels, and provides a signal when the price breaks through a level. The Trend Forecaster indicator is suitable for all financial assets, including currencies (Forex), metals, stocks, indices, and cryptocurrencies. You can also adjust the indicator to work on any time frames, althoug
    Gold Trend 5
    Sergei Linskii
    5 (1)
    Gold Trend - il s'agit d'un bon indicateur technique boursier. L'algorithme de l'indicateur analyse le mouvement du prix d'un actif et reflète la volatilité et les zones d'entrée potentielles. Les meilleurs signaux de l'indicateur: - Pour la VENTE = histogramme rouge + pointeur SHORT rouge + flèche de signalisation jaune dans la même direction. - Pour l'ACHETER = histogramme bleu + pointeur LONG bleu + flèche de signalisation aqua dans la même direction. Avantages de l'indicateur: 1. L'in
    FX Dynamic : Élevez Votre Analyse de Marché Grâce à une Précision Adaptative Présentation Rapide Vous souhaitez affiner votre avantage en trading ? FX Dynamic fournit des informations en temps réel et réactives sur les mouvements de marché, réagissant instantanément à chaque nouveau tick de données du MetaTrader. Que vous visiez une performance régulière ou des signaux plus fiables, FX Dynamic vous aide à repérer les opportunités clés, affiner vos points d’entrée et de sortie, et gérer votre r
    Présentation       Quantum Breakout PRO   , l'indicateur révolutionnaire MQL5 qui transforme la façon dont vous négociez les zones d'évasion ! Développé par une équipe de traders expérimentés avec une expérience commerciale de plus de 13 ans,       Évasion quantique PRO       est conçu pour propulser votre parcours commercial vers de nouveaux sommets grâce à sa stratégie de zone de discussion innovante et dynamique. Quantum Breakout Indicator vous donnera des flèches de signalisation sur les z
    Maintenant 147 $ (augmentant à 499 $ après quelques mises à jour) - Comptes illimités (PCS ou Mac) Manuel d'utilisation RelicusRoad + Vidéos de formation + Accès au groupe Discord privé + Statut VIP UNE NOUVELLE FAÇON DE REGARDER LE MARCHÉ RelicusRoad est l'indicateur de trading le plus puissant au monde pour le forex, les contrats à terme, les crypto-monnaies, les actions et les indices, offrant aux traders toutes les informations et tous les outils dont ils ont besoin pour rester rentables
    Ce tableau de bord affiche les derniers   modèles harmoniques   disponibles pour les symboles sélectionnés, ce qui vous permettra de gagner du temps et d'être plus efficace /   version MT4 . Indicateur gratuit:   Basic Harmonic Pattern Colonnes de l'indicateur Symbol :   les symboles sélectionnés apparaissent Trend   :   haussière ou baissière Pattern :   type de motif (gartley, papillon, chauve-souris, crabe, requin, cypher ou ABCD) Entry:   prix d'entrée SL:   prix du stop loss TP1:   1er
    Atomic Analyst MT5
    Issam Kassas
    4.32 (19)
    Tout d'abord, il convient de souligner que cet indicateur de trading n'est ni repainting, ni redrawing et ne présente aucun délai, ce qui le rend idéal à la fois pour le trading manuel et automatisé. Manuel de l'utilisateur : réglages, entrées et stratégie. L'Analyste Atomique est un indicateur d'action sur les prix PA qui utilise la force et le momentum du prix pour trouver un meilleur avantage sur le marché. Équipé de filtres avancés qui aident à éliminer les bruits et les faux signaux, et à
    Was: $249  Now: $149   Market Profile defines a number of day types that can help the trader to determine market behaviour. A key feature is the Value Area, representing the range of price action where 70% of trading took place. Understanding the Value Area can give traders valuable insight into market direction and establish the higher odds trade. It is an excellent addition to any system you may be using. Inspired by Jim Dalton’s book “Mind Over Markets”, this indicator is designed to suit the
    FX Levels : Des zones de Support et Résistance d’une Précision Exceptionnelle pour Tous les Marchés Présentation Rapide Vous recherchez un moyen fiable pour déterminer des niveaux de support et résistance dans n’importe quel marché—paires de devises, indices, actions ou matières premières ? FX Levels associe la méthode traditionnelle « Lighthouse » à une approche dynamique de pointe, offrant une précision quasi universelle. Grâce à notre expérience réelle avec des brokers et à des mises à jour
    Trade smarter, not harder: Empower your trading with Harmonacci Patterns Special Offer: Purchase now to receive free bonuses worth $165! (Read more for details) This is arguably the most complete harmonic price formation auto-recognition indicator you can find for the MetaTrader Platform. It detects 19 different patterns, takes fibonacci projections as seriously as you do, displays the Potential Reversal Zone (PRZ) and finds suitable stop-loss and take-profit levels. [ Installation Guide | Upd
    Royal Scalping Indicator M5
    Vahidreza Heidar Gholami
    5 (6)
    Royal Scalping Indicator is an advanced price adaptive indicator designed to generate high-quality trading signals. Built-in multi-timeframe and multi-currency capabilities make it even more powerful to have configurations based on different symbols and timeframes. This indicator is perfect for scalp trades as well as swing trades. Royal Scalping is not just an indicator, but a trading strategy itself. Features Price Adaptive Trend Detector Algorithm Multi-Timeframe and Multi-Currency Trend Low
    Royal Wave Pro M5
    Vahidreza Heidar Gholami
    3.5 (4)
    Royal Wave is a Trend-Power oscillator which has been programmed to locate and signal low-risk entry and exit zones. Its core algorithm statistically analyzes the market and generates trading signals for overbought, oversold and low volatile areas. By using a well-designed alerting system, this indicator makes it easier to make proper decisions regarding where to enter and where to exit trades. Features Trend-Power Algorithm Low risk Entry Zones and Exit Zones Predictions for Overbought and Over
    Tout d'abord, il convient de souligner que ce système de trading est un indicateur non repainting, non redrawing et non lagging, ce qui le rend idéal pour le trading professionnel. Cours en ligne, manuel utilisateur et démonstration. Le "Système de Trading de Support et Résistance Intelligent" est un indicateur avancé conçu pour les traders novices et expérimentés. Il permet aux traders de bénéficier de précision et de confiance sur le marché du forex. Ce système complet combine plus de 7 strat
    Gold Venamax MT5
    Sergei Linskii
    3.5 (2)
    Gold Venamax - c'est le meilleur indicateur technique boursier. L'algorithme de l'indicateur analyse l'évolution des prix d'un actif et reflète la volatilité et les zones d'entrée potentielles. Caractéristiques de l'indicateur: Il s'agit d'un super indicateur avec Magic et deux blocs de flèches de tendance pour un trading confortable et rentable. Le bouton rouge pour changer de bloc est affiché sur le graphique. La magie est définie dans les paramètres de l'indicateur, afin que vous puissiez
    Timeframes Trend Scanner is a trend analyzer or trend screener indicator that helps you know the trend in all timeframes of symbol you're watching. This indicator provides clear & detailed analysis results on a beautiful dashboard, let you able to use this result right away without need to do any additional analysis. How it works Step 1: Calculate values of 23 selected & trusted technical indicators (Oscillator & Moving Average indicators) Step 2: Analyze all indicators using best practices to f
    Gold Pointer est le meilleur indicateur de tendance. L'algorithme unique de l'indicateur analyse le mouvement du prix de l'actif, en prenant en compte les facteurs de l'analyse technique et mathématique, détermine les points d'entrée les plus rentables et donne un signal pour ouvrir un ordre d'ACHAT ou de VENTE. Les meilleurs signaux de l'indicateur: - Pour la VENTE = ligne de tendance rouge + indicateur TF rouge + flèche de signalisation jaune dans la même direction. - Pour l'ACHAT = ligne d
    MetaForecast M5
    Vahidreza Heidar Gholami
    5 (2)
    MetaForecast prédit et visualise l'avenir de n'importe quel marché en se basant sur les harmoniques des données de prix. Bien que le marché ne soit pas toujours prévisible, s'il y a un motif dans les prix, MetaForecast peut prédire l'avenir aussi précisément que possible. Comparé à d'autres produits similaires, MetaForecast peut générer des résultats plus précis en analysant les tendances du marché. Paramètres d'entrée Past size (Taille passée) Spécifie le nombre de barres que MetaForecast util
    TrendMaestro5
    Stefano Frisetti
    note: this indicator is for METATRADER4, if you want the version for METATRADER5 this is the link:  https://www.mql5.com/it/market/product/108106 TRENDMAESTRO ver 2.4 TRENDMAESTRO recognizes a new TREND in the bud, he never makes mistakes. The certainty of identifying a new TREND is priceless. DESCRIPTION TRENDMAESTRO identifies a new TREND in the bud, this indicator examines the volatility, volumes and momentum to identify the moment in which there is an explosion of one or more of these data a
    Real Trend Zigzag PRO   shows the real trend of a market, u nlike the default Zigzag indicator. It calculates the trend in real time and shows green lines for upwards trends, red lines for downward trends and blue lines for no trends.  Regarding the old slogan "the trend is your friend" it helps you to decide if should open a buy or sell position. The PRO version is a multi timeframe zigzag (MTF). Means, it shows the trend of the current timeframe as well as the trend of a higher or lower time.
    Blahtech Supply Demand MT5
    Blahtech Limited
    4.54 (13)
    Was: $299  Now: $149  Supply Demand uses previous price action to identify potential imbalances between buyers and sellers. The key is to identify the better odds zones, not just the untouched ones. Blahtech Supply Demand indicator delivers functionality previously unavailable on any trading platform. This 4-in-1 indicator not only highlights the higher probability zones using a multi-criteria strength engine, but also combines it with multi-timeframe trend analysis, previously confirmed swings
    FxaccurateLS
    Shiv Raj Kumawat
    WHY IS OUR FXACCCURATE LS MT5 THE PROFITABLE ? PROTECT YOUR CAPITAL WITH RISK MANAGEMENT Gives entry, stop and target levels from time to time. It finds Trading opportunities by analyzing what the price is doing during established trends. POWERFUL INDICATOR FOR A RELIABLE STRATEGIES We have made these indicators with a lot of years of hard work. It is made at a very advanced level. Established trends provide dozens of trading opportunities, but most trend indicators completely ignore them! The
    Golden Spike Premium
    Kwaku Bondzie Ghartey
    Golden Spikes Detector Acknowledgement and Dedications:  The name of this indicator was Inspired by an Original; Mr Grant Koopman; a Knowledgeable and experienced Synthetics trader. I dedicate this indicator to Mr Grant.  Overview:   The Golden Spikes Premium is a groundbreaking trading indicator meticulously crafted for the Boom and Crash indices on the Deriv market. Tailored to meet the needs of discerning traders, this powerful tool operates exclusively on the one-minute timeframe, providing
    Plus de l'auteur
    Active Pivot Levels
    Robert Gerald Wood
    5 (1)
    Les niveaux pivots sont un niveau technique bien établi et reconnu sur tous les marchés. Cet indicateur dessinera les pivots trimestriels, mensuels, hebdomadaires, quotidiens et quadri-horaires actuels sur le graphique, pour n'importe quel symbole. Vous pouvez également afficher les niveaux de support et de résistance pour chaque période et choisir lequel afficher des niveaux 1 à 4.     Choisissez le type de pivot parmi : Standard Camarilla DeMark boisé Fibonacci Veuillez noter que les pivots De
    TheStrat Candles
    Robert Gerald Wood
    5 (1)
    Cet indicateur dessinera une étiquette au-dessus ou au-dessous de chaque bougie en fonction de       de Rob Smith       La Strat       à mesure qu'ils évoluent au fil du temps sur votre graphique. Au fur et à mesure que le prix évolue, une bougie peut basculer entre trois états. Lorsque la bougie s'ouvre pour la première fois, si elle se trouve complètement dans les bougies précédentes haut et bas, elle commencera comme un type 1. Au fil du temps, si elle casse le haut ou le bas de la bougie p
    TheStrat Monitor
    Robert Gerald Wood
    3 (2)
    If you've not already learnt about The Strat trading strategy , go google it now. I promise it won't be a waste of your time, and you will likely learn some new tricks whether you use it or not. OK, so now you know what TheStrat is, you will be able to understand what this indicator can do for you. Key Features In short, the Indicator will: Show Timeframe Continuity for all supported timeframes Supports two timeset views, Day trader and Swing trader Show when Full Timeframe Continuity is in pla
    TheStrat Levels
    Robert Gerald Wood
    This indicator draws the prior Highs and Lows for multiple timeframes, and can display potential Take Profit and Stop Loss levels. In Rob Smith's # The Strat   terms,   these are potential entry points, or alternatively potential targets for open positions. I like to use them in both ways. On a lower timeframe, say 5 minutes to get a good entry on a daily or weekly level, and then as a potential target. Very small stops required giving an excellent risk/reward ratio. Please watch the DEMO video
    TheStrat Patterns
    Robert Gerald Wood
    This indicator will draw patterns based on Rob Smith's The Strat as they emerge in real time on your chart. As price evolves, TheStrat offers 18 distinct price action patterns that can help you get good entries in the market. Each pattern involves two or three candles, and this indicator will draw a bounding box around the candles and name the pattern. The indicator also shows when a potential setup is forming, known by stratters as an Actionable signal. Candles Each candle is defined by its
    TheStrat FTFC
    Robert Gerald Wood
    FTFC fait référence à Full Timeframe Continuity tel que défini par   The Strat   de Rob Smith. Cet indicateur dessine deux lignes sur le graphique, l'une des plus élevées des niveaux d'ouverture trimestriels, mensuels, hebdomadaires, quotidiens ou horaires, et la seconde des plus basses de ces valeurs. Cela vous donne un canal au-dessus ou au-dessous duquel le trading est plus susceptible d'être très fortement dans une direction. Entre les lignes, l'action des prix sera plus agitée et vous pourr
    Lorsque vous négociez avec   The Strat   , il est important de garder un œil sur plusieurs délais. Cet indicateur affichera l'état quotidien, hebdomadaire, mensuel et trimestriel de la bougie actuelle pour chaque période. Une icône en forme de cercle indique que la bougie sur cette période est actuellement un Inside, ou Type 1 dans la terminologie TheStrat. Une bougie Inside Day consolide l'action des prix, et nous recherchons une cassure de la fourchette. Une icône Triangle, pointant vers le ha
    Multi Chart Crosshairs
    Robert Gerald Wood
    5 (1)
    This indicator is designed to make reviews of many charts on different timescales quicker, and easier to do. Track Time and Price across multiple charts Change Symbol on one chart and all other charts of the same symbol will be changed too. Easy to use, quick to master The indicator allows you to identify the price and time where the mouse pointer is on the current chart, across all other charts open on the same Symbol. This allows you to quickly see information on multiple charts whereas normal
    Multi Chart Crosshairs MT5
    Robert Gerald Wood
    5 (4)
    Cet indicateur est conçu pour rendre les révisions de nombreux graphiques sur différentes échelles de temps plus rapides et plus faciles à faire. Suivez le temps et le prix sur plusieurs graphiques Changer de symbole sur un graphique et tous les autres graphiques du même symbole seront également modifiés. Facile à utiliser, rapide à maîtriser L'indicateur vous permet d'identifier le prix et l'heure où se trouve le pointeur de la souris sur le graphique actuel, sur tous les autres graphiques ouve
    Chart Drawing Cloner
    Robert Gerald Wood
    5 (2)
    Ce script vous permet de copier des objets de dessin de tout type, tels que des lignes de tendance, des retracements de Fibonachi, etc., vers un ou plusieurs autres graphiques. Par défaut, le script copiera tous les objets du graphique actuel, c'est-à-dire le graphique auquel le script a été appliqué, vers tout autre graphique du même symbole actuellement chargé. Paramètres Délai de destination Lorsqu'il est défini sur autre chose que PERIOD_CURRENT, il copiera les objets dans n'importe quel
    FREE
    A simple script that can delete all the drawing objects on a chart, or just the objects of a specific type. Settings: DeleteObjectsOfType By default the value will be blank which means ALL drawing objects on the chart will be deleted. If you only wish to delete specific types of drawing object, change this setting to the type of object to delete. For example, Fibonacci Retracement, Text, Label or Trend Line. Please see the demonstration video for more information.
    FREE
    J'ai créé cet indicateur simple pendant que j'apprenais TheStrat de Rob Smith et je le trouve si utile que j'ai pensé le partager avec vous. Si vous le trouvez utile, veuillez consulter les autres indicateurs que j'ai publiés sur MQL5. L'indicateur dessine simplement une seule ligne sur le graphique indiquant le niveau de prix que vous sélectionnez dans une période plus longue. En utilisant les paramètres, vous avez un contrôle total sur la période qu'il affiche, mais par   défaut, il calcule lu
    FREE
    This script allows you to toggle the "Show Trade Levels" option, but for the current chart only. Normally, you can only change the setting using the Options -> Chart menu for ALL charts, but this script allows you to do it for a SINGLE chart. I'm using it when I take screenshots, because most of the time I'm not trying to show the trades, just some functionality of one of my other tools. Iif you need that functionality, then this script is very helpful! If the script helps you, please let me k
    FREE
    Les marchés aiment vraiment les chiffres ronds et ils agissent souvent comme un soutien dans un marché en baisse ou comme une résistance lorsque les prix augmentent. Cet indicateur est conçu pour dessiner des niveaux de prix à des valeurs rondes. Il le fait automatiquement, mais vous avez également la possibilité de remplacer cela et de déterminer les niveaux que vous souhaitez voir. Un niveau rond peut être aussi simple que des étapes de 10, donc 10, 20, 30 etc. ou si vous travaillez avec le Fo
    ATR Extremes
    Robert Gerald Wood
    L'Average True Range (ATR) est un indicateur couramment utilisé qui mesure la quantité de mouvement du prix sur une durée définie. Cependant, la valeur qu'il donne n'est définie dans aucune sorte de limite, ce qui rend son utilisation pour autre chose que des calculs de stop loss ou de take profit, presque impossible. Cet indicateur est votre indicateur ATR standard, mais nous avons introduit des démarcations en centiles afin que vous puissiez voir les extrêmes. Vous pouvez choisir entre les
    Range Exhaustion
    Robert Gerald Wood
    L'épuisement de la fourchette se produit lorsque le prix atteint ou dépasse la fourchette attendue pour la période en cours. À ces niveaux, le prix commence à perdre son élan par rapport au début de la période, c'est donc un bon point pour vous assurer que vous ne prenez pas de nouvelles positions. Cet indicateur vous montrera où cela est susceptible de se produire sur votre graphique, montrant les niveaux pour les périodes quotidiennes, hebdomadaires et mensuelles. Lorsque vous voyez un prix dé
    This indicator will draw a label above or below each candle based on   Rob Smith's   The Strat   as they develop over time on your chart. As price evolves, a candle can switch between three states. When the candle first opens, if it sits completely within the previous candles high and low, then it will start as a Type 1. As time moves on, if it breaks either the high or low of the previous candle, it will be come a type 2, and should the price action be volatile and directionless, it may then
    TheStrat FTFC MT5
    Robert Gerald Wood
    FTFC fait référence à Full Timeframe Continuity tel que défini par   The Strat   de Rob Smith. Cet indicateur dessine deux lignes sur le graphique, l'une des plus élevées des niveaux d'ouverture trimestriels, mensuels, hebdomadaires, quotidiens ou horaires, et la seconde des plus basses de ces valeurs. Cela vous donne un canal au-dessus ou au-dessous duquel le trading est plus susceptible d'être très fortement dans une direction. Entre les lignes, l'action des prix sera plus agitée et vous pourr
    This indicator will draw patterns based on   Rob Smith's   The Strat   as they emerge in real time on your chart. As price evolves,   TheStrat   offers 18 distinct price action patterns that can help you get good entries in the market. Each pattern involves two or three candles, and this indicator will draw a bounding box around the candles and name the pattern. The indicator also shows when a potential setup is forming, known by stratters as an Actionable signal. Candles Each candle is defin
    TheStrat Monitor MT5
    Robert Gerald Wood
    5 (1)
    Si vous n'avez pas encore entendu parler   de la stratégie de trading Strat   , allez sur Google maintenant. Je vous promets que ce ne sera pas une perte de temps et que vous apprendrez probablement de nouvelles astuces, que vous l'utilisiez ou non. OK, alors maintenant que vous savez ce qu'est TheStrat, vous pourrez comprendre ce que cet indicateur peut faire pour vous. Principales caractéristiques En bref, l'indicateur : Afficher la continuité des délais pour tous les délais pris en charge Pr
    TheStrat TFC Monitor MT5
    Robert Gerald Wood
    5 (1)
    Lorsque vous négociez avec   The Strat   , il est important de garder un œil sur plusieurs délais. Cet indicateur affichera l'état quotidien, hebdomadaire, mensuel et trimestriel de la bougie actuelle pour chaque période. Une icône en forme de cercle indique que la bougie sur cette période est actuellement un Inside, ou Type 1 dans la terminologie TheStrat. Une bougie Inside Day consolide l'action des prix, et nous recherchons une cassure de la fourchette. Une icône Triangle, pointant vers le ha
    Les niveaux pivots sont un niveau technique bien établi et reconnu sur tous les marchés. Cet indicateur dessinera les pivots trimestriels, mensuels, hebdomadaires, quotidiens et quadri-horaires actuels sur le graphique, pour n'importe quel symbole. Vous pouvez également afficher les niveaux de support et de résistance pour chaque période et choisir lequel afficher des niveaux 1 à 4.     Choisissez le type de pivot parmi : Standard Camarilla DeMark boisé Fibonacci Veuillez noter que les pivots De
    Les marchés aiment vraiment les chiffres ronds et ils agissent souvent comme un soutien dans un marché en baisse ou comme une résistance lorsque les prix augmentent. Cet indicateur est conçu pour dessiner des niveaux de prix à des valeurs rondes. Il le fait automatiquement, mais vous avez également la possibilité de remplacer cela et de déterminer les niveaux que vous souhaitez voir. Un niveau rond peut être aussi simple que des étapes de 10, donc 10, 20, 30 etc. ou si vous travaillez avec le Fo
    ATR Extremes MT5
    Robert Gerald Wood
    L'Average True Range (ATR) est un indicateur couramment utilisé qui mesure la quantité de mouvement de prix sur une durée définie. Cependant, la valeur qu'il donne n'est définie dans aucune sorte de limite, ce qui rend son utilisation pour autre chose que des calculs de stop loss ou de take profit, presque impossible. Cet indicateur est votre indicateur ATR standard, mais nous avons introduit des démarcations en centiles afin que vous puissiez voir les extrêmes. Vous pouvez choisir entre les cen
    L'épuisement de la fourchette se produit lorsque le prix atteint ou dépasse la fourchette attendue pour la période en cours. À ces niveaux, le prix commence à perdre son élan par rapport au début de la période, c'est donc un bon point pour vous assurer que vous ne prenez pas de nouvelles positions. Cet indicateur vous montrera où cela est susceptible de se produire sur votre graphique, montrant les niveaux pour les périodes quotidiennes, hebdomadaires et mensuelles. Lorsque vous voyez un prix dé
    Filtrer:
    renetrader07
    135
    renetrader07 2023.11.23 18:24 
     

    This greatly helps with being more mechanical with my trading

    Robert Gerald Wood
    4673
    Réponse du développeur Robert Gerald Wood 2023.11.23 18:26
    Many thanks for the review. This is the indicator I use the most now, it takes a little getting used to, but worth it!
    Répondre à l'avis
    Version 2.10 2021.06.18
    Fix for issue where lines were not drawing for charts with not enough history data on the current timeframe.
    Fix for issue where number of potential targets displayed was being restricted unintentionally.
    Minor performance improvements.
    Version 2.0 2021.06.16
    NEW - Version 2 of the Indicator.
    Almost a complete rewrite, now includes the drawing of potential Take Profit and Stop loss levels and showing the associated Risk/Reward value for each. Pivot Machine Gun (PMG) scenarios are also identified and shown on each level with that potential.

    - Levels from Hourly, Four Hourly, Daily, Weekly and Monthly timeframes
    - Potential Take Profit levels
    - Potential Stop Loss levels based on the current or higher timeframe
    - Risk / Reward calculated continuously for each potential target level based on potential stop level
    - Pivot Machine Gun identification
    - Labelling for each level so you can identify what there
    - Comprehensive options to make it look as you wish