• 概要
  • レビュー (1)
  • コメント (2)
  • 最新情報

TheStrat Levels MT5

5

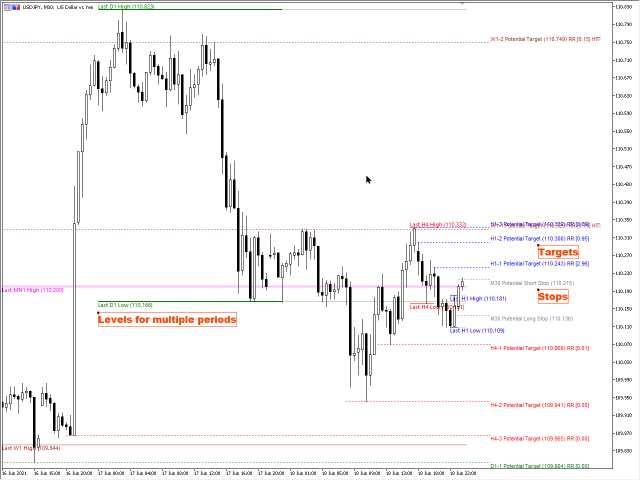
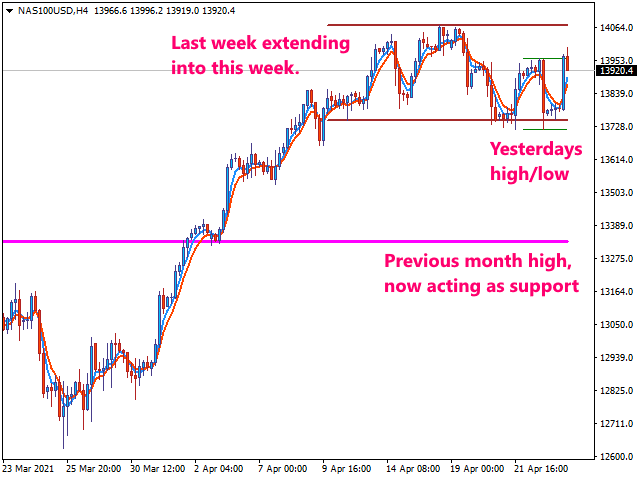
This indicator draws the prior Highs and Lows for multiple timeframes, and can display potential Take Profit and Stop Loss levels.

In Rob Smith's #The Strat terms, these are potential entry points, or alternatively potential targets for open positions. I like to use them in both ways. On a lower timeframe, say 5 minutes to get a good entry on a daily or weekly level, and then as a potential target. Very small stops required giving an excellent risk/reward ratio.

Key Features

 - Levels from Hourly, Four Hourly, Daily, Weekly and Monthly timeframes
 - Potential Take Profit levels
 - Potential Stop Loss levels based on the current or higher timeframe
 - Risk / Reward calculated continuously for each potential target level based on potential stop level
 - Pivot Machine Gun identification
 - Labelling for each level so you can identify what there
 - Comprehensive options to make it look as you wish

    Please watch the DEMO video for more details as the pictures do not do the indicator justice.


    Settings

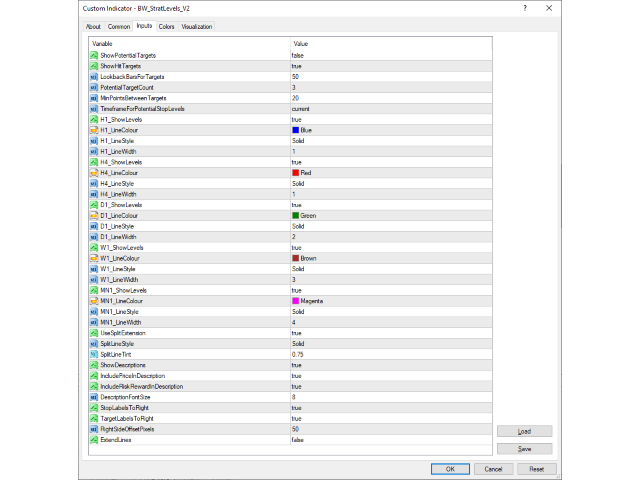
    There are a number of settings, repeated for each timeframe.

    ShowLevels

    When true, the levels are drawn for this timeframe. The lines are drawn from the last period start to the current time. Once a new period is started, the lines will be redrawn to the new levels.

    LineColour

    You can set the line colour to any value from the standard colour selection.

    LineStyle

    The line style can vary from the simple solid line, dots, dashes or dots and dashes.

    LineWidth

    If the line style is solid, the line width can be any value from the selection available, 1 to 5.


    UseSplitExtension

    When set to True, the lines drawn are split into the historic part drawn using the line styles, width and colours above, and the projected part using a modified style based on the following settings.

    SplitLineStyle

    If you wish you can set the line style so it is clearly visibly different to the historic part of the line. If you set it to STYLE_SOLID, then the projected line will retain the width set above.

    SplitLineTint

    You can modify the colour of the projected line by giving it a tint. That is a reduction in intensity of the main colour selected for the historic line set above. The default value here is 0.5 which means halve the intensity of the colour.


    Stop and Target Levels

    ShowPotentialTargets

    When true, potential target levels are shown for each timeframe enabled using the ShowLevels settings.

    ShowHitTargets

    When true, if a target level has been hit it will stay on the chart until the timeframe has expired. Otherwise, once hit, potential target levels are removed.

    LookbackBarsForTargets

    Controls how far back in the history the system should look for target levels. Default is 50 bars.

    PotentialTargetCount

    This allows you to choose how many potential target levels you want to see per timeframe. Default is 3.

    MinPointsBetweenTargets

    Having targets too close together is not very helpful, so this setting allows you to define how many points should be between one target and the next. Calculated per timeframe.

    TimeframeForPotentialStopLevels

    Allows you to choose the timeframe stop loss levels should be calculated from. By default it uses the current timeframe, giving a very tight stop loss.


    Descriptive Labels

    ShowDescriptions

    When true, descriptive labels are drawn for every level shown.

    IncludePriceInDescription

    When true, puts the price value of the level in the description.

    IncludeRiskRewardInDescription

    When true, adds the risk / reward value in the description.

    DescriptionFontSize

    Choose how big the descriptive labels should be.

    StopLabelsToRight

    When true, the labels for stop levels are drawn to the right of the stop level. Set to false, the description will be drawn to the left of the level.

    TargetLabelsToRight

    When true, the labels for target levels are drawn to the right of the stop level. Set to false, the description will be drawn to the left of the level.

    RightSideOffsetPixels

    Allows you to choose how far from the current time the stop and target labels should be drawn. Only relevant if you use StopLabelsToRight or TargetLabelsToRight.


    ExtendLines

    By default, this is false. When True, the lines are extended off to the right hand side of the chart.

    レビュー 1
    renetrader07
    135
    renetrader07 2023.11.23 18:24 
     

    This greatly helps with being more mechanical with my trading

    おすすめのプロダクト
    Vanguard's Volatility indicator is based on the analysis of long and short price volatility. It helps to determine market entry points by displaying favorable entry points with arrows. This indicator can be used as a filter in trading or as a tool to show the exact direction of the trend. It is suitable for both scalping on small time intervals and long-term trading. It is important to remember that successful trading requires a comprehensive approach, and additional information is needed to en
    This product is designed for the MT5 platform and offers two key features: VWAP (Volume Weighted Average Price) calculation and Volume Profile analysis. Advantages: VWAP Calculation: The product calculates the VWAP, which is a popular indicator used by traders to determine the average price of a security based on its trading volume. It helps identify potential buying or selling opportunities by comparing the current price to the average price weighted by volume. Volume Profile Analysis: The prod
    Holiday Sales Zones Indicator The Zones Indicator is your everyday Trading tool that  leverages advanced algorithms, including ICT institutional concepts like order blocks , engulfing candle patterns , and Level interactions , to identify critical levels of supply and demand (Resistance & Support). Visual signals are generated and clearly marked on the chart, providing a straightforward guide for traders to spot key opportunities. Key Features Advanced Algorithmic Analysis : Identifies supply
    Automatic Vwap Midas
    Ricardo Almeida Branco
    5 (1)
    The 3 Automatic Vwap (Midas) Indicator can be used for Price and Volume studyers to map the movement of market drivers. It automatically plots 3 Vwaps, two of which are dynamic and will be updated throughout the day if new highs or new lows emerge. The third Vwap is daily and can help if the trend is up or down. Also, an auxiliary indicator that plots (also dynamic) points of interest with OHLC prices (Open, High and Low of the current day and Close of the previous day) was inserted. Success and
    The TickDelta indicator shows the difference in the number of oscillations of the best prices per unit of time. In this case, the unit of time is the specified timeframe (M1, M2, M5, M15, etc.). This value indirectly shows the market "sentiment". Due to the "tick-wise" nature, the indicator is more appropriate for use in scalping strategies. When applied in conjunction with real volumes and monitoring of various instrument charts, it is possible to identify certain reversal setups. In some cases
    Visual Heatmap Book Analyser This indicator monitors the market liquidity and generates colors based on order patterns, quantities, and renewal activities in the book. This allows you to visualize the order flow and identify areas of high and low liquidity and activity. The indicator uses machine learning techniques to analyze the order behavior in the book, enabling it to detect patterns and trends in orders, allowing you to make informed decisions about your trading operations. The color pale
    This is the best indicator we have created by far, this indicator replicates the well known heiken ashi indicator,  but with a more precise entry point, this indicator can work on all time-frames and is strong on all the time frames , this indicator does not repaint nor does it lag , this indicator strategy combined with price action will change your trading experience , elevate your experience to the next level.
    Adjustable Consecutive Fractals  looks for 2 or more fractals in one direction and sends out a on screen alert, sound alert and push notification, for strong reversal points . Adjustable Consecutive Fractals, shows the fractals on chart along with a color changing text for buy and sell signals when one or more fractals appear on one side of price. Adjustable Consecutive Fractals is based Bill Williams Fractals . The standard Bill Williams fractals are set at a non adjustable 5 bars, BUT withe th
    Vwap Freeze
    Ricardo Almeida Branco
    5 (1)
    The previous day's vwap is used by some traders as a support and resistance point, after all it is one of the ways to consider the fair price of that asset or that pair the day before. Possible defenses can occur in this region indicating a reversal, or triggering stops starting a new, more directional movement. It is a matter of analyzing how it will add to your operational. To avoid manually drawing the previous day's vwaps and saving time for your analysis, use the Vwap Freeze indicator, as
    Displays trends in current chart. You can display trends of multiple timeframes in one chart by inserting this indicator as often as you want. Key features: displays trend line by finding highs and lows counts number of high/low of current trend in different color (long/short) allows you to display multiple timeframe trends in one chart Settings: Indicator Name: if you want to show M5 and H1 on one chart add TITrend twice to your current chart and rename M5 to "TITrendM5" and H1 to "TITrendH1" C
    Anchored VWAP with Alert MT5
    Trade The Volume Waves Single Member P.C.
    5 (1)
    What is the Volume Weighted Average Price (VWAP)? The volume weighted average price (VWAP) is a trading benchmark used by traders that gives the average price an instrument has traded at throughout the day, based on both volume and price.  It is important because it provides traders with insight into both the trend and value of the instrument. What is the Difference between VWAP and AVWAP? While VWAP is having as starting point the beggining of the day,week,month etc. in the AVWAP you can pla
    Market Noise マーケットノイズは、価格チャート上の市場の局面を決定する指標であり、また、蓄積または分配局面が発生したときに、明確で滑らかなトレンドの動きとノイズの多い平坦な動きを区別します。 各フェーズは、独自のタイプの取引に適しています。トレンド追跡システムにはトレンド、積極的なシステムにはフラットです。 市場のノイズが始まったら、取引を終了することを決定できます。 同様に、またその逆も同様で、騒音が止んだらすぐに、積極的な取引システムをオフにする必要があります。 一方からもう一方に切り替えて、両方のタイプの取引戦略を取引することができます。 したがって、この指標は取引決定の分野で優れたアシスタントの役割を果たします。 すべての価格変動は、選択した期間の一般的な価格変動と、この期間内の価格変動の形でのノイズという 2 つの要素に分けることができます。 同時に、異なる期間の異なる市場では、ノイズ成分とトレンド成分の間の幅広い相互関係を示すことができます (図 1)。 価格変動のノイズレベルが高くなるほど、基礎的なトレンドの方向性と強さを識別することが難しくなります。 した
    Buy Sell Visual MTF
    Naththapach Thanakulchayanan
    This MT5 indicator, Bull Bear Visual MTF (21 Time Frames), summarize the strength color graphic and percentages of power for both  Bull and Bear in current market emotion stage which will show you in multi time frames and sum of the total Bull and Bear power strength which is an important information for traders especially you can see all Bull and Bear power in visualized graphic easily, Hope it will be helpful tool for you for making a good decision in trading.
    Volume Trade Levels
    Mahmoud Sabry Mohamed Youssef
    The idea behind this indicator is very simple , First it contains 2 mechanisms to place your trades: 1- Enter the Pips you want to duplicate to price levels. 2- Automatically let the indicator specify the largest Buy / Sell Volume Candle and place duplicated levels based on the candle itself. How it works: 1- Enter the Pips you want to duplicate to price levels:    1- once the indicator is loaded you will need first to Specify the number of pips in the indicator Configuration window ,you can g
    Scalper gun  - главное оружие для торговли скальпингом и свингом, с визуализацией и алертом точек входа. Индикатор работает как в трендовых, так и в нетрендовых рыночных условиях. Подходит начинающим и опытным трейдерам.  SCALPER GUN превосходит по скорости, качеству визуализации и точности входа популярные топовые индикаторы этого сайта!!! Перед покупкой скачайте демо Scalper gun и сравните с аналогичными индикаторами для скальпинга в тестере MT4. Особенности Это готовая торговая система с визу
    VWAP Indicator MT5
    Kyra Nickaline Watson-gordon
    Description : VWAP (Volume-Weighted Average Price) is the ratio of the value traded to total volume traded over a particular time horizon. It is a measure of the average price at which pair is traded over the trading horizon. Read More. All Symbols and All Timeframes are supported. Indicator Inputs :     VWAP Mode : Mode of VWAP Calculation. Options can be selected : Single,Session,Daily,Weekly,Monthly     Volumes : Real Volumes,Tick Volumes     Price Type : Used price for calculating. O
    Sinal IFR
    Aurenice Barros De Abreu Carvalho
    Sinal com base no indicador RSI, que indica compra marcando com uma seta verde quando o preco sai da região de sobrevendido, e sinaliza venda quando o preco sai da regiao de sobrecomprado. A sinalizacão é  feita com uma seta verde para compra e seta rosa para venda. Permite configurar o nível de sobrecompra e de sobrevenda, além do período do RSI. Funciona em qualquer período gráfico.
    Wave Box Market Frenquency
    Jean Jacques Huve Ribeiro
    4.75 (4)
    Totally linked to the result of a movement and the duration he had. Its height records how many ticks the asset walked during a given movement, its width shows us the duration that movement had. Its configuration must be in line with the Weis Wave Indicator configuration to observe the movement force and can indicate a possible accumulation or distribution of the movement;
    FREE
    Hello There, Today I want to show you my new researchable fore BUY SELL indicator, it work all asset, and also work Derive Volatility asset! it work all time frame, but i recommend start 5 minute to H1 when you receive a signal just take trade and stay wait for your take profit asset All Major Pair And minor IT WORK ALSO XAUUSD Fantastic results,  for more info,,, message us thank you   
    Limitless MT5 is a universal indicator suitable for every beginner and experienced trader. works on all currency pairs, cryptocurrencies, raw stocks Limitless MT5 - already configured and does not require additional configuration And now the main thing Why Limitless MT5? 1 complete lack of redrawing 2 two years of testing by the best specialists in trading 3 the accuracy of correct signals exceeds 80% 4 performed well in trading during news releases Trading rules 1 buy signal - the ap
    G-Labs Market Maker Dashboard - Exclusive Seasonal Offer Elevate your trading with the original G-Labs Market Maker Dashboard, available for a limited time at just $70 USD. Ideal for starter traders, this dashboard has been enhanced with new features and now includes a comprehensive training video. This indicator is for people trading the market makers method and is the entry level dashboard for that strategy is available for both mt4 and mt5. its a market scanner in real time showing peak forma
    Novato
    Juan Manuel Rojas Perez
    5 (1)
    Descubre el poderoso aliado que te guiará en el laberinto de los mercados financieros. Este indicador revolucionario te llevará de la incertidumbre a la claridad, permitiéndote identificar con precisión los puntos de inflexión del mercado. Mejora tus decisiones de entrada y salida, optimiza tus operaciones y ¡multiplica tus ganancias con confianza. ¡Para más información, te invitamos a unirte a nuestro canal de Telegram en https://t.me/Profit_Evolution  ¡Allí encontrarás contenido exclusivo, an
    FREE
    Novato alertas
    Juan Manuel Rojas Perez
    4.75 (4)
    Descubre el poderoso aliado que te guiará en el laberinto de los mercados financieros. Este indicador revolucionario te llevará de la incertidumbre a la claridad, permitiéndote identificar con precisión los puntos de inflexión del mercado. Mejora tus decisiones de entrada y salida, optimiza tus operaciones y ¡multiplica tus ganancias con confianza. Ahora con alertas en tu pc o móvil ¡Para más información, te invitamos a unirte a nuestro canal de Telegram en   https://t.me/Profit_Evolution  ¡Al
    FREE
    This script automatically calculates and updates ICT's daily IPDA look back time intervals and their respective discount / equilibrium / premium, so you don't have to :) IPDA stands for Interbank Price Delivery Algorithm. Said algorithm appears to be referencing the past 20, 40, and 60 days intervals as points of reference to define ranges and related PD arrays. Intraday traders can find most value in the 20 Day Look Back box, by observing imbalances and points of interest. Longer term traders c
    This z-score indicator shows the correct z-score of an asset, as it uses the normalized price data for calculation, which is the only correct way. Z-score is only applicable for normal distributed data, therefore not the actual price is considered, but the normalised returns, which were assumed to follow a normal distribution. Returns are mean reverting and assumed to follow a normal distribution, therefore z-score calculation of returns is more reliable than z-score on price, as price is NOT m
    Boom and Crash Pro Indicator The Savia Forex Solutions Boom and Crash Pro Indicator gives you highly accurate entries on all Boom and Crash Indices. The Boom and Crash Pro Indicator is dynamic and powerful and is optimized for all timeframes. Trade with improved confidence and maximize your success rate. Benefits Dynamic and Powerful. Boom and Crash Pro Indicator is fully optimized for all chart timeframes. Whether price action is an uptrend, downtrend or trading sideways, Boom and Crash Pro Ind
    RAD CRITICAL LEVES RAD indicator tracks “Relevant Volume” in real time, identifying accumulation and distribution processes, projecting them in the chart as SUPPORT or RESISTANCE zones. Natural   support   and resistance levels are generated by Volume Accumulation and Distribution processes. As these processes evolve, levels at which the relevant volume in the market place is positioned, become difficult areas to cross upwards or downwards. By using this information, traders can identify very s
    インディケータを使用すると、現在の価格の方向性と市場のボラティリティを判断できます。このバージョンのTradersDynamic Indexでは、履歴データの再描画が排除され、アルゴリズムの計算速度が最適化され、より正確な調整のための外部パラメーターが増え、その機能が拡張されました。初期オシレーターの選択と平均の平滑化方法が追加されました。 。 パラメーター: Mode Osc - 推定発振器の選択 Period Osc - 使用する発振器の計算期間 Price Osc - 振動計算の適用価格 Osc volatility bands period - オシレーターのボラティリティ期間 Osc volatility bands multiplier - オシレーターのボラティリティ乗数 Smoothing Osc price line period - 本線の平滑化期間 Smoothing Osc price line method - 本線の平滑化方法 Smoothing Osc signal line period - 信号線の平滑化周期 Smoothing Osc signal
    The patterns of 3 (three) Candles: Three White Soldiers; Three Black Crows; These are reversal patterns widely used by traders, as they have a high probability of showing the inversion of the current market movement. For example, if in a bullish trend there are three black crows, there is a high probability of reversing the current bullish movement. The Three White Soldiers have the following characteristics: There are 3 consecutive candles with a good body, that is, the difference between th
    Trend driver bars is the manual trading system, which defines current trend continue or it's pull-back/reverse. "Driver" bars - are price action patterns that has powerfull affect on market, defining it's near future direction. Generally, driver bars represents trend "skeleton" and often anticipates new market impulse. System plots arrows when market shows 3 pattenrs in a row(most powerfull combo-pattern), and makes fast scalping of incomming movement. Loss positions closes by common profit. Lot
    このプロダクトを購入した人は以下も購入しています
    Quantum TrendPulse を ご紹介します。これは、   SuperTrend   、   RSI   、および Stochastic のパワーを 1 つの包括的なインジケーターに組み合わせて、取引の可能性を最大限に引き出す究極の取引ツールです。精度と効率を求めるトレーダー向けに設計されたこのインジケーターは、市場のトレンド、勢いの変化、最適なエントリー ポイントとエグジット ポイントを自信を持って特定するのに役立ちます。 主な特徴: SuperTrend 統合: 現在の市場動向に簡単に追従し、収益性の波に乗ることができます。 RSI精度: 買われすぎと売られすぎのレベルを検出し、市場の反転のタイミングに最適で、SuperTrendのフィルターとして使用されます。 確率的精度: 確率的振動を活用して、変動の激しい市場で隠れたチャンスを見つけます。SuperTrend のフィルターとして使用されます。 マルチタイムフレーム分析:   M5 から H1 または H4 まで、さまざまなタイムフレームで市場を常に把握します。 カスタマイズ可能なアラート: カスタム取引条件が満たされ
    TPSpro TREND PRO は 、市場を自動的に分析し、トレンドとその各変化に関する情報を提供し、再描画せずに取引にエントリーするためのシグナルを提供するトレンド指標です。 インジケーターは各ローソク足を使用し、個別に分析します。上向きまたは下向きのさまざまな衝撃を指します。通貨、仮想通貨、金属、株、指数の取引への正確なエントリーポイント! バージョンMT5                   インジケーターの完全な説明     RFI LEVELS インジケーター と併用することをお勧めします。 主な機能: レンダリングなしで正確な入力信号! シグナルが表示されると、それは関連性を維持します。これは、シグナルを提供してからそれを変更し、その結果、入金された資金が失われる可能性があるリドローインジケーターとの重要な違いです。より高い確率と精度で市場に参入できるようになりました。矢印が表示された後、ターゲットに到達する (利益確定) か反転シグナルが表示されるまで、ローソク足に色を付ける機能もあります。 STOP-LOSS/TAKE-PROFITゾーンの表示 エントリーポイントを
    これはMT5のインジケーターで、再描画なしで取引に参入するための正確なシグナルを提供します。 外国為替、暗号通貨、金属、株式、インデックスなど、あらゆる金融資産に適用できます。かなり正確な見積もりを提供し、取引を開始して終了するのに最適な時期を教えてくれます。1つのシグナルを処理しただけでインジケーターの元が取れた例の 動画 (6:22)をご覧ください。Entry PointsPro インジケーターの助けを借りたほとんどのトレーダーの最初の1週間の結果が改善しています。 Telegramグループ に登録してください。Entry Points Proインジケーターのメリットは次の通りです。 再描画のないエントリーシグナル 再描画されるインジケーターでは一度表示されたシグナルが削除されて大きな金銭的損失につながることがありますが、これと異なり、表示されて確認されたシグナルは消えることがありません。 エラーなしの取引開始 インジケーターアルゴリズムによって取引を開始する(資産を売買する)理想的な瞬間を見つけることができます。それを使用するすべてのトレーダーの成功率が向上します。 あら
    指示する     ロシア     -        utilizar con   el indicador の ESP 推奨事項 -   TPSpro トレンド プロフェッショナル版 -   MT5のバージョン 最も重要なことは、将来においても最も重要なことです。 機能のプリンシパル: ゾーンのほとんどは、ベンダーとコンプラドールによってアクティブ化されます。 状況を直感的に把握できるよう、初期の衝動を修正します。 LOGIC AI: MUESTRA zonas (círculos) parabuscar puntos de entrada cuando se activa una plantilla 視覚的に優れた視覚効果があり、最も重要な機能がすべて揃っていることに注意してください。 優れたニベレス/ゾーンの視覚化 (modo MTF) 世界で最も人気のある場所/ゾーンです。これを使用するのに最適な方法です (   TPSproTREND PRO   )。 アルゴリズム プロフェッショナル セパラド パソ ア パソ パラ オペラ それは、オペラハウスやコントラ・デ・エラの指導におい
    FX Volume MT5
    Daniel Stein
    4.93 (14)
    FX Volume:ブローカー視点で捉える本物の市場センチメント クイック概要 トレード手法をさらに高めたいとお考えですか? FX Volume は、リテールトレーダーやブローカーのポジション状況をリアルタイムで提供します。これは、COTのような遅延レポートよりもはるかに早く知ることができます。安定した利益を目指す方も、さらなる優位性を求める方も、 FX Volume は大きな不均衡を見極め、ブレイクアウトを確認し、リスク管理を洗練させるのに役立ちます。今すぐ始めて、実際の出来高データがどのように意思決定を変革するかを体感してください! 1. FX Volume がトレーダーにとって非常に有益な理由 高精度の早期警戒シグナル • 各通貨ペアを売買しているトレーダー数を、他者よりも早く、ほぼリアルタイムで把握できます。 • FX Volume は、複数のリテールブローカーから得られる本物の出来高データを収集し、分かりやすい形式で提供する 唯一 のツールです。 強力なリスク管理 • ロングやショートの大きな偏り(インバランス)を特定し、潜在的なトレンド転換を見逃しません。ストップ
    まず第一に、このトレーディングシステムがノンリペイント、ノンリドロー、ノンラグのインジケーターであることを強調する価値がある。これにより、手動取引とロボット取引の両方に理想的なものになっています。 オンラインコース、マニュアル、プリセットのダウンロード。 「スマートトレンドトレーディングシステム MT5」は、新規および経験豊富なトレーダー向けにカスタマイズされた包括的なトレーディングソリューションです。10以上のプレミアムインジケーターを組み合わせ、7つ以上の堅実なトレーディング戦略を備えており、多様な市場状況に対応する多目的な選択肢となっています。 トレンドフォロー戦略:トレンドを効果的に乗り越えるための正確なエントリーとストップロス管理を提供します。 リバーサル戦略:潜在的なトレンドの反転を特定し、トレーダーがレンジ相場を活用できるようにします。 スキャルピング戦略:高速で正確なデイトレードおよび短期取引のために設計されています。 安定性:すべてのインジケーターはノンリペイント、ノンリドロー、ノンラグであり、信頼性の高いシグナルを保証します。 カスタマイズ:個々の取引の嗜好に合わせ
    FX Power: 通貨の強弱を分析して、より賢い取引を実現 概要 FX Power は主要通貨と金の実際の強弱をあらゆる市場状況で理解するための必須ツールです。強い通貨を買い、弱い通貨を売ることで、 FX Power は取引の意思決定を簡素化し、高い確率の取引機会を見出します。トレンドを追従する場合でも、極端なデルタ値を使用して反転を予測する場合でも、このツールはあなたの取引スタイルに完全に適応します。ただ取引するだけではなく、 FX Power で賢く取引をしましょう。 1. なぜ FX Power がトレーダーにとって非常に有益なのか 通貨と金のリアルタイム強弱分析 • FX Power は主要通貨と金の相対的な強弱を計算し、マーケットダイナミクスに関する明確な洞察を提供します。 • どの資産がリードしているか、または後れを取っているかを監視して、取引するペアを賢く選びましょう。 マルチタイムフレームの包括的なビュー • 短期、中期、長期のタイムフレームで通貨と金の強弱を追跡し、マーケットトレンドに基づいて取引戦略を調整できます。 • スキャルピングからスイングトレード
    IX Power: 指数、商品、暗号資産、外国為替市場の洞察を発見 概要 IX Power は、指数、商品、暗号資産、外国為替市場の強弱を分析するための多用途ツールです。 FX Power が全ての利用可能な通貨ペアデータを活用して外為ペアで最高の精度を提供する一方、 IX Power は基礎資産の市場データにのみ焦点を当てています。この特性により、 IX Power は非外為市場に最適であり、単純な外為分析にも信頼性の高いツールです。どのチャートでもスムーズに機能し、取引判断を向上させるための明確で実行可能な洞察を提供します。 1. IX Power がトレーダーにとって価値がある理由 複数市場での強弱分析 • IX Power は指数、商品、暗号資産、外為シンボルの強弱を計算し、それぞれの市場に合わせた洞察を提供します。 • US30、WTI、ゴールド、ビットコイン、または通貨ペアなどの資産を監視して取引機会を発見できます。 幅広い市場に適応 • 外為取引では、 FX Power が関連する全ての通貨ペアを分析することで比類のない精度を提供します。 • IX Power
    !SPECIAL SALE!  The Trend Forecaster indicator utilizes a unique proprietary algorithm to determine entry points for a breakout trading strategy. The indicator identifies price clusters, analyzes price movement near levels, and provides a signal when the price breaks through a level. The Trend Forecaster indicator is suitable for all financial assets, including currencies (Forex), metals, stocks, indices, and cryptocurrencies. You can also adjust the indicator to work on any time frames, althoug
    Gold Trend - これは優れた株価テクニカル指標です。指標のアルゴリズムは、資産の値動きを分析し、ボラティリティと潜在的なエントリーゾーンを反映しています。 最高の指標シグナル: - 売りの場合 = 赤のヒストグラム + 赤のショートポインター + 同じ方向に黄色のシグナル矢印。 - 買いの場合 = 青のヒストグラム + 青のロングポインター + 同じ方向の水色のシグナル矢印。 インジケータの利点 1. このインディケータは、高い精度でシグナルを発信します。 2. 確定した矢印シグナルは、トレンドが変化したときにのみ再描画されます。 3. どのブローカーのMetaTrader 5取引プラットフォームでも取引できます。 4. あらゆる資産(通貨、金属、暗号通貨、株式、指数など)を取引できます。 5. H1タイムフレーム(中期取引)で取引するのがよい。 6. 各トレーダーがインディケータを自分用に簡単にカスタマイズできるよう、インディケータ設定で個々のパラメータ(TF、色など)を変更できます。 7. このインディケータは、トレーディングシステムの優れたメイン機能として
    FX Dynamic: アダプティブな精度でマーケット分析を新次元へ 概要 トレードの優位性を高めたいとお考えなら、 FX Dynamic が最適です。リアルタイムで変動するマーケット情報に対応し、MetaTraderからのティックごとに即座に反応します。安定した成果を求める方にも、より信頼できるシグナルを探している方にも、 FX Dynamic は重要なチャンスを見極め、エントリーやエグジットを最適化し、リスク管理をさらに正確にする手助けをしてくれます。ぜひ今すぐお試しください。先進的なダイナミック分析でトレードを新たなステージへ! 1. FX Dynamic がトレーダーにとって非常に有益な理由 アダプティブなマーケット追跡 • マーケット構造の変化をほぼリアルタイムで入手し、条件が変わると同時にトレードを調整できます。 • FX Dynamic は MetaTrader のライブデータを利用して、素早い値動きを捉え、分かりやすい形式で提示します。 高度なリスク管理 • 新たに発生する不均衡やボラティリティスパイクを検知し、トレンド転換を予測。より安心してストップや利確目
    ご紹介     Quantum Breakout PRO は 、ブレイクアウト ゾーンの取引方法を変革する画期的な MQL5 インジケーターです。 13年以上の取引経験を持つ経験豊富なトレーダーのチームによって開発されました。     クォンタム ブレイクアウト プロ   は、革新的でダイナミックなブレイクアウト ゾーン戦略により、あなたのトレーディングの旅を新たな高みに押し上げるように設計されています。 クォンタム ブレイクアウト インジケーターは、5 つの利益ターゲット ゾーンを備えたブレイクアウト ゾーン上のシグナル矢印と、ブレイクアウト ボックスに基づいたストップロスの提案を提供します。 初心者トレーダーにもプロのトレーダーにも適しています。 量子EAチャネル:       ここをクリック 重要!購入後、インストールマニュアルを受け取るためにプライベートメッセージを送ってください。 推奨事項: 時間枠: M15 通貨ペア: GBPJPY、EURJPY、USDJPY、NZDUSD、XAUUSD アカウントの種類: ECN、Raw、またはスプレッドが非常に低い R
    今、147ドル(いくつかの更新後に499ドルに増加します) - 無制限のアカウント(PCSまたはMac) RelicusRoad ユーザー マニュアル + トレーニング ビデオ + プライベート Discord グループへのアクセス + VIP ステータス 市場の新しい見方 RelicusRoad は、外国為替、先物、暗号通貨、株式、および指数の世界で最も強力な取引インジケーターであり、トレーダーに収益を維持するために必要なすべての情報とツールを提供します。初心者から上級者まで、すべてのトレーダーが成功するためのテクニカル分析と取引計画を提供します。これは、将来の市場を予測するのに十分な情報を提供する重要な取引指標です。意味をなさないチャート上のいくつかの異なる指標ではなく、完全な解決策を信じています.これは、信号、矢印 + 価格アクション情報を表示するオールインワンのインジケーターで、他に類を見ない非常に正確です。 強力な AI に基づいて、RelicusRoad は不足している情報とツールを提供して、あなたを教育し、トレーディングのプロ、成功したトレーダーにします。 ほと
    このダッシュボードは、選択されたシンボルの最新の利用可能なハーモニックパターンを表示するので、時間を節約し、より効率的に /   MT4バージョン 。 無料インジケーター:   Basic Harmonic Pattern インジケーター列 Symbol : 選択したシンボルが表示されます。 Trend :   強気または弱気 Pattern : パターンの種類(ガートレー、バタフライ、バット、カニ、サメ、サイファー、ABCD) Entry : エントリー価格 SL: ストップロス価格 TP1: 1回目の利食い価格 TP2: 2回目の利食い価格 TP3:   3回目の利食い価格 Current price :   現在値 Age (in bars):    最後に描画されたパターンの年齢 主な入力項目 Symbols:   "28 Major Currency Pairs "または "Selected Symbols "から選択。 Selected Symbols:   カンマで区切られた監視したいシンボル("EURUSD,GBPUSD,XAUUSD")。ブローカーがペアに接
    まず第一に、この取引インジケーターは再描画されず、再描画されず、遅延しないことを強調する価値があります。これにより、手動取引とロボット取引の両方に理想的なものになります。 ユーザーマニュアル:設定、入力、戦略。 アトミックアナリストは、価格の強さとモメンタムを利用して市場でより良いエッジを見つけるためのPA価格アクションインジケーターです。ノイズや誤ったシグナルを除去し、取引ポテンシャルを高めるための高度なフィルターを備えています。複雑なインジケーターの複数のレイヤーを使用して、アトミックアナリストはチャートをスキャンし、複雑な数学的計算をシンプルなシグナルと色に変換します。これにより、どのような初心者トレーダーでも理解して使用し、一貫した取引の決定を行うことができます。 「アトミックアナリスト」は、新規および経験豊富なトレーダー向けにカスタマイズされた包括的な取引ソリューションです。プレミアムインジケーターとトップノッチの機能を1つの取引戦略に組み合わせ、すべてのタイプのトレーダーにとって汎用性のある選択肢にします。 デイリートレーディングとスキャルピング戦略:高速で正確なデイ
    Was: $249  Now: $149   Market Profile defines a number of day types that can help the trader to determine market behaviour. A key feature is the Value Area, representing the range of price action where 70% of trading took place. Understanding the Value Area can give traders valuable insight into market direction and establish the higher odds trade. It is an excellent addition to any system you may be using. Inspired by Jim Dalton’s book “Mind Over Markets”, this indicator is designed to suit the
    FX Levels: あらゆる市場における非常に高精度なサポート&レジスタンス 概要 通貨ペア、株式指数、個別銘柄やコモディティなど、どのような市場でも信頼できるサポートとレジスタンスを特定したいですか? FX Levels は伝統的な “Lighthouse” メソッドと先進的な動的アプローチを融合し、ほぼ汎用的な精度を実現します。ブローカーの実務経験を活かし、自動化されたデイリー更新とリアルタイム更新を組み合わせることで、 FX Levels は反転ポイントを見つけ、利益目標を設定し、自信をもってトレードを管理するための手助けをします。今すぐ試してみて、サポート/レジスタンス分析の正確性がどれほどトレードを向上させるかを実感してください! 1. FX Levels がトレーダーにとって非常に有用な理由 非常に正確なサポート&レジスタンスゾーン • FX Levels は異なるブローカー環境でもほぼ同一のゾーンを生成するよう設計されており、データフィードの差異や時刻設定のずれによる不一致を解消します。 • つまり、どのブローカーを利用していても一貫したレベルが得られるため、戦
    これはほぼ間違いなく、MetaTraderプラットフォームで見つけることができる最も完全な調和価格形成自動認識インジケーターです。 19種類のパターンを検出し、フィボナッチプロジェクションをあなたと同じように真剣に受け止め、潜在的逆転ゾーン(PRZ)を表示し、適切なストップロスとテイクプロフィットレベルを見つけます。 [ インストールガイド | 更新ガイド | トラブルシューティング | よくある質問 | すべての製品 ] 19の異なる調和価格形成を検出します プライマリ、派生および補完フィボナッチ投影(PRZ)をプロットします 過去の価格行動を評価し、過去のすべてのパターンを表示します この指標は、独自の品質とパフォーマンスを分析します 適切なストップロスとテイクプロフィットのレベルを表示します ブレイクアウトを使用して適切な取引を通知します すべてのパターン比をグラフにプロットします 電子メール/音声/視覚アラートを実装します スコット・M・カーニーの本に着想を得て、この指標は最も純粋で急を要するトレーダーのニーズを満たすように設計されています。ただし、トレードを容易にする
    Royal Scalping Indicator is an advanced price adaptive indicator designed to generate high-quality trading signals. Built-in multi-timeframe and multi-currency capabilities make it even more powerful to have configurations based on different symbols and timeframes. This indicator is perfect for scalp trades as well as swing trades. Royal Scalping is not just an indicator, but a trading strategy itself. Features Price Adaptive Trend Detector Algorithm Multi-Timeframe and Multi-Currency Trend Low
    Royal Wave Pro M5
    Vahidreza Heidar Gholami
    3.5 (4)
    Royal Wave is a Trend-Power oscillator which has been programmed to locate and signal low-risk entry and exit zones. Its core algorithm statistically analyzes the market and generates trading signals for overbought, oversold and low volatile areas. By using a well-designed alerting system, this indicator makes it easier to make proper decisions regarding where to enter and where to exit trades. Features Trend-Power Algorithm Low risk Entry Zones and Exit Zones Predictions for Overbought and Over
    まず最初に、このトレーディングシステムがリペイントされず、再描画されず、遅延しないことを強調する価値があります。これにより、プロのトレーディングに最適な状態になります。 オンラインコース、ユーザーマニュアル、デモ。 「スマートサポートアンドレジスタンストレーディングシステム」は、新規および経験豊富なトレーダー向けにカスタマイズされた高度なインジケーターです。この包括的なシステムは、7以上の戦略、10のインジケーター、およびデイトレード戦略、スイングトレード戦略、サポートおよびレジスタンス戦略、ローソク足パターン戦略、VWAP戦略、マルチタイムフレームトレンド戦略など、さまざまなトレーディングアプローチを組み合わせています。これは、矢印信号、エントリーポイント、出口ポイント、トレードアラート、より高い時間枠のトレンド分析、リアルタイムのトレードモニタリング、そして洞察力のあるトレンドとボリュームキャンドルの着色を提供します。自動的なサポートとレジスタンスの検出により、さまざまな市況下でトレーダーが的確な決定を下すのを支援する多面的なインジケーターとなっています。 スマートサポートアン
    Gold Venamax - これは最高の株式テクニカル指標です。 指標アルゴリズムは資産の価格変動を分析し、ボラティリティと潜在的なエントリーゾーンを反映します。 インジケーターの機能: これは、快適で収益性の高い取引のためのマジックとトレンド矢印の 2 つのブロックを備えたスーパー インジケーターです。 チャート上にブロックを切り替えるための赤いボタンが表示されます。 マジックはインジケーター設定で設定されているため、異なるブロックを表示する 2 つのチャートにインジケーターをインストールできます。 Gold Venamax は、異なる矢印バッファー (GV と SD) を備えた 2 つのチャートに配置できます。 これを行うには、設定で異なる Magic を選択する必要があります。たとえば、あるマジック = 999、別のマジック = 666 を選択します。次に、チャート上の赤いボタンで矢印バッファを選択できます。 入力するのに最適な信号 = 両方のバッファ (GV および SD) の信号矢印 + 3 本すべての MA ライン (赤または青) の方向に従います。 インジケー
    Timeframes Trend Scanner is a trend analyzer or trend screener indicator that helps you know the trend in all timeframes of symbol you're watching. This indicator provides clear & detailed analysis results on a beautiful dashboard, let you able to use this result right away without need to do any additional analysis. How it works Step 1: Calculate values of 23 selected & trusted technical indicators (Oscillator & Moving Average indicators) Step 2: Analyze all indicators using best practices to f
    Gold Pointer は最高のトレンド・インジケータです。このインジケーターのユニークなアルゴリズムは、テクニカル分析および数学的分析の要素を考慮して資産価格の動きを分析し、最も収益性の高いエントリーポイントを決定し、買いまたは売り注文を発注するシグナルを出します。 最良のインジケーターシグナル: - 売り=赤のトレンドライン+赤のTFインジケーター+同じ方向に黄色のシグナル矢印。 - 買いの場合 = 青のトレンドライン + 青のTFインディケータ + 同じ方向の水色のシグナル矢印。 インジケータの利点 1. このインディケータは、高い精度でシグナルを発信する。 2. 2.シグナル(矢印)を音声(アラート&メッセージ)で確認した後、インジケータの確定シグナルは消えず、再描画されません。 3. どのブローカーのMetaTrader 5取引プラットフォームでも取引できます。 4. あらゆる資産(通貨、金属、暗号通貨、株式、指数など)を取引できます。 5. どのタイムフレームでも取引できます(M5-M15スキャルピングと取引/M30-N1中期取引/H4-D1長期取引)。 6.
    MetaForecast M5
    Vahidreza Heidar Gholami
    5 (2)
    MetaForecastは、価格データのハーモニクスに基づいて、どんな市場の未来を予測し視覚化します。市場が常に予測可能ではありませんが、価格にパターンがある場合、MetaForecastは可能な限り正確な未来を予測できます。他の類似製品と比較して、MetaForecastは市場のトレンドを分析することでより正確な結果を生成することができます。 入力パラメータ Past size (過去のサイズ) MetaForecastが将来の予測を生成するために使用するバーの数を指定します。モデルは選択したバー上に描かれた黄色の線で表されます。 Future size (将来のサイズ) 予測すべき将来のバーの数を指定します。予測された将来は、ピンクの線で表示され、その上に青い回帰線が描かれます。 Degree (程度) この入力は、MetaForecastが市場で行う分析のレベルを決定します。 Degree 説明  0 Degree 0の場合、価格の全てのピークや谷、そして詳細をカバーするために、「Past size」の入力に大きな値を使用することが推奨されています。  1 (推奨) Degre
    note: this indicator is for METATRADER4, if you want the version for METATRADER5 this is the link:  https://www.mql5.com/it/market/product/108106 TRENDMAESTRO ver 2.4 TRENDMAESTRO recognizes a new TREND in the bud, he never makes mistakes. The certainty of identifying a new TREND is priceless. DESCRIPTION TRENDMAESTRO identifies a new TREND in the bud, this indicator examines the volatility, volumes and momentum to identify the moment in which there is an explosion of one or more of these data a
    Real Trend Zigzag PRO   shows the real trend of a market, u nlike the default Zigzag indicator. It calculates the trend in real time and shows green lines for upwards trends, red lines for downward trends and blue lines for no trends.  Regarding the old slogan "the trend is your friend" it helps you to decide if should open a buy or sell position. The PRO version is a multi timeframe zigzag (MTF). Means, it shows the trend of the current timeframe as well as the trend of a higher or lower time.
    Was: $299  Now: $149  Supply Demand uses previous price action to identify potential imbalances between buyers and sellers. The key is to identify the better odds zones, not just the untouched ones. Blahtech Supply Demand indicator delivers functionality previously unavailable on any trading platform. This 4-in-1 indicator not only highlights the higher probability zones using a multi-criteria strength engine, but also combines it with multi-timeframe trend analysis, previously confirmed swings
    WHY IS OUR FXACCCURATE LS MT5 THE PROFITABLE ? PROTECT YOUR CAPITAL WITH RISK MANAGEMENT Gives entry, stop and target levels from time to time. It finds Trading opportunities by analyzing what the price is doing during established trends. POWERFUL INDICATOR FOR A RELIABLE STRATEGIES We have made these indicators with a lot of years of hard work. It is made at a very advanced level. Established trends provide dozens of trading opportunities, but most trend indicators completely ignore them! The
    Golden Spikes Detector Acknowledgement and Dedications:  The name of this indicator was Inspired by an Original; Mr Grant Koopman; a Knowledgeable and experienced Synthetics trader. I dedicate this indicator to Mr Grant.  Overview:   The Golden Spikes Premium is a groundbreaking trading indicator meticulously crafted for the Boom and Crash indices on the Deriv market. Tailored to meet the needs of discerning traders, this powerful tool operates exclusively on the one-minute timeframe, providing
    作者のその他のプロダクト
    ピボット レベルは、すべての市場で認められている確立された技術レベルです。 このインジケーターは、任意のシンボルについて、現在の四半期ごと、月ごと、週ごと、日ごと、および 4 時間ごとのピボットをチャートに描画します。また、各期間のサポート レベルとレジスタンス レベルを表示し、レベル 1 ~ 4 から表示するものを選択することもできます。     次の中からピボットのタイプを選択します。 標準 カマリリャ デマーク ウッディ フィボナッチ 元の仕様に従って、DeMark ピボットには単一のサポート レベルとレジスタンス レベルがあることに注意してください。 インジケーター ウォールは、ラインが価格に触れた場合、ラインの描画方法を変更します。これは非常に役立ち、ラインのサポートまたは抵抗の強さは、一度触れると大幅に減少します. 期間ごとに、予測されたピボット レベルを表示するように選択できます。これは通常のピボットと同じ計算を使用しますが、現在不完全な時間枠で機能します。そのため、価格がその範囲の大部分をすでにカバーしている、その期間の終わりに向かって使用するのが最適です。 設定 す
    TheStrat Candles
    Robert Gerald Wood
    5 (1)
    この指標は、以下に基づいて各ろうそくの上または下にラベルを描画します。     ロブ・スミス     ストラト   それらがチャート上で時間の経過とともに発展するにつれて。 価格が変化するにつれて、ろうそくは 3 つの状態を切り替えることができます。ローソク足が最初に開いたとき、それが前のローソク足の高値と安値の中に完全に収まっている場合、タイプ 1 として開始されます。タイプ 2 であり、値動きが不安定で方向性がない場合、前のローソク足の反対側を壊してタイプ 3 になる可能性があります。 キャンドル 各キャンドルは、前のキャンドルとの関係によって定義されます。 タイプ 1 - ろうそくの内側 - ろうそくは完全に前のろうそくの高値と安値の範囲内にあります。ろうそくの内側は、市場が優柔不断であることを示しています。 タイプ 2 - トレンド ローソク足 - ローソク足は、前のローソク足の高値または安値のいずれかの上または下に伸びますが、両方ではありません。 タイプ 3 - ろうそくの外側 - ろうそくは前のろうそくの高値と安値の両方を破っています。外側のローソク足は、価格が
    TheStrat Monitor
    Robert Gerald Wood
    3 (2)
    If you've not already learnt about The Strat trading strategy , go google it now. I promise it won't be a waste of your time, and you will likely learn some new tricks whether you use it or not. OK, so now you know what TheStrat is, you will be able to understand what this indicator can do for you. Key Features In short, the Indicator will: Show Timeframe Continuity for all supported timeframes Supports two timeset views, Day trader and Swing trader Show when Full Timeframe Continuity is in pla
    This indicator draws the prior Highs and Lows for multiple timeframes, and can display potential Take Profit and Stop Loss levels. In Rob Smith's # The Strat   terms,   these are potential entry points, or alternatively potential targets for open positions. I like to use them in both ways. On a lower timeframe, say 5 minutes to get a good entry on a daily or weekly level, and then as a potential target. Very small stops required giving an excellent risk/reward ratio. Please watch the DEMO video
    This indicator will draw patterns based on Rob Smith's The Strat as they emerge in real time on your chart. As price evolves, TheStrat offers 18 distinct price action patterns that can help you get good entries in the market. Each pattern involves two or three candles, and this indicator will draw a bounding box around the candles and name the pattern. The indicator also shows when a potential setup is forming, known by stratters as an Actionable signal. Candles Each candle is defined by its
    FTFC は、Rob Smith の The Strat で定義されている Full Timeframe Continuity を指します。 このインジケーターはチャートに 2 本の線を引きます。四半期、月次、週次、日次、または時間次の開始レベルの最高値の 1 つと、これらの値の最低値の 2 つ目です。これにより、取引が一方向に非常に強くなる可能性が高いチャネルより上または下のチャネルが得られます。ライン間では、価格アクションが途切れ途切れになり、より広いストップを使用する必要がある場合があります. 高値と安値の中間点を示すために、3 番目の破線も描画されます。これは、市場が価格を特定の方向に押し上げようとするため、サポートまたはレジスタンスを見つけるのに適した場所です。色を NONE に設定して選択すると、この行をオフにすることができます。 設定 四半期ごとのレベルを含める 一部の人々はそれを無視することを好むため、四半期の始値を計算に含めることを選択できます。 IncludeCurrentTimeframeOpen true の場合、現在表示されている時間枠が H1、D1、W1、
    The Strat を使用して取引する場合、複数の時間枠に注意することが重要です。 このインジケーターは、各時間枠の現在のローソク足の毎日、毎週、毎月、および四半期ごとの状態を示します。 円のアイコンは、その時間枠のろうそくが現在インサイド、または TheStrat 用語でタイプ 1 であることを示します。 Inside Day ローソク足が値動きを強化しており、レンジのブレイクアウトを探しています。 上向きまたは下向きの三角形のアイコンは、トレンド キャンドル、または TheStrat 用語ではタイプ 2 です。トレンドろうそくは強気または弱気のいずれかであり、以前のろうそくの範囲を突破し、現在一方向にトレンドになっていることを示します. 正方形のアイコンはアウトサイド キャンドル、またはストラト用語でタイプ 3 です。これは 2 つのことを示しています。1 つはその時間枠での方向性について価格が未定であり、おそらく非常に途切れ途切れであるということです。もう 1 つは、より短い時間枠では短い反転取引を行う良い機会がある可能性が高いということです。正方形は強気または弱気の色になり、ど
    This indicator is designed to make reviews of many charts on different timescales quicker, and easier to do. Track Time and Price across multiple charts Change Symbol on one chart and all other charts of the same symbol will be changed too. Easy to use, quick to master The indicator allows you to identify the price and time where the mouse pointer is on the current chart, across all other charts open on the same Symbol. This allows you to quickly see information on multiple charts whereas normal
    このインジケーターは、さまざまなタイムスケールでの多くのチャートのレビューをより迅速かつ簡単に行えるように設計されています。 複数のチャートで時間と価格を追跡 1 つのチャートでシンボルを変更すると、同じシンボルの他のすべてのチャートも変更されます。 使いやすく、すぐにマスターできます このインジケーターを使用すると、同じシンボルで開いている他のすべてのチャートで、マウス ポインターが現在のチャートにある価格と時間を特定できます。これにより、複数のチャートで情報をすばやく確認できますが、通常は同じ場所を特定するのに時間がかかります。 開いているすべてのチャートで時間だけを追跡することもできます。これにより、発散ハンティング時に簡単にナビゲートできます。 1 つのチャートでシンボルを変更すると、同じシンボルの他のすべてのチャートが新しいシンボルに切り替わり、時間枠の設定が維持されます。 使い方 チャートを確認するとき、傾向と取引レベルを特定するために、いくつかの時間枠を見るのが好きです。このツールを作成したのは、それを支援するためであり、長期にわたっていくつかのチャートを見渡すビジュアル
    このスクリプトを使用すると、トレンド ライン、フィボナッチ リトレースメントなど、あらゆる種類の描画オブジェクトを 1 つ以上の他のチャートにコピーできます。 デフォルトでは、スクリプトは現在のチャート (スクリプトが適用されたチャート) のすべてのオブジェクトを、現在ロードされている同じシンボルの他のチャートにコピーします。 設定 目的地の時間枠 PERIOD_CURRENT 以外に設定すると、スクリプトが適用されたチャートと同じシンボルの開いているチャートにオブジェクトがコピーされます。 値を特定の時間枠、たとえば PERIOD_D1 に設定すると、同じ銘柄と期間のチャートのみが更新されます。 CopyObjectsOfType これをコピーしたい特定のタイプのオブジェクトに設定すると、そのタイプのオブジェクトのみが他のチャートにコピーされます。 CopyIndicatorWindowObjects True に設定すると、インジケータ ウィンドウのオブジェクトもコピーされます。これは、ソース チャートと同じ指標を同じ順序で持つ 2 番目のチャートに依存します。 チャート
    FREE
    A simple script that can delete all the drawing objects on a chart, or just the objects of a specific type. Settings: DeleteObjectsOfType By default the value will be blank which means ALL drawing objects on the chart will be deleted. If you only wish to delete specific types of drawing object, change this setting to the type of object to delete. For example, Fibonacci Retracement, Text, Label or Trend Line. Please see the demonstration video for more information.
    FREE
    Rob Smith の TheStrat について学んでいるときにこの単純なインジケーターを作成しましたが、とても役立つと思いました。共有したいと思います。役に立つと思われる場合は、私が MQL5 で公開した他の指標を見てください。 このインジケーターは、より高い時間枠から選択した価格レベルを示す単一の線をチャートに描画するだけです。 設定を使用すると、表示される時間枠を完全に制御できますが、デフォルトでは 、スケールを 1 ステップ上げるだけで、より高い時間枠自体が計算されます。たとえば、H1 チャートを開くと、H4 チャートのデータが表示されます。 設定 トラックタイムフレーム 価格レベルが引き出される時間枠を選択します。現在のデフォルト設定のままにしておくと、適切な時間枠が選択されます。線は常に上向きに調整されるため、チャートを確認して時間枠を変更する場合、これは非常に役立ちます。 トラックバリュー 下記の標準価格からお選びいただけます。デフォルトは始値です。 PRICE_CLOSE 終値 PRICE_OPEN 始値 PRICE_HIGH 期間中の最高価格 PRICE_LOW
    FREE
    This script allows you to toggle the "Show Trade Levels" option, but for the current chart only. Normally, you can only change the setting using the Options -> Chart menu for ALL charts, but this script allows you to do it for a SINGLE chart. I'm using it when I take screenshots, because most of the time I'm not trying to show the trades, just some functionality of one of my other tools. Iif you need that functionality, then this script is very helpful! If the script helps you, please let me k
    FREE
    市場はラウンド数を非常に好み、下落市場ではサポートとして機能し、価格が上昇するとレジスタンスとして機能することがよくあります。 この指標は、ラウンド値で価格レベルを描画するように設計されています。これは自動的に行われますが、それをオーバーライドして表示するレベルを決定するオプションもあります。 ラウンド レベルは、10、20、30 などの 10 のステップと同じくらい単純にすることができます。また、外国為替を使用している場合は、0.1 または 0.01 での変化を見たいと思うかもしれません。 インジケーターは、メジャーとマイナーの 2 つのクラスの線をそれぞれ異なる形式で描画します。これにより、レベルの 2 つの異なる変化の間の変化を同時に見ることができます。 アラート このインジケーターには、価格が設定可能な距離内にある場合に、メジャー、マイナー、または両方の価格レベルでアラートを鳴らす機能が含まれています。 自動セットアップ デフォルトでは、指標はメジャー価格とマイナー価格の両方の適切なレベルを決定します。これは、いつでも画面に表示する行数を制御する構成可能な DensityI
    平均真の範囲(ATR)は、設定された期間における価格の変動量を測定するために一般的に使用される指標です。しかし、それが与える値はいかなる種類の境界内でも定義されていないため、ストップロスや利益計算以外の目的で使用することはほとんど不可能です。 このインジケーターは標準のATRインジケーターですが、極端な値を確認できるようにパーセンタイル境界を導入しています。 パーセンタイルとスプリットメディアンと呼ばれるものから選択できます パーセンタイルレベル パーセンタイルレベルは1%、5%、20%、50%、80%、95%、99%で描画され、これらは価格が他のすべての値との関係である場所を示しています。たとえば、5%レベルは、境界線より下では、ATR読み取り値の5%のみが低くなり、99%は、そのレベルより上のATR値のうち、値の1%のみが高くなることを示します。 80%を超えると、新しい取引のためにポジションサイズを小さくすることを選択できます。また、95%を超えると、勢いが変わる前に利益を得る良い機会になる可能性があります。 分割中央値 Split Medians設定は、Extr
    範囲の枯渇は、価格が現在の期間の予想される範囲を満たすか超えると発生します。これらのレベルでは、価格は期間の初期に比べて勢いを失い始めるため、新しいポジションをとっていないことを確認するのに良いポイントです. このインジケーターは、チャート上でこれが発生する可能性が高い場所を示し、日次、週次、月次の期間のレベルを示します。 価格がこれらの枯渇レベルを超えている場合は、動きの背後にある勢いが非常に強く、より高い時間枠レベルに向かっている可能性が高いことを示しています. インジケーターは、好みに応じて、Average True Range (ATR) または Average Range (ADR) 計算を使用できます。デフォルトでは、外国為替チャートでよりうまく機能することがわかっているため、ATR を使用しますが、ADR は株式ベースのインデックスとシンボルで優位に立っています。 インジケーターには、以下で説明するいくつかの描画モードがあり、ニーズに合わせて調整できます。 設定 計算モード レベルの計算には、AverageTrueRange (ATR) または AverageDaily
    This indicator will draw a label above or below each candle based on   Rob Smith's   The Strat   as they develop over time on your chart. As price evolves, a candle can switch between three states. When the candle first opens, if it sits completely within the previous candles high and low, then it will start as a Type 1. As time moves on, if it breaks either the high or low of the previous candle, it will be come a type 2, and should the price action be volatile and directionless, it may then
    FTFC は、Rob Smith の The Strat で定義されている Full Timeframe Continuity を指します。 このインジケーターはチャートに 2 本の線を引きます。四半期、月次、週次、日次、または時間次の開始レベルの最高値の 1 つと、これらの値の最低値の 2 つ目です。これにより、取引が一方向に非常に強くなる可能性が高いチャネルより上または下のチャネルが得られます。ライン間では、価格アクションが途切れ途切れになり、より広いストップを使用する必要がある場合があります. 高値と安値の中間点を示すために、3 番目の破線も描画されます。これは、市場が価格を特定の方向に押し上げようとするため、サポートまたはレジスタンスを見つけるのに適した場所です。色を NONE に設定して選択すると、この行をオフにすることができます。 設定 四半期ごとのレベルを含める 一部の人々はそれを無視することを好むため、四半期の始値を計算に含めることを選択できます。 IncludeCurrentTimeframeOpen true の場合、現在表示されている時間枠が H1、D1、W1、
    This indicator will draw patterns based on   Rob Smith's   The Strat   as they emerge in real time on your chart. As price evolves,   TheStrat   offers 18 distinct price action patterns that can help you get good entries in the market. Each pattern involves two or three candles, and this indicator will draw a bounding box around the candles and name the pattern. The indicator also shows when a potential setup is forming, known by stratters as an Actionable signal. Candles Each candle is defin
    ストラトの取引戦略 についてまだ学んでいない場合は、今すぐグーグルで検索してください。時間を無駄にしないことを約束します。使用するかどうかに関係なく、いくつかの新しいトリックを学ぶことができます。 OK、これで TheStrat とは何かがわかったので、このインジケーターが何をしてくれるかを理解できるようになります。 主な機能 つまり、インジケーターは次のことを行います。 サポートされているすべての時間枠の時間枠の連続性を表示 デイトレーダーとスイングトレーダーの2つのタイムセットビューをサポート 連続する 4 つの時間枠で完全な時間枠の継続性が適用されている場合に表示します 各時間枠の現在のろうそくの状態を表示します すべての時間枠で現在のパターンがあれば表示します 有効なパターンと実行可能なパターンの両方を表示 5 秒ごとに更新 (1 秒から設定可能) パネルをクリックして、選択した銘柄と時間枠のチャートを開くことができます チャートを開くために使用するチャート テンプレートを選択できます 表示するグループとそのグループ内のシンボルを選択します インジケーターは、ブローカーがサポ
    The Strat を使用して取引する場合、複数の時間枠に注意することが重要です。 このインジケーターは、各時間枠の現在のローソク足の毎日、毎週、毎月、および四半期ごとの状態を示します。 円のアイコンは、その時間枠のろうそくが現在インサイド、または TheStrat 用語でタイプ 1 であることを示します。 Inside Day ローソク足が値動きを強化しており、レンジのブレイクアウトを探しています。 上向きまたは下向きの三角形のアイコンは、トレンド キャンドル、または TheStrat 用語ではタイプ 2 です。トレンドろうそくは強気または弱気のいずれかであり、以前のろうそくの範囲を突破し、現在一方向にトレンドになっていることを示します. 正方形のアイコンはアウトサイド キャンドル、またはストラト用語でタイプ 3 です。これは 2 つのことを示しています。1 つはその時間枠での方向性について価格が未定であり、おそらく非常に途切れ途切れであるということです。もう 1 つは、より短い時間枠では短い反転取引を行う良い機会がある可能性が高いということです。正方形は強気または弱気の色になり、ど
    ピボット レベルは、すべての市場で認められている確立された技術レベルです。 このインジケーターは、任意のシンボルについて、現在の四半期ごと、月ごと、週ごと、日ごと、および 4 時間ごとのピボットをチャートに描画します。また、各期間のサポート レベルとレジスタンス レベルを表示し、レベル 1 ~ 4 から表示するものを選択することもできます。     次の中からピボットのタイプを選択します。 標準 カマリリャ デマーク ウッディー フィボナッチ 元の仕様に従って、DeMark ピボットには単一のサポート レベルとレジスタンス レベルがあることに注意してください。 インジケーター ウォールは、ラインが価格に触れた場合、ラインの描画方法を変更します。これは非常に役立ち、ラインのサポートまたは抵抗の強さは、一度触れると大幅に減少します. 期間ごとに、予測されたピボット レベルを表示するように選択できます。これは通常のピボットと同じ計算を使用しますが、現在不完全な時間枠で機能します。そのため、価格がその範囲の大部分をすでにカバーしている、その期間の終わりに向かって使用するのが最適です。 設定
    市場はラウンド数を非常に好み、下落市場ではサポートとして機能し、価格が上昇するとレジスタンスとして機能することがよくあります。 この指標は、ラウンド値で価格レベルを描画するように設計されています。これは自動的に行われますが、それをオーバーライドして表示するレベルを決定するオプションもあります。 ラウンド レベルは、10、20、30 などの 10 のステップと同じくらい単純にすることができます。また、外国為替を使用している場合は、0.1 または 0.01 での変化を見たいと思うかもしれません。 インジケーターは、メジャーとマイナーの 2 つのクラスの線をそれぞれ異なる形式で描画します。これにより、レベルの 2 つの異なる変化の間の変化を同時に見ることができます。 アラート このインジケーターには、価格が設定可能な距離内にある場合に、メジャー、マイナー、または両方の価格レベルでアラートを鳴らす機能が含まれています。 自動セットアップ デフォルトでは、指標はメジャー価格とマイナー価格の両方の適切なレベルを決定します。これは、いつでも画面に表示する行数を制御する構成可能な DensityInd
    Average True Range (ATR) は、設定された期間における価格の変動量を測定する一般的に使用される指標です。しかし、それが与える値はいかなる種類の境界内でも定義されていないため、ストップロスまたはテイクプロフィットの計算以外に使用することはほとんど不可能です. この指標は標準的な ATR 指標ですが、パーセンタイル境界を導入したので、極値を確認できます。 パーセンタイルと、分割中央値と呼ばれるものから選択できます パーセンタイル レベル パーセンタイル レベルは 1%、5%、20%、50%、80%、95%、99% で描かれ、これらは価格が他のすべての値に関連してどこにあるかを示します。たとえば、5% レベルは、ラインより下では ATR 読み取り値の 5% のみが低くなることを示し、99% は、そのレベルを超える ATR 値のうち、値の 1% のみが高くなることを示します。 80% を超えると、新しい取引のポジション サイズを下げ始めることを選択できます。また、95% を超えると、モメンタムが変化する前に利益を得るのに適した時期になる可能性があります。 分割中央値 Sp
    範囲の枯渇は、価格が現在の期間の予想される範囲を満たすか超えると発生します。これらのレベルでは、価格は期間の初期に比べて勢いを失い始めるため、新しいポジションをとっていないことを確認するのに良いポイントです. このインジケーターは、チャート上でこれが発生する可能性が高い場所を示し、日次、週次、月次の期間のレベルを示します。 価格がこれらの枯渇レベルを超えている場合は、動きの背後にある勢いが非常に強く、より高い時間枠レベルに向かっている可能性が高いことを示しています. インジケーターは、好みに応じて、Average True Range (ATR) または Average Range (ADR) 計算を使用できます。デフォルトでは、外国為替チャートでよりうまく機能することがわかっているため、ATR を使用しますが、ADR は株式ベースのインデックスとシンボルで優位に立っています。 インジケーターには、以下で説明するいくつかの描画モードがあり、ニーズに合わせて調整できます。 設定 計算モード レベルの計算には、AverageTrueRange (ATR) または AverageDaily
    フィルタ:
    renetrader07
    135
    renetrader07 2023.11.23 18:24 
     

    This greatly helps with being more mechanical with my trading

    Robert Gerald Wood
    4673
    開発者からの返信 Robert Gerald Wood 2023.11.23 18:26
    Many thanks for the review. This is the indicator I use the most now, it takes a little getting used to, but worth it!
    レビューに返信
    バージョン 2.10 2021.06.18
    Fix for issue where lines were not drawing for charts with not enough history data on the current timeframe.
    Fix for issue where number of potential targets displayed was being restricted unintentionally.
    Minor performance improvements.
    バージョン 2.0 2021.06.16
    NEW - Version 2 of the Indicator.
    Almost a complete rewrite, now includes the drawing of potential Take Profit and Stop loss levels and showing the associated Risk/Reward value for each. Pivot Machine Gun (PMG) scenarios are also identified and shown on each level with that potential.

    - Levels from Hourly, Four Hourly, Daily, Weekly and Monthly timeframes
    - Potential Take Profit levels
    - Potential Stop Loss levels based on the current or higher timeframe
    - Risk / Reward calculated continuously for each potential target level based on potential stop level
    - Pivot Machine Gun identification
    - Labelling for each level so you can identify what there
    - Comprehensive options to make it look as you wish