• Aperçu
  • Avis (3)
  • Commentaires (11)
  • Nouveautés

Trading box Rectangle extender MT5

5

Place price Alerts on extended Rectangles and Trendlines - Risk reward indicator mt5

Extend Rectangles & Trendlines to the right edge

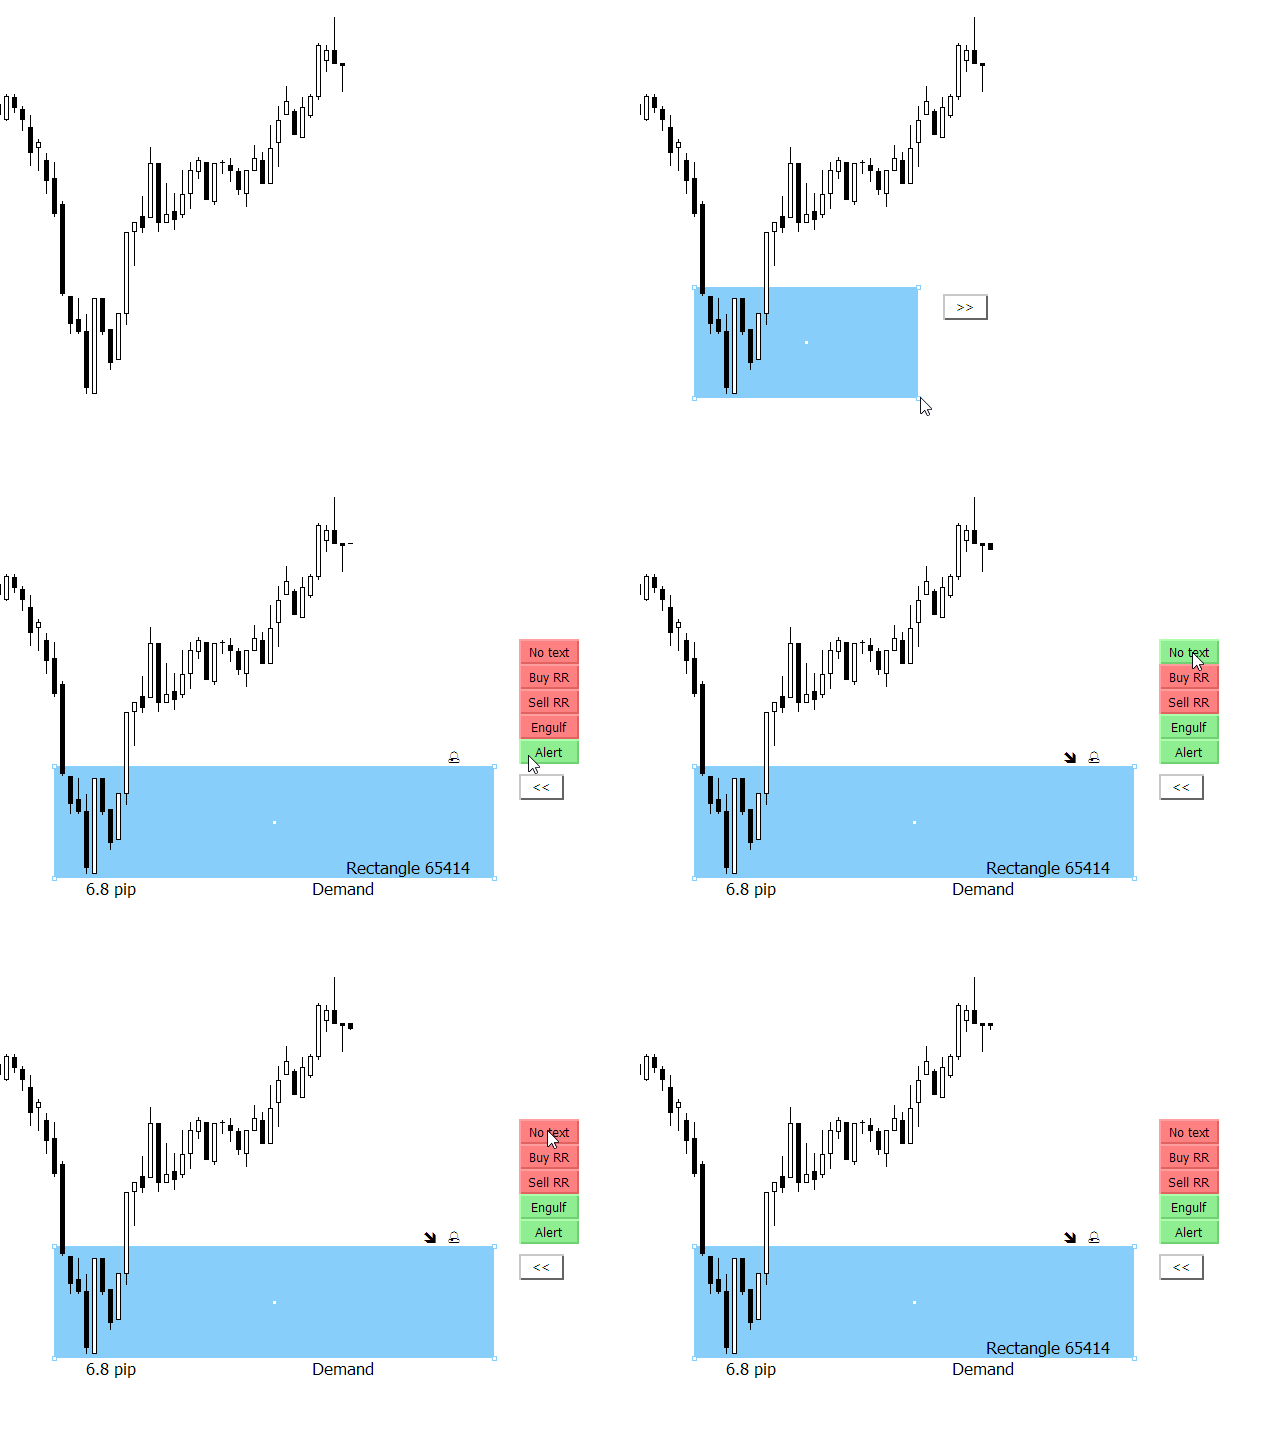
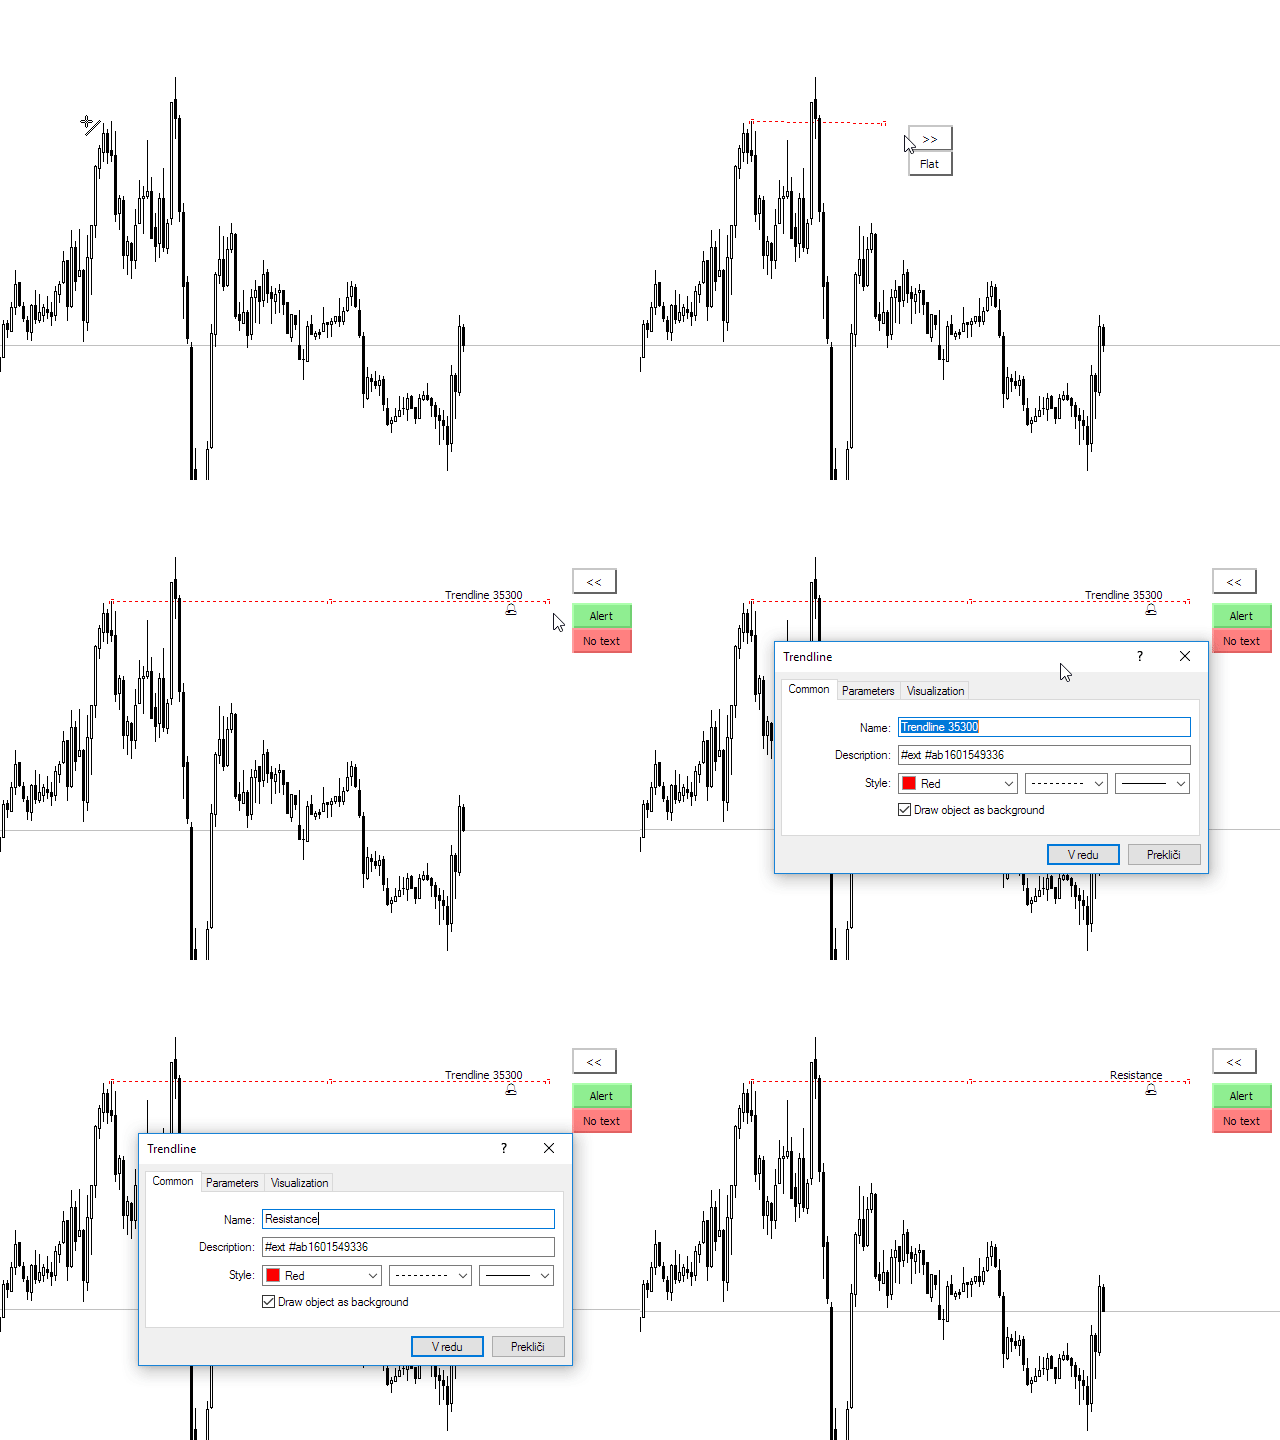
Mark your supply demand zones with extended rectangle and draw support resistance lines with extended trendline.

Find detailed manuals hereFind contacts on my profile.

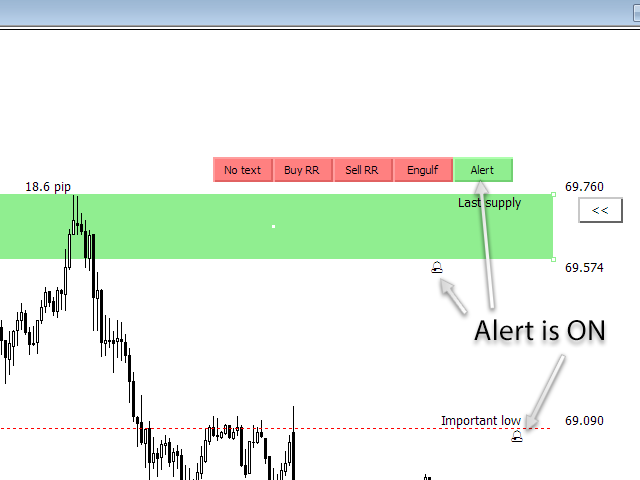
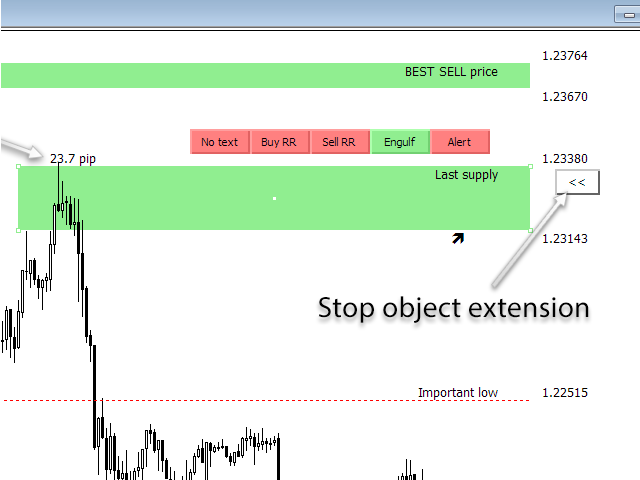
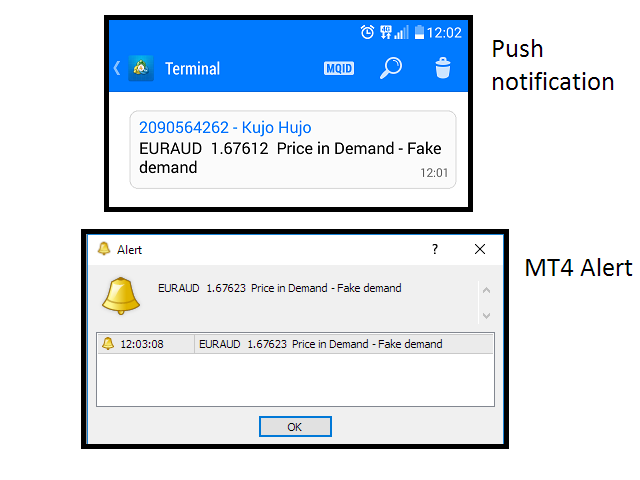
MT4 Rectangle extender indicator will simplify and make it easier for you to analyze markets and stay notified about important events. When you extend rectangle or trendline the action buttons will be shown (Alert, Engulf, Risk Reward). You will receive alert and mobile push notification when price touch or break (engulf) rectangle or trendline.


Smart Rectangle Extender or Zone Extender

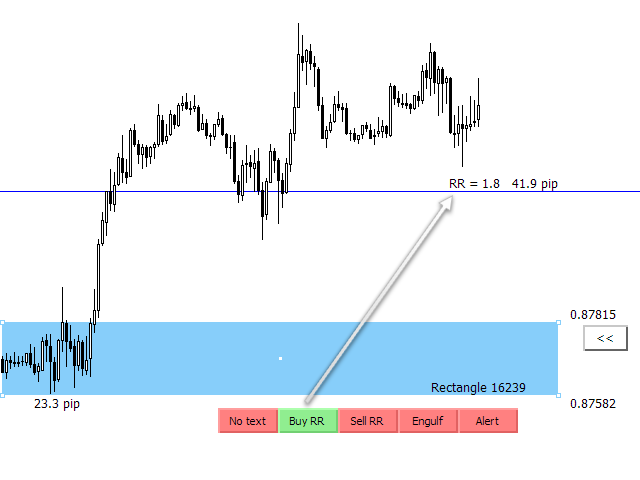
Rectangles and Trendlines will be extended into future with one click. Rectangle pip size, name and prices will be displayed around rectangle


Price Alert and Engulf Alert

Price Alert and Engulf detection in Rectangle extender are supported with MT4 mobile push notifications and email alert. Phone alert or smartphone alert for price level alert  Trendline alert and line alert. rectangle reader indicator


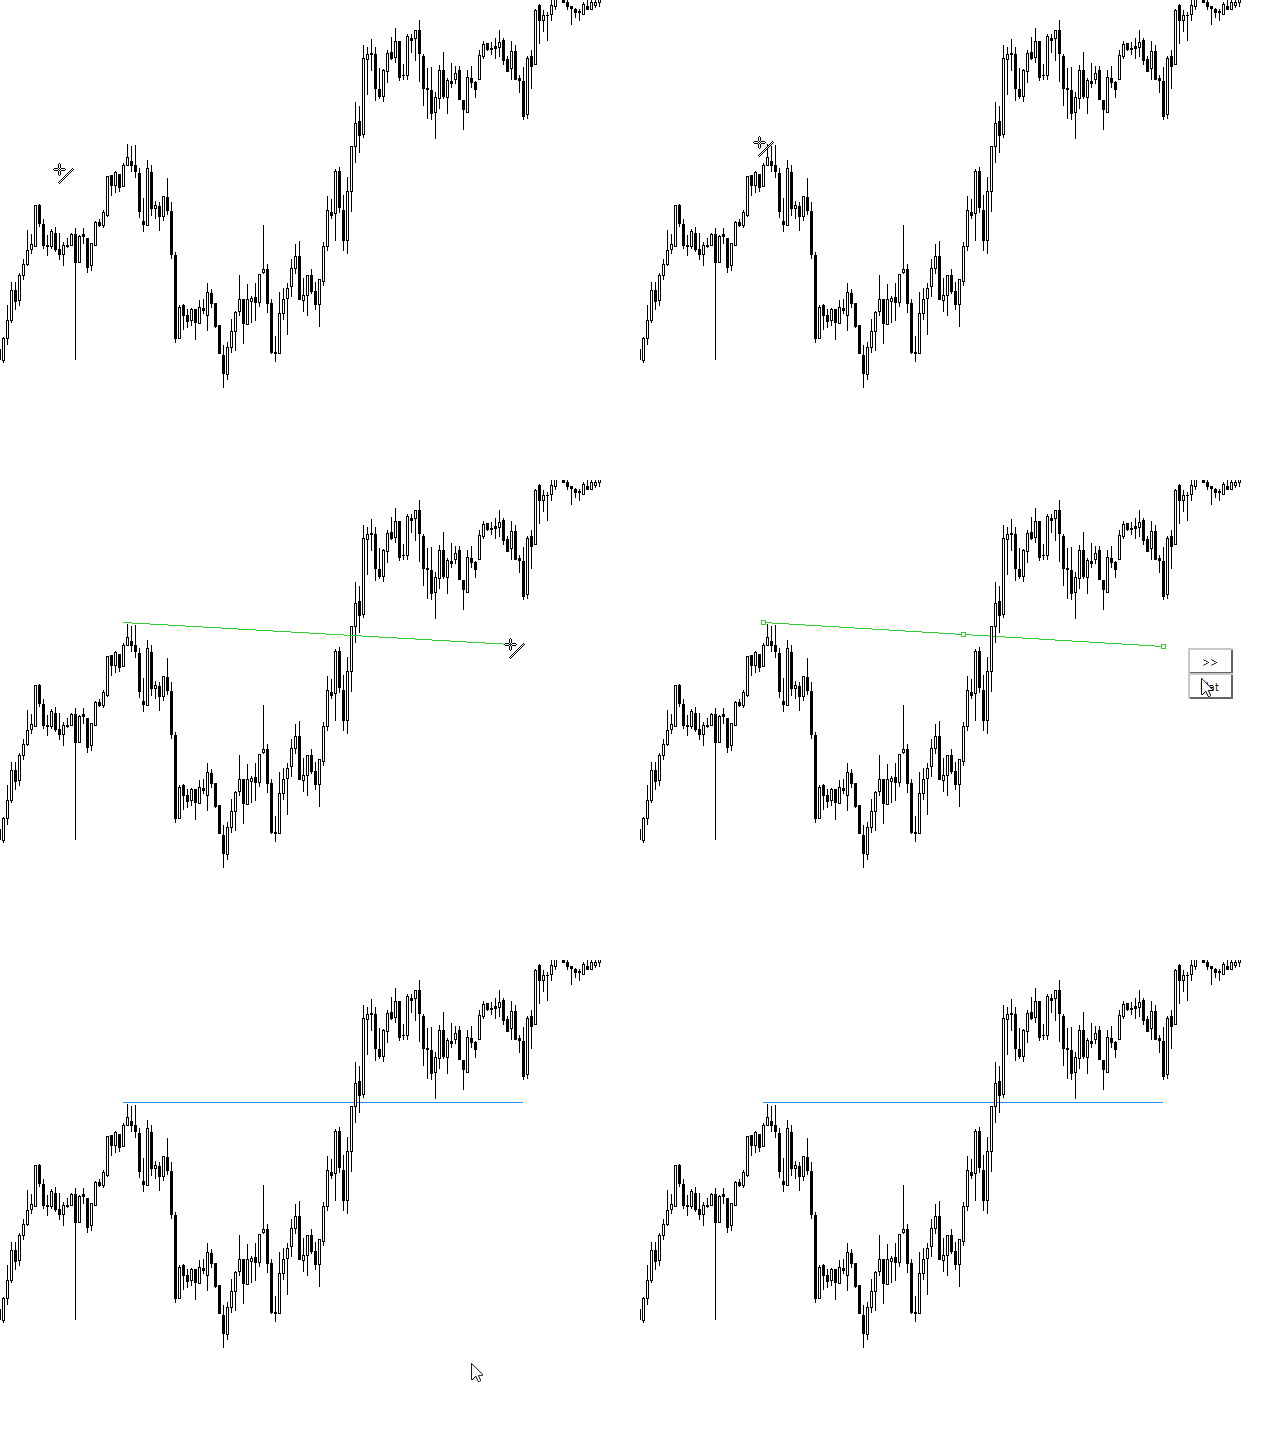
Flat trendline

Button that will change trendline to horizontal flat trendline


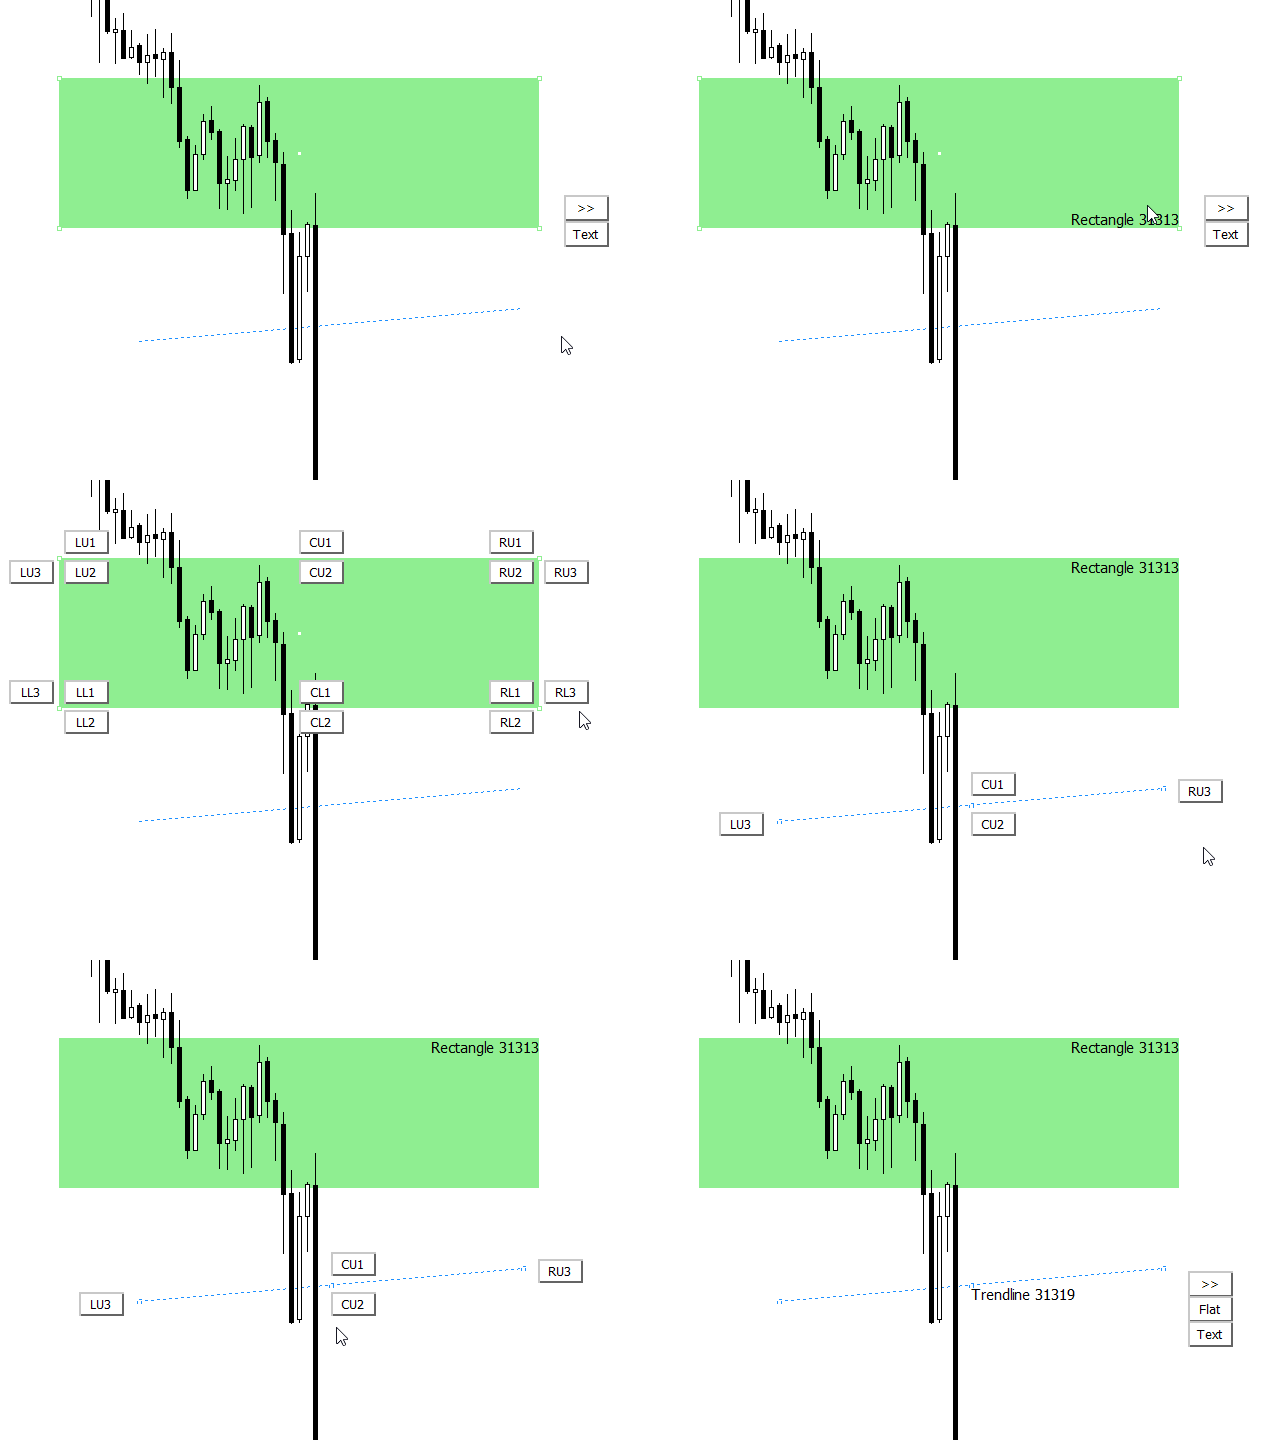
Show object name

Text button that gives options to display rectangle or trendline text in all possible spots around or inside object. This works for non-extended rectangles and trendlines where we would like to have object name displayed in suitable place around or inside object. (rectangle indicator, rectangle zone)


Risk reward ratio calculation

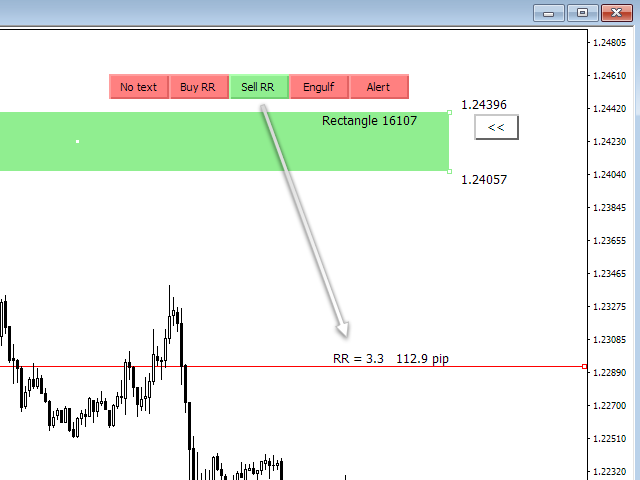
You can enable Risk Reward (RR) calculation with click on button Buy RR or Sell RR. Horizontal line will be displayed, and it will show Risk Reward ratio and pip distance between extended rectangle and horizontal RR line. You can select and move horizontal RR line to get your risk reward calculation information


Pip distance in brackets

It calculates pip difference between Bid and object price and display it at the right side of extended object


Timeframe colors for extended rectangle and trendline (multi timeframe analysis support)

User can define different colors for timeframe groups (separately for rectangles or trendlines):

Color 1: M1, M5, M15

Color 2: M30, H1, H4

Color 3: D1, W1, MN


Indicator customization

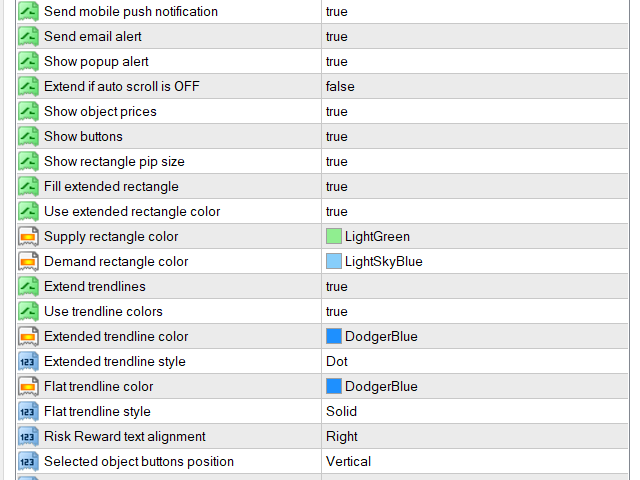
Trader can customize MT4 rectangle extender indicator with input properties. You can change colors, font size, element display position and some other features


Input property Description
Bring Alerted chart to the top True or false
Show pip distance in brackets True or false
Show object prices Show or hide prices on the right side of rectangle or trendline
Show buttons Show or hide buttons on the right side of selected rectangle or trendline
Show rectangle pip size Show or hide rectangle pip size
Fill extended rectangle When you extend rectangle, it will be filled with background color if variable is set to true
Supply rectangle color Default color for rectangles that are extended above bid price
Demand rectangle color Default color for rectangles that are extended below bid price
Extended trendline color We can set default color of extended trendline
Extended trendline style We can set default line style of extended trendline
Risk Reward text alignment We can display Risk Reward ratio calculation on left or right side of chart
Selected object buttons position Vertical or Horizontal
Rectangle pip size position Left, Right, Top or Bottom


Avis 3
Dura Radisic
440
Dura Radisic 2023.06.10 09:33 
 

Masterpiece, very useful !

I use this tool for ICT mark ups, FVG's, NWOG and liquidity areas on higher TF's to see where I'm at on the lower TF.

Straight trendlines every time on MT what a relief!

Exactly what was needed without having to go with tradingview.

Ngeci1615
74
Ngeci1615 2023.03.02 00:50 
 

An amazing indicator l have been using it for the last few months and it really helps me a lot, only that sometimes l miss notifications when l am doing other things because the notification sound only goes once perhaps you can consider the notification sound to go on longer or have an option to choose the length of the notification like the notification can go on for 5 secs or 10 secs or 30sec or even 1 minute, so one can choose what they prefare. otherwise overall very useful indicator

ozcoz
280
ozcoz 2021.03.02 00:44 
 

Excellent indicator. I don't like horizontal lines in MT5 because you can't see the start point, flat trendlines are nearly impossible to draw, so this indicator solves that with a simple click. The zone extender ensures that I have a tidy chart with zones extended a little beyond current price, a huge time saver for me. I made a comment for improvement and the change was implemented immediately, thanks for your work.

Produits recommandés
Graphic Shapes -using history, it projects four types of graphical shapes at the moment, allowing you to determine the main ranges of price movement in the future, as well as gives an understanding of the main market reversals, while giving entry points by priority!The panel contains three types of figure sizes expressed by timeframes. They allow you to conduct a complete market analysis without using additional tools! The indicator is a powerful tool for forecasting price movements in the forex
Adaptive Volatility Range [AVR] -  is a powerful tool for identifying key trend reversals. AVR -   accurately displays the Average True Volatility Range taking into account the Volume Weighted Average price. The indicator allows you to adapt to absolutely any market volatility by calculating the average volatility over a certain period of time - this provides a stable indicator of positive transactions. Thanks to this , Adaptive Volatility Range   has a high   Winrate of 95% There are two ways t
Xtrade Trend Detector
Dago Elkana Samuel Dadie
Xtrade Trend Detector est un indicateur capable de trouver les meilleures opportunités pour prendre position sur n'importe quel marché boursier. En effet, il est taillé pour les scalpers mais aussi pour les Daytraders. Vous pourriez donc vous en servir pour repérer les zones à trader, il s’intègre facilement sur graphique. Je l'utilise pour detecter les tendances sur les grandes unités de temps et prendre positions sur les petites unités de temps. N’hésitez pas à me contacter si vous avez des qu
The  Market Sessions Indicator for MT5 helps you  predict market turnarounds  by detecting major supply and demand areas. These pivot points tend to occur after a new session has started and the previous one is still open. It is also used to gauge how many points or pips the market moves on average during a session. This helps us to place better our take profits and stop losses. The indicator works on all forex pairs, gold, silver, commodities, stocks, indices and any other instrument that your
-25% discount ($149 -> $111) Everything for chart Technical Analysis indicator mt5 in one tool Draw your supply demand zone with rectangle and support resistance with trendline and get alerts to mobile phone or email alert -  Risk reward indicator mt5 Video tutorials, manuals, DEMO download   here .   Find contacts on my   profile . 1.   Extended rectangles and trendlines Object will be extended to the right edge of the chart when price will draw new candles on chart. This is rectangle extend
Product Description: Adaptive Y-Axis Scaling is a powerful MT5 indicator designed to enhance your trading experience by providing precise control over the Y-axis (price) scaling of your charts. This innovative tool allows you to customize the price scaling by specifying the number of pips from the visible chart's highs and lows. The calculated price range from this input is then used to set the maximum and minimum prices for the open chart, ensuring an optimized and comprehensive view of market
FREE
Considering the main theories of Forex (Dow Theory, support lines, chart patterns, and Fibonacci retracements), It tells you the price range where whales (large investors) are likely to appear. You can trade at the price points that professionals also aim for. You no longer have to warry about where to aim next. We are live-streaming the actual operation of the system. Please check for yourself if it is usable. Please check it out for yourself. https://www.youtube.com/@ganesha_forex We do n
MasterCharts
Alexander Berger
You can think of these indicators as moving pivot points. MasterChartsTrading Price Action Indicators show good price levels to enter or exit a trade. The Blue indicator line serves as a Bullish Trend setter. If your instrument closes above the Blue line, we think about going Long (buying). When your trading instrument closes below the Red line, we think about Shorting (selling). It is very easy to read price action if you have a reference point. These support/resistance lines are there to help
Rejection Block
Usiola Oluwadamilol Olagundoye
The "Rejection Block" MetaTrader 5 Indicator offers traders a comprehensive tool for identifying and visualizing rejection candlestick patterns, commonly known as rejection blocks. These patterns are pivotal in discerning potential market reversals or continuations, making them invaluable for traders seeking to enhance their analysis. Key Features: Rejection Block Detection: The indicator diligently scans price data, pinpointing instances of rejection candlestick patterns. These patterns typical
FREE
Get Trend
Vitalii Zakharuk
The Get Trend indicator was created to neutralize temporary pauses and rollbacks. It analyzes the behavior of the price and, if there is a temporary weakness of the trend, you can notice this from the indicator, as in the case of a pronounced change in the direction of the trend. Currency pairs never rise or fall in a straight line. Their rises and falls are interspersed with pullbacks and turns. Every growth and every fall is reflected in your emotional state: hope is replaced by fear, and w
CET INDICATEUR, BASÉ SUR L'INTELLIGENCE ARTIFICIELLE, identifie les points de retournement possibles du marché en lisant l'empreinte, et signale À L'AVANCE les petits mouvements du marché avant qu'ils ne se produisent. Contrairement aux indicateurs de prix et de volume, qui génèrent des entrées « tardives », c'est-à-dire lorsqu'une confirmation de prix ou de volume a déjà eu lieu sur un changement de direction, et donc souvent le mouvement est déjà terminé, cet indicateur signale, en fonction d
Gann Box MT5
Frederic Jacques Collomb
L'indicateur Gann Box est un outil puissant et polyvalent conçu pour aider les traders à identifier et exploiter les niveaux clés du marché. Cet indicateur permet de dessiner un rectangle sur le graphique, qui est automatiquement divisé en plusieurs zones avec des niveaux stratégiques  0, 0.25, 0.50, 075, 1 . Lorsque le prix touche un de ces niveaux, des alertes se déclenchent, offrant ainsi une aide précieuse pour les décisions de trading. Vous savez instantanément l'évolution du marché par ra
Extreme indicator
Ignacio Agustin Mene Franco
Extreme indicator! is an oscillator that works with candle volume levels, where it consists of red and green colors, where you measure the sale and purchase! where it also comes with a line crossing format where it reconfirms the purchase or sale on this occasion, works for forex markets and for the synthetic index markets ! It works for all seasons! Good profit! World Investor.
Outils de gain et de recherche. Le cœur des signaux de trading et de la stratégie est basé sur l'algorithme de l'auteur pour la formation des modèles de prévision des prix. Applicable à n'importe quel instrument ! Complété par un système de contrôle basé sur le MA "Nine-Tailed Fox" , mettant à jour et ajustant le signal aussi précisément que possible pour le marché, l'instrument et la période de travail. Éligible : Tous les instruments sur tous les marchés (il y a des exceptions). À qui s'adr
E2C Lines
Eduardo Cristian De Carvalho
Descubra o poder do nosso indicador de alta precisão, projetado para identificar as regiões de alvo e exaustão de qualquer ativo. Testado e validado por mais de 3 anos nos mercados de mini dólar e mini índice, ele oferece confiabilidade e eficácia incomparáveis. Transforme sua estratégia de trading e alcance novos patamares de sucesso com nossa ferramenta inovadora.
L'histogramme HiperCube ADX est là ! Ces indicateurs vous aident à savoir si une tendance forte pourrait se produire sur le marché. L'ADX est un indicateur très populaire et utile, c'est pourquoi de nombreux traders de haut niveau recommandent de l'utiliser comme filtre pour les mauvaises transactions ou en combinaison avec d'autres analyses. Avec HiperCube ADX, vous bénéficierez d'une expérience de premier ordre en utilisant un indicateur magnifique et excellent pour votre trading. FONCTIO
FREE
Rainbow EA MT5
Jamal El Alama
Description : Rainbow EA MT5 is a simple Expert advisor based on   Rainbow MT5 indicator witch is based on Moving average with period 34. The indicator is incorporated in the EA, therefore, it is not required for the EA to operate, but if you wish, you can download it from   my product page . The Expert Advisor settings are as follows : Suitable for Timeframes up to H1 The parameters below can be set according to your trading rules. StopLoss ( Stop Loss in pips) TakeProfit ( Take Profit in pi
with JR Trend you will able to enter and exit every trade with just a signals appear no need for any strategy just flow the indicator it work on all pairs and all Timeframe i usually take a look on higher timeframe and return to the lowest  timeframe and make an order with indicator signals you can see the amazing result so you can depend only on it intraday or swing as you wish 
PricePulse Pro - Indicator of Simple Solutions! Using this indicator is very easy - just follow the colored arrows on the chart. The indicator algorithm takes into account daily price fluctuations and focuses on measuring the "candlestick" share in the trend. This indicator uses an algorithm that considers price changes based on various parameters such as H/C (high price/close), H/O (high price/open), LC (low price/close), LO (low price/open). This allows for a more detailed analysis of price
Indicator Description This indicator displays the highest and lowest prices for the previous day, week, and month. Additionally, it shows pivot levels calculated using different methods: Standard, Fibonacci, Woodie, Camarilla, and Floor pivots. Features: Previous Day High/Low: Indicates the highest and lowest prices of the previous trading day. Previous Week High/Low: Indicates the highest and lowest prices of the previous trading week. Previous Month High/Low: Indicates the highest and lowest p
Glider
Vitalii Zakharuk
The Glider indicator gives accurate and timely signals to enter and exit the transaction that appear on the current candle. Using the indicator is very simple. When a dot and a blue line appear, open a buy deal. When a dot and a red line appear, open a sell deal. The main purpose of this indicator is to determine the moments of entry and exit from transactions, therefore the Glider indicator will display only the trend line and entry points, i.e. displays displays the entry points to the mark
This indicator, named Edyx_Candle_Size, is designed to be used with the MetaTrader 5 trading platform. It displays the size of the candlestick body for the current timeframe as a histogram. The indicator does not provide any specific trading signals or recommendations Measures the size of of the candlestick. That is the difference between the open and close as the case may be for either a bullish or a bearish candle. This can be use to filter out entry position as to maximise profit and minimi
This indicator calculates and displays Murrey Math Lines on the chart. This MT5 version is similar to the МТ4 version: It allows you to plot up to 4 octaves, inclusive, using data from different time frames, which enables you to assess the correlation between trends and investment horizons of different lengths. In contrast to the МТ4 version, this one automatically selects an algorithm to search for the base for range calculation. You can get the values of the levels by using the iCustom() funct
MT4 Version SMT Divergences MT5 SMT Divergences is one of the most innovative indicators in the market. It offers the possibility of analyzing price divergences between 2 pairs. These divergences highlight and help to foresee what banks and institutions are planning to do. SMT divergences also provides you with a kill zones indicator and the possibility of filtering divergences occurring during these kill zones.  This indicator is specially powerful if applied in 2 highly correlated pairs. A pr
Murray Math Xline
Martin Muriu Maina
Murrey Math Line X MetaTrader SYSTEM  — a pivot line system that will definitely help every trader who knows how to trade with support, resistance, and pivot lines. It displays 8 primary lines (with 5 more additional ones) on the main chart, helping you to find the best points to sell, buy, and exit your positions. You can download this indicator for MT4 and MT5 platform. Input parameters Period   (default = 64) — a period in bars or in other upper timeframe periods (set via the   UpperTimeFrame
A lot of professional traders use high quality divergence signals as a part of their strategy to enter a position. Spotting correct divergences quickly can often be hard, especially if your eye isn’t trained for it yet. For this reason we’ve created a series of easy to use professional oscillator divergence indicators that are very customisable so you get only the signals you want to trade. We have this divergence indicator for RSI, MACD, Stochastics, CCI and OBV. RSI:   https://www.mql5.com/en/
Advanced 4xZeovo MT5 Indicator (MetaTrader 5)   Product Description  4xZeovo is a powerful trading indicator system monitoring 24/7 financial markets. Metatrader5 tool designed to find the best buying/selling opportunities and notifies the user.    Making life easy for traders in helping with the two most difficult decisions with the use of advanced innovate trading indicators aiming to encourage users to hold the winning positions and take profit at the best times.    Equipped with a unique tra
FIBO Trend PRO mt5
Evgenii Aksenov
5 (2)
The indicator allows you to instantly determine the current trend by color and FIBO levels. Higher Timeframe the panel shows the current trend of higher periods, helping to determine the strength of the trend. Trade according to the trend when changing the color of candles or trade against the trend when the price hit the extreme levels of the FIBO Trend PRO  indicator   Advantages of the FIBO Trend PRO Indicator never repaint and does not change their values Very easy to use and intuitive App
Fibonacci Multiple 12
Cesar Juan Flores Navarro
Fibonacci Múltiple 12, utiliza la serie fibonacci plasmado en el indicador fibonacci, aumentadolo 12 veces según su secuencia. El indicador fibonacci normalmente muestra una vez, el presente indicador se mostrara 12 veces empezando el numero que le indique siguiendo la secuencia. Se puede utilizar para ver la tendencia en periodos cortos y largos, de minutos a meses, solo aumentado el numero MULTIPLICA.
If you wish to draw Support and Resistance lines, view: daily market opening, classical pivot levels, Fibonacci pivot levels, trend lines, Fibonacci levels, the remaining time to candle closing, and current spread. If you seek to place your orders with the exact lot that meets your desired stop loss risk. If you wish to do all this and more with just one click, then this is the perfect tool to use. This tool will allow you to feel more relaxed when deciding to open orders, as well as predicting
Les acheteurs de ce produit ont également acheté
TPSproTREND PrO MT5
Roman Podpora
4.9 (10)
TPSpro TREND PRO  - is a trend indicator that automatically analyzes the market and provides information about the trend and each of its changes, as well as giving signals for entering trades without redrawing! The indicator uses each candle, analyzing them separately. referring to different impulses - up or down impulse. Exact entry points into transactions for currencies, crypto, metals, stocks, indices!  Version MT4               DETAILED DESCRIPTION               R ecommended to use with an
TPSpro RFI Levels MT5
Roman Podpora
4.75 (12)
INSTRUCTIONS       RUS   -   ANGLAIS       Il   est recommandé de l'utiliser avec un indicateur       -       TPSpro   TENDANCE PRO -   Version MT4         Un élément clé du trading est constitué par les zones ou les niveaux à partir desquels les décisions d'achat ou de vente d'un instrument de trading sont prises. Malgré les tentatives des principaux acteurs de dissimuler leur présence sur le marché, ils laissent inévitablement des traces. Notre tâche était d'apprendre à identifier ces traces
FX Levels est un indicateur de support et de résistance exceptionnellement précis qui fusionne la méthode traditionnelle Lighthouse avec une approche dynamique innovante, fonctionnant parfaitement sur tous les symboles de trading. Cela inclut les paires de devises, les indices, les actions ou les matières premières. FX Levels identifie les points d'inversion et les affiche sur le graphique, qui peuvent être idéalement utilisés comme cibles de profit dans vos activités de trading. Pour développe
Quantum TrendPulse
Bogdan Ion Puscasu
5 (1)
Présentation de   Quantum TrendPulse   , l'outil de trading ultime qui combine la puissance de   SuperTrend   ,   RSI   et   Stochastic   dans un seul indicateur complet pour maximiser votre potentiel de trading. Conçu pour les traders qui recherchent précision et efficacité, cet indicateur vous aide à identifier les tendances du marché, les changements de dynamique et les points d'entrée et de sortie optimaux en toute confiance. Caractéristiques principales : Intégration SuperTrend :   suivez f
Atomic Analyst MT5
Issam Kassas
4.32 (19)
Tout d'abord, il convient de souligner que cet indicateur de trading n'est ni repainting, ni redrawing et ne présente aucun délai, ce qui le rend idéal à la fois pour le trading manuel et automatisé. Manuel de l'utilisateur : réglages, entrées et stratégie. L'Analyste Atomique est un indicateur d'action sur les prix PA qui utilise la force et le momentum du prix pour trouver un meilleur avantage sur le marché. Équipé de filtres avancés qui aident à éliminer les bruits et les faux signaux, et à
FX Power MT5 NG
Daniel Stein
5 (7)
Obtenez votre mise à jour quotidienne du marché avec des détails et des captures d'écran via notre Morning Briefing ici sur mql5 et sur Telegram ! FX Power MT5 NG est la nouvelle génération de notre très populaire indicateur de force des devises, FX Power. Et qu'est-ce que ce compteur de force de nouvelle génération offre ? Tout ce que vous avez aimé de l'original FX Power PLUS Analyse de la force de l'OR/XAU Des résultats de calcul encore plus précis Périodes d'analyse configurables individuel
Tout d'abord, il convient de souligner que ce système de trading est un indicateur non repeint, non redessiné et non retardé, ce qui le rend idéal pour le trading manuel et automatisé. Cours en ligne, manuel et téléchargement de préréglages. Le "Système de Trading Smart Trend MT5" est une solution de trading complète conçue pour les traders débutants et expérimentés. Il combine plus de 10 indicateurs premium et propose plus de 7 stratégies de trading robustes, ce qui en fait un choix polyvalent
Matrix Arrow Indicator MT5
Juvenille Emperor Limited
5 (13)
Matrix Arrow Indicator MT5   est une tendance unique 10 en 1 suivant un indicateur multi-période   100% non repeint   qui peut être utilisé sur tous les symboles/instruments:   forex ,   matières premières ,   crypto-monnaies ,   indices ,  actions .  Matrix Arrow Indicator MT5  déterminera la tendance actuelle à ses débuts, en rassemblant des informations et des données à partir d'un maximum de 10 indicateurs standard, qui sont: Indice de mouvement directionnel moyen (ADX) Indice de canal de m
PZ Swing Trading MT5
PZ TRADING SLU
5 (4)
Protect against whipsaws: revolutionize your swing trading approach Special Offer: Purchase now to receive free bonuses worth $135! (Read more for details) Swing Trading is the first indicator designed to detect swings in the direction of the trend and possible reversal swings. It uses the baseline swing trading approach, widely described in trading literature. The indicator studies several price and time vectors to track the aggregate trend direction and detects situations in which the market i
Présentation       Quantum Breakout PRO   , l'indicateur révolutionnaire MQL5 qui transforme la façon dont vous négociez les zones d'évasion ! Développé par une équipe de traders expérimentés avec une expérience commerciale de plus de 13 ans,       Évasion quantique PRO       est conçu pour propulser votre parcours commercial vers de nouveaux sommets grâce à sa stratégie de zone de discussion innovante et dynamique. Quantum Breakout Indicator vous donnera des flèches de signalisation sur le
FX Volume MT5
Daniel Stein
4.93 (14)
Obtenez votre mise à jour quotidienne du marché avec des détails et des captures d'écran via notre Morning Briefing ici sur mql5 et sur Telegram ! FX Volume est le PREMIER et SEUL indicateur de volume qui fournit un VRAI aperçu du sentiment du marché du point de vue d'un courtier. Il fournit des informations impressionnantes sur la façon dont les acteurs institutionnels du marché, comme les courtiers, sont positionnés sur le marché des changes, bien plus rapidement que les rapports COT. Voir c
Top indicator for MT5   providing accurate signals to enter a trade without repainting! It can be applied to any financial assets:   forex, cryptocurrencies, metals, stocks, indices .  Watch  the video  (6:22) with an example of processing only one signal that paid off the indicator! MT4 version is here It will provide pretty accurate trading signals and tell you when it's best to open a trade and close it. Most traders improve their trading results during the first trading week with the help of
Maintenant 147 $ (augmentant à 499 $ après quelques mises à jour) - Comptes illimités (PCS ou Mac) Manuel d'utilisation RelicusRoad + Vidéos de formation + Accès au groupe Discord privé + Statut VIP UNE NOUVELLE FAÇON DE REGARDER LE MARCHÉ RelicusRoad est l'indicateur de trading le plus puissant au monde pour le forex, les contrats à terme, les crypto-monnaies, les actions et les indices, offrant aux traders toutes les informations et tous les outils dont ils ont besoin pour rester renta
Blahtech Supply Demand MT5
Blahtech Limited
4.54 (13)
Was: $299  Now: $99   Supply Demand uses previous price action to identify potential imbalances between buyers and sellers. The key is to identify the better odds zones, not just the untouched ones. Blahtech Supply Demand indicator delivers functionality previously unavailable on any trading platform. This 4-in-1 indicator not only highlights the higher probability zones using a multi-criteria strength engine, but also combines it with multi-timeframe trend analysis, previously confirmed swings
La meilleure solution pour tout débutant ou trader expert ! Cet indicateur est un outil de trading unique, de haute qualité et abordable car nous avons incorporé un certain nombre de caractéristiques exclusives et une nouvelle formule. Avec seulement UN graphique, vous pouvez lire la force de la devise pour 28 paires Forex ! Imaginez comment votre trading va s'améliorer parce que vous êtes capable de repérer le point de déclenchement exact d'une nouvelle tendance ou d'une opportunité de scalp
Quantum Trend Sniper
Bogdan Ion Puscasu
4.71 (49)
Présentation       Quantum Trend Sniper Indicator   , l'indicateur révolutionnaire MQL5 qui transforme la façon dont vous identifiez et négociez les inversions de tendance ! Développé par une équipe de traders expérimentés avec une expérience commerciale de plus de 13 ans,       Indicateur Quantum Trend Sniper       est conçu pour propulser votre parcours de trading vers de nouveaux sommets grâce à sa manière innovante d'identifier les inversions de tendance avec une précision extrêmement élevée
Gold TMAF MTF - il s'agit d'un meilleur indicateur technique boursier. L'algorithme de l'indicateur analyse le mouvement du prix d'un actif et reflète la volatilité et les zones d'entrée potentielles. Les meilleurs signaux de l'indicateur: - Pour VENDRE = limite supérieure rouge de la TMA2 au-dessus de la limite supérieure rouge de la TMA1 + indicateur fractal rouge au-dessus + flèche jaune du signal SR dans la même direction. - Pour l'ACHAT = limite inférieure bleue de la TMA2 en desso
TPA True Price Action indicator reveals the true price action of the market makers through 100% non-repainting signals strictly at the close of a candle! TPA shows entries and re-entries, every time the bulls are definitely stronger than the bears and vice versa. Not to confuse with red/green candles. The shift of power gets confirmed at the earliest stage and is ONE exit strategy of several. There are available now two free parts of the TPA User Guide for our customers. The first "The Basics"
Identify over 30 candlestick patterns with precision Special Offer: Purchase now to receive free bonuses worth $60! (Read more for details) This indicator recognizes over 30 Japanese Candlestick Patterns and highlights them beautifully on the chart. It is simply one of those indicators price action traders can't live without.  [ Installation Guide | Update Guide | Troubleshooting | FAQ | All Products ] Boost your technical analysis overnight Detect japanese candlestick patterns easily Trade
"The Squeeze indicator attempts to identify periods of consolidation in a market. In general the market is either in a period of quiet consolidation or vertical price discovery. By identifying these calm periods, we have a better opportunity of getting into trades with the potential for larger moves. Once a market enters into a "squeeze," we watch the overall market momentum to help forecast the market direction and await a release of market energy." The Modified TTM Squeeze Indicator is a modi
Was: $249  Now: $99   Market Profile defines a number of day types that can help the trader to determine market behaviour. A key feature is the Value Area, representing the range of price action where 70% of trading took place. Understanding the Value Area can give traders valuable insight into market direction and establish the higher odds trade. It is an excellent addition to any system you may be using. Inspired by Jim Dalton’s book “Mind Over Markets”, this indicator is designed to suit the
L'indicateur de Carré Gann est un puissant outil d'analyse du marché basé sur l'article "Formule Mathématique pour les Prédictions de Marché" écrit par W.D. Gann. Cet outil utilise des concepts mathématiques et des théories de Gann pour réaliser une analyse précise du marché. Il utilise les carrés de 144, 90, 52 et aussi le carré de 9. De plus, il intègre la méthode du  pour le carré de 9 et sa relation avec les canaux et le modèle en étoile de ce carré. Manuel d'Utilisateur et Application : Ava
Gartley Hunter Multi
Siarhei Vashchylka
5 (8)
Gartley Hunter Multi - An indicator for searching for harmonic patterns simultaneously on dozens of trading instruments and on all possible timeframes. Manual (Be sure to read before purchasing) | Version for MT4 Advantages 1. Patterns: Gartley, Butterfly, Shark, Crab. Bat, Alternate Bat, Deep Crab, Cypher 2. Simultaneous search for patterns on dozens of trading instruments and on all possible timeframes 3. Search for patterns of all possible sizes. From the smallest to the largest 4. A
Volume Profile MT5
Mihails Babuskins
5 (3)
Contact me after payment to send you the User-Manual PDF File. Volume Profile Indicator A functional and useful tool that can improve your trading plan. This indicator calculates volume in price levels(typical volume indicator shows only candle volumes). With the volume of price levels, you can identify important areas that have the potential to reverse. You can also see the volume of support and resistance levels and decide on them. Using volume profiles along with   Price Action   and  
Trend Forecaster
Alexey Minkov
5 (6)
The Trend Forecaster indicator utilizes a unique proprietary algorithm to determine entry points for a breakout trading strategy. The indicator identifies price clusters, analyzes price movement near levels, and provides a signal when the price breaks through a level. The Trend Forecaster indicator is suitable for all financial assets, including currencies (Forex), metals, stocks, indices, and cryptocurrencies. You can also adjust the indicator to work on any time frames, although it is recommen
Trade double tops and bottoms effectively The PZ Double Top/Bottom Indicator is a technical analysis tool that helps traders identify potential price reversal patterns in the market. These patterns, known as double tops and bottoms, are characterized by two consecutive peaks or valleys in the price of an asset. Double tops and bottoms are often seen as potential reversal patterns because they can signal a change in the direction of the current trend. [ Installation Guide | Update Guide | Troub
Increase trade accuracy with the time-tested cup and handle patterns The Cup and Handle pattern is a technical price formation that resembles a cup and handle, where the cup is in the shape of a "U" and the handle has a slight downward drift. The right-hand side of the pattern -the handle- is smaller than the left-hand side -cup-, and retraces no more than 50% from the top. It can be both a continuation and a reversal pattern.  [ Installation Guide | Update Guide | Troubleshooting | FAQ | All P
Currency Strength Meter is the easiest way to identify strong and weak currencies. This indicator shows the relative strength of 8 major currencies + Gold: AUD, CAD, CHF, EUR, GBP, JPY, NZD, USD, XAU. Gold symbol can be changed to other symbols like XAG, XAU etc. By default the strength value is normalised to the range from 0 to 100 for RSI algorithm: The value above 60 means strong currency; The value below 40 means weak currency; This indicator needs the history data of all 28 major currency
Introduction Harmonic Patterns are best used to predict potential turning point. Traditionally, Harmonic Pattern was identified manually connecting peaks and troughs points in the chart. Manual harmonic pattern detection is painfully tedious and not suitable for everyone. You are often exposed under subjective pattern identification with manual pattern detection. To avoid these limitations, Harmonic Pattern Plus was designed to automate your harmonic pattern detection process. The functionality
FxaccurateLS
Shiv Raj Kumawat
WHY IS OUR FXACCCURATE LS MT5 THE PROFITABLE ? PROTECT YOUR CAPITAL WITH RISK MANAGEMENT Gives entry, stop and target levels from time to time. It finds Trading opportunities by analyzing what the price is doing during established trends. POWERFUL INDICATOR FOR A RELIABLE STRATEGIES We have made these indicators with a lot of years of hard work. It is made at a very advanced level. Established trends provide dozens of trading opportunities, but most trend indicators completely ignore them!
Plus de l'auteur
-25% discount ($199 -> $149) Advanced trading tool: One click smart orders that execute under your conditions Developed by trader for trading community:  position size calculator (lot size), open position after price action, strategy builder, set and forget trading, mobile notifications... Risk Management -  Risk percentage position size calculator, gain percentage, target risk reward ratio, spread and commissions are included in calculations 7 Advanced order types  - Set and forget trading w
Summer 40% discount ($149 -> $88) Everything for chart Technical Analysis indicator mt4 in one tool Draw your supply demand zone with rectangle and support resistance with trendline and get alerts to mobile phone or email alert -  Risk reward indicator Video tutorials, manuals, DEMO download   here .  Find contacts on my   profile . 1.   Extended rectangles and trendlines Object will be extended to the right edge of the chart when price will draw new candles on chart. This is rectangle extend
-25% discount ($149 -> $111) Everything for chart Technical Analysis indicator mt5 in one tool Draw your supply demand zone with rectangle and support resistance with trendline and get alerts to mobile phone or email alert -  Risk reward indicator mt5 Video tutorials, manuals, DEMO download   here .   Find contacts on my   profile . 1.   Extended rectangles and trendlines Object will be extended to the right edge of the chart when price will draw new candles on chart. This is rectangle extend
2024 50% discount ($199 -> $99) Advanced trading tool: One click smart orders that execute under your conditions Developed by trader for trading community:  position size calculator (lot size), open position after price action, strategy builder, set and forget trading, mobile notifications... Risk Management -  Risk percentage position size calculator, gain percentage, target risk reward ratio, spread and commissions are included in calculations 7 Advanced order types   - Set and forget tradi
Place price Alerts on extended  Rectangles and Trendlines -  Risk reward indicator mt4 Extend Rectangles & Trendlines to the right edge Mark your supply demand zones with extended rectangle and draw support resistance lines with extended trendline. Find detailed manuals   here . Find contacts on my   profile . MT4 Rectangle extender indicator will simplify and make it easier for you to analyze markets and stay notified about important events. When you extend rectangle or trendline the action bu
Display rectangles and trendlines list  from Trading box  Technical analysis tool. Objects are ordered in the list by   pip distance   that is difference between object price and Bid price. With this tool you will know which chart to look for next trading opportunity. No more switching between charts and searching for trades where price is close to rectangle zone or trendline support resistance level. Sorted Rectangles and Trendlines by pip distance -  If you are trading on multiple charts, the
FREE
Rectangle position changer   tool is used for precise/accurate rectangle positioning by time or price only.   You can move each side of rectangle separately with lines created around selected rectangle. This tool will replace classical grid because it is like dynamical chart grid for rectangle grid. This tool allows you to adjust your rectangles, from all 4 sides, with ease and makes your technical analysis that much faster. This tool is handy when corner points for changing rectangle position a
FREE
Display Order box list from  Trading box  Order Management tool. Find contacts and manual links on my   profile . This dashboard gives you an edge in forex trading because in few seconds you can decide which pair and timeframe is worth to watch more closely. This is how you will not be distracted by all other forex pairs that you trade, and you will not miss great opportunities to trade the best price. Trading Dashboard  (order box overview panel and Trading box Order management extension) Tr
FREE
Display rectangles and trendlines list from  Trading box  Technical analysis tool. Objects are ordered in the list by pip distance that is difference between object price and Bid price. With this tool you will know which chart to look for next trading opportunity. No more switching between charts and searching for trades where price is close to rectangle zone or trendline support resistance level. Sorted Rectangles and Trendlines by pip distance -  If you are trading on multiple charts, then th
FREE
Rectangle position changer  tool ( rectangle indicator) is used for precise/accurate rectangle positioning by time or price only. You can move each side of rectangle separately with lines created around selected rectangle. This tool will replace classical grid because it is like dynamical chart grid for rectangle grid. This tool allows you to adjust your rectangles, from all 4 sides, with ease and makes your technical analysis that much faster. This tool is handy when corner points for changi
FREE
This tool will remove buttons and text labels from the chart, after you remove Trading box Order management or Trading box Technical analysis . You just need to drag this tool to your chart and after cleanup of objects is finished, the tool will remove itself from the chart. Please check images below that present Before and After using the Removal tool. There is also a short YouTube video at the bottom to show how easy it is to clean your chart after using Trading box tools. - input var
FREE
Display Order box list from  Trading box  Order Management tool. Find contacts and  manual   links on my   profile . This dashboard gives you an edge in forex trading because in few seconds you can decide which pair and timeframe is worth to watch more closely. This is how you will not be distracted by all other forex pairs that you trade, and you will not miss great opportunities to trade the best price. Trading Dashboard  (order box overview panel and Trading box Order management extension)
FREE
This tool will remove buttons and text labels from the chart, after you remove Trading box Order management or Trading box Technical analysis. You just need to drag this tool to your chart and after cleanup of objects is finished, the tool will remove itself from the chart. Please check images below that present Before and After using the Removal tool. There is also a short YouTube video at the bottom to show how easy it is to clean your chart after using Trading box tools. - input variable "
FREE
Filtrer:
Dura Radisic
440
Dura Radisic 2023.06.10 09:33 
 

Masterpiece, very useful !

I use this tool for ICT mark ups, FVG's, NWOG and liquidity areas on higher TF's to see where I'm at on the lower TF.

Straight trendlines every time on MT what a relief!

Exactly what was needed without having to go with tradingview.

Ngeci1615
74
Ngeci1615 2023.03.02 00:50 
 

An amazing indicator l have been using it for the last few months and it really helps me a lot, only that sometimes l miss notifications when l am doing other things because the notification sound only goes once perhaps you can consider the notification sound to go on longer or have an option to choose the length of the notification like the notification can go on for 5 secs or 10 secs or 30sec or even 1 minute, so one can choose what they prefare. otherwise overall very useful indicator

ozcoz
280
ozcoz 2021.03.02 00:44 
 

Excellent indicator. I don't like horizontal lines in MT5 because you can't see the start point, flat trendlines are nearly impossible to draw, so this indicator solves that with a simple click. The zone extender ensures that I have a tidy chart with zones extended a little beyond current price, a huge time saver for me. I made a comment for improvement and the change was implemented immediately, thanks for your work.

Répondre à l'avis
Version 8.3 2024.09.30
- recompile with new Metatrader client
Version 8.2 2024.08.24
- bug fix
Version 8.1 2024.04.01
>> button position fixed for Horizontal line buttons display
Version 8.0 2024.03.22
- object name change bug fix
Version 7.9 2024.03.16
- reported bug fix
Version 7.8 2024.03.12
- bug fix: text objects deleted on object property change
Version 7.7 2024.02.17
- upgrade
Version 7.6 2024.01.13
- NEW input variables:
Resistance trendline color - Above Bid
Support trendline color - Below Bid

TBOM promotional video from trader Kevin Cortese: https://www.youtube.com/watch?v=gUR_juP7n5k
Version 7.5 2023.08.10
- performance upgrade
Watch our latest video about Fair Value Gap indicator: https://www.youtube.com/watch?v=pBRXTKNIMAk
Version 7.4 2023.02.08
- NEW input "Button text color"
Version 7.3 2022.12.26
- new input variable "Engulf alert un-fill rectangle"
Version 7.2 2022.11.20
- rectangle and trendline alert buttons visible within chart when scrolling left
Version 7.0 2022.11.06
- performance upgrade that will lower CPU usage on MetaTrader terminal
Version 6.9 2022.09.17
- new input variable "Extended object text position" with options (Right, Left)
Version 6.8 2022.08.12
- new version
Version 6.7 2022.08.01
- recompile with new Metatrader version
Version 6.6 2022.05.29
- bug fix for new MetaTrader 5 rectangles (4 corners anchor points)
Version 6.5 2022.05.09
- performance upgrade
Version 6.4 2022.05.04
- bug fix and recompile code for MT5 update

Please check our YouTube channel to learn trading tips and tricks: https://www.youtube.com/Tradingbox
Version 6.3 2022.04.09
- recompile for new MT5 build
Version 6.2 2021.12.23
- compliance upgrade for the NEW tool "Rectangle position changer"

Download: https://www.mql5.com/en/market/product/75866

VIDEO: https://www.youtube.com/watch?v=IYW1dgOWwRg
Version 6.1 2021.11.27
- CPU usage reduced that will allow more charts with TBTA in MetaTrader terminal
Version 6.0 2021.11.16
- bug fix for non extended rectangle Risk Reward tool
- CPU performance improvement when using TBRE on multiple charts
Version 5.9 2021.11.01
- risk reward tool for non-extended rectangles
- adding more texts positions (object names) to rectangle and trendline. With button "X" you remove current text
Version 5.7 2021.09.05
- button display bug fix when objects TF visibility is set only to D1, W1 or MN
Version 5.6 2021.08.28
- button speed and performance upgrade
Version 5.5 2021.08.01
- improved performance between Trading box tools (Order management, Technical analysis, Rectangle extender, Order box Dashboard)
Version 5.4 2021.08.01
- extended rectangle and trendline buttons display correction for high resolution displays
Version 5.3 2021.07.31
- bug fix for chart clean up after indicator is removed
Version 5.2 2021.07.25
- optimized refresh rate for pip distance display in brackets (price difference between Bid and object price)
Version 5.1 2021.07.22
- removed input variable "Set larger button text"
- NEW input variable "Button font size"
- NEW input variable "Button size scale"
Version 5.0 2021.07.20
- NEW input variable "Show pip distance in brackets"

NEW input variable "Use timeframe colors for extended rectangle"
- Rectangle color for M1, M5, M15
- Rectangle color for M30, H1, H4
- Rectangle color for D1, W1, MN

NEW input variable "Use timeframe colors for extended trendline"
- Trendline color for M1, M5, M15
- Trendline color for M30, H1, H4
- Trendline color for D1, W1, MN

- button click lagging solved
Version 4.9 2021.07.17
- bug fix when Trading box Order management and Rectangle extender are used on the same chart
Version 4.8 2021.07.06
- NEW input variable "Set larger button text" that will create a little bigger buttons and font size +2
Version 4.7 2021.06.20
- NEW input variable "Bring Alerted chart to the top"

- NEW input variable "Extend new created rectangle"
- NEW input variable "Extend new created trendline"
Version 4.6 2021.05.25
- bug fix for button display
Version 4.5 2021.05.01
- NEW "Text" button that gives options to display rectangle or trendline text in all possible spots around or inside object. This works for non-extended rectangles and trendlines where we would like to have object name displayed in suitable place around or inside object. This is custom show object name function.

- Safety check warning for too many objects on chart (performance issues) + warning for incompatible indicators
Version 4.4 2021.04.03
Added new input variables:
- Extended trendline width
- Flat trendline width
Version 4.3 2021.03.27
- minor bug fix
Version 4.2 2021.03.01
New input variables added and used when you extend rectangle or trendline:
- Alert enabled by default
- Engulf enabled by default
- No text enabled by default
Version 4.1 2021.02.17
- Alert and Engulf button color refresh after alert is triggered