Trading box Rectangle extender MT5
- Göstergeler
- Igor Zizek
- Sürüm: 8.3
- Güncellendi: 30 Eylül 2024
- Etkinleştirmeler: 5
Place price Alerts on extended Rectangles and Trendlines - Risk reward indicator mt5
Extend Rectangles & Trendlines to the right edge
Mark your supply demand zones with extended rectangle and draw support resistance lines with extended trendline.
Find detailed manuals here. Find contacts on my profile.
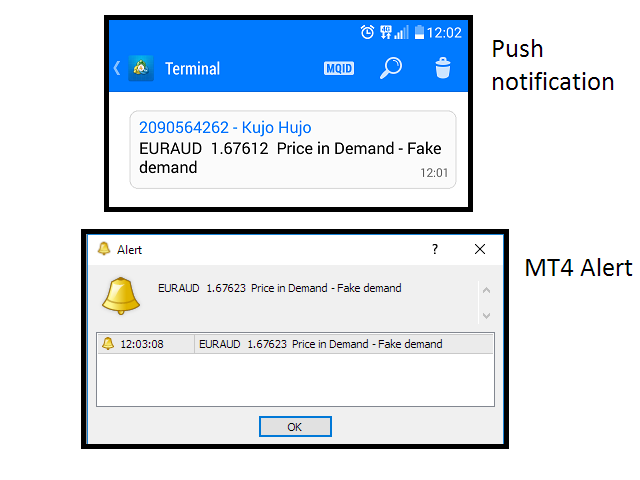
MT4 Rectangle extender indicator will simplify and make it easier for you to analyze markets and stay notified about important events. When you extend rectangle or trendline the action buttons will be shown (Alert, Engulf, Risk Reward). You will receive alert and mobile push notification when price touch or break (engulf) rectangle or trendline.
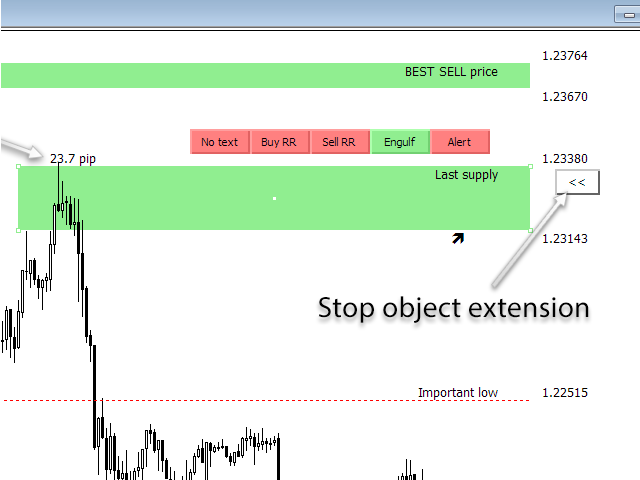
Smart Rectangle Extender or Zone Extender
Rectangles and Trendlines will be extended into future with one click. Rectangle pip size, name and prices will be displayed around rectangle
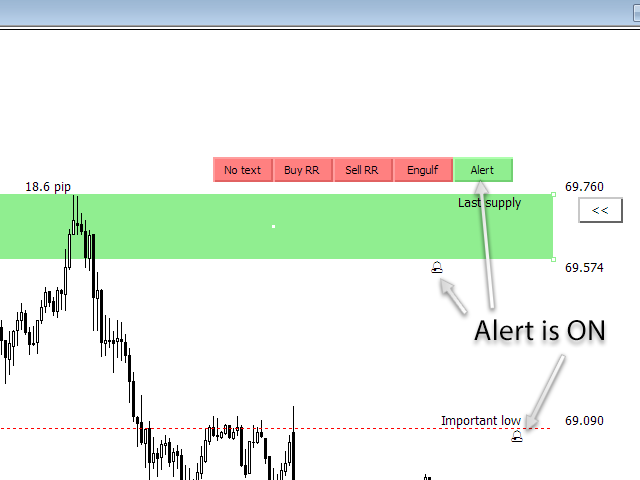
Price Alert and Engulf Alert
Price Alert and Engulf detection in Rectangle extender are supported with MT4 mobile push notifications and email alert. Phone alert or smartphone alert for price level alert Trendline alert and line alert. rectangle reader indicator
Flat trendline
Button that will change trendline to horizontal flat trendline
Show object name
Text button that gives options to display rectangle or trendline text in all possible spots around or inside object. This works for non-extended rectangles and trendlines where we would like to have object name displayed in suitable place around or inside object. (rectangle indicator, rectangle zone)
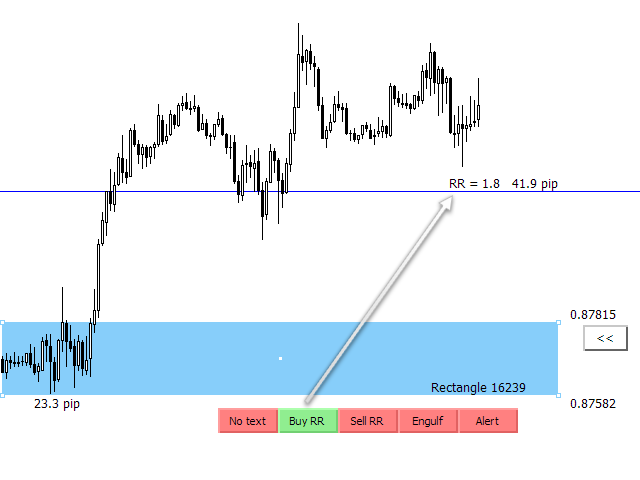
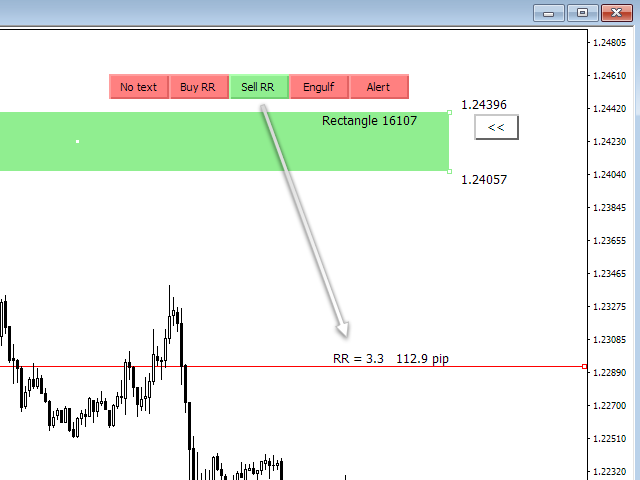
Risk reward ratio calculation
You can enable Risk Reward (RR) calculation with click on button Buy RR or Sell RR. Horizontal line will be displayed, and it will show Risk Reward ratio and pip distance between extended rectangle and horizontal RR line. You can select and move horizontal RR line to get your risk reward calculation information
Pip distance in brackets
It calculates pip difference between Bid and object price and display it at the right side of extended object
Timeframe colors for extended rectangle and trendline (multi timeframe analysis support)
User can define different colors for timeframe groups (separately for rectangles or trendlines):
Color 1: M1, M5, M15
Color 2: M30, H1, H4
Color 3: D1, W1, MN
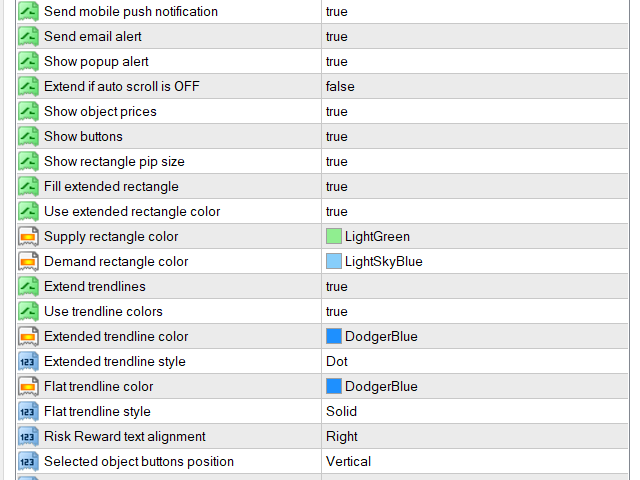
Indicator customization
Trader can customize MT4 rectangle extender indicator with input properties. You can change colors, font size, element display position and some other features
| Input property | Description |
|---|---|
| Bring Alerted chart to the top | True or false |
| Show pip distance in brackets | True or false |
| Show object prices | Show or hide prices on the right side of rectangle or trendline |
| Show buttons | Show or hide buttons on the right side of selected rectangle or trendline |
| Show rectangle pip size | Show or hide rectangle pip size |
| Fill extended rectangle | When you extend rectangle, it will be filled with background color if variable is set to true |
| Supply rectangle color | Default color for rectangles that are extended above bid price |
| Demand rectangle color | Default color for rectangles that are extended below bid price |
| Extended trendline color | We can set default color of extended trendline |
| Extended trendline style | We can set default line style of extended trendline |
| Risk Reward text alignment | We can display Risk Reward ratio calculation on left or right side of chart |
| Selected object buttons position | Vertical or Horizontal |
| Rectangle pip size position | Left, Right, Top or Bottom |


Useful indicator and great work, may you kindly add options for diagonal trend line, instead of flat options add angle eg. 45 degrees and notifications. Thank you. I will glad if you can add notification for diagonal Trendline. Thanks