VolumeProfile MT5
- Indicateurs
- Robert Hess
- Version: 1.43
- Mise à jour: 24 juillet 2023
- Activations: 5
Description:
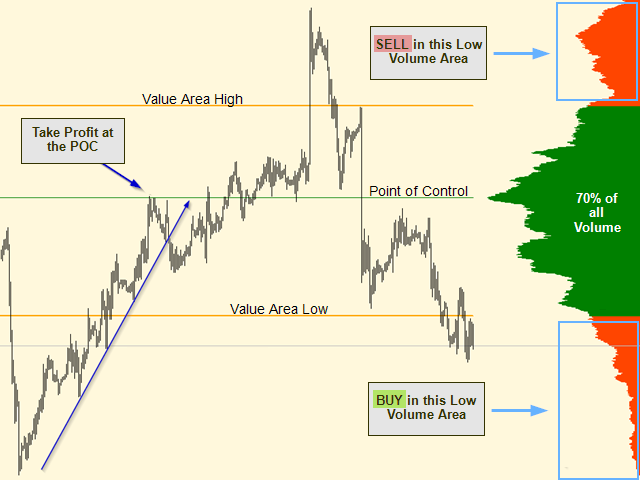
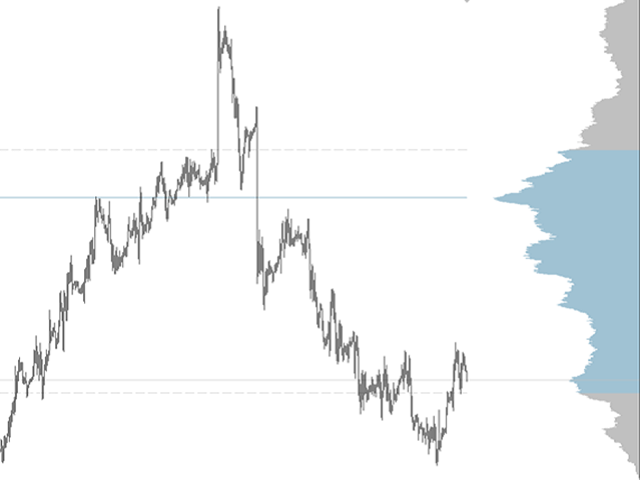
The Volume Profile displays detailed informations of historical trading activities at certain price levels (Market Profile).
Locate the areas with the best prices in the market and get an advantage over other market participants.
Features:
- Customizable Market Profile
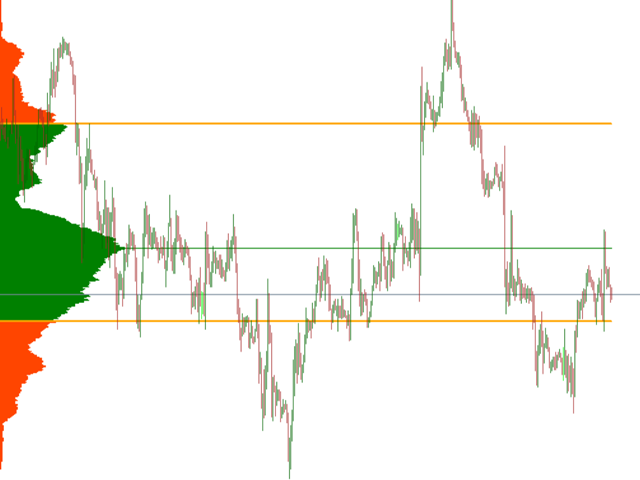
- Shows the "fair" Value Area with 70% of all Volume
- Shows critical low volume zones
- Shows VPOC, VAL and VAH Points
- integrated resource management to reduce the load while working with multiple charts
- Works on all timeframes
- Automatic calculation your defined timeset in all timeframes
- Drag & Drop for live calculation
- Also available for MT4
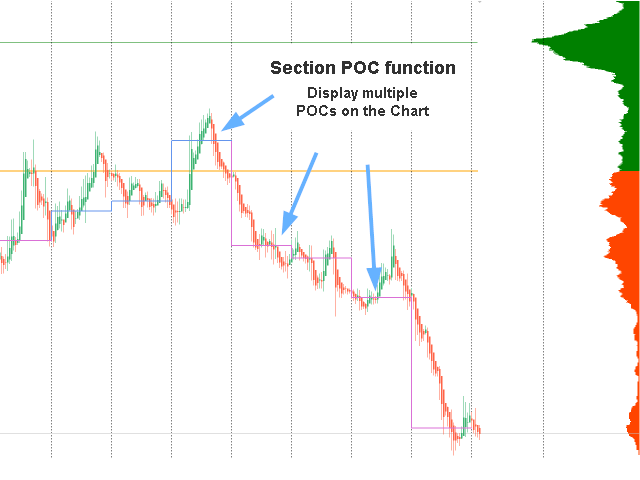
- Section POCs (Display multiple POCs and VAL/VAH lines in one Chart)
Settings:
| Variable | Standard Value | Description |
|---|---|---|
| Bar History | 1440 | Number of historical Bars to calculate from if "Auto calc history" is set to false |
| Level of Detail | 1 | Set the resolution for the profile. For protection purposes the level of detail will be automaticaly recalculated if you open a high volatile chart such as BTC. |
| Mirror to left side | false | Mirrors the whole VolumeProfile to the left side of the chart (Size can be adjusted with "Scale" input) |
| Horizontal Position (auto) | true | - Set this value to "true" to let the volume profile automaticaly align to your screen. - Set this value to "false" to ajust the X-Position with the variable "X-Position" |
| Horizontal Position (manual) | 0 | Set the X Position of the Indicator on the screen (recommended value is 30 to 60) |
| Scale | 10 | Adjust the percentage of the chart, to be coverd by the VolumeProfile |
| Enable History Start line | false | Enable the History Start line, with which you can choose the calculation start of the Profile - drag & Drop to calculate the VolumeProfile |
| Enable History End line | true | Enable the History End line, that shows until which candle the VolumeProfile will be calculated - drag & Drop to calculate the VolumeProfile |
| History line width | 3 | Set the History line width |
| History line color | SlateGray | Set the History line color |
| Enable Section POC | true | Enable/Disable the section POC |
| Steps of POC | 10 | Set the number of POCs |
| Tie to Period separator | true | ties the sPOC to Period separators |
| Width of POC | 2 | Width of sPOC |
| Color POC Up | Cornflower Blue | Set the color for a POC that is higher than the last POC |
| Color POC Down | Orchid | Set the color for a POC that is lower than the last POC |
| POC Style | solid | Set solid or dotted POC Lines |
| Bars in XX | XX | Set the Bars for every Period if not tied to Period separator |
| Refresh auto | true | Set this to "false" if you want the VolumeProfile to not refresh automaticaly |
| Refresh rate | 10 | Adjust the refresh timer (Refresh the VolumeProfile every X seconds). Setting this value too low, will lead to a much slower performance |
| Auto calc history | false | Set this to "true" to activate the automatic conversion of minutes when the timeframe has changed |
| History (in Minutes) | 1440 | Set the time in minutes, that is used for the calculation of the VolumeProfile |
| Value Area percentage | 70 | Set the percentage of the Value Area |
| Enable Volume Profile | true | Set this to "false" if you wish to hide the Volume Profile |
| Profile_Color | Green | Color of the area with 70% of all volume (fair value area) |
| Profile_Color_VLow | OrangeRed | Color of the areas with low volume |
| Profile_Background | true | Set the profile to background |
| POC_Style | 0 | Set the Style of the Point of Control |
| POC_Color | Green | Set the Color of the POC |
| POC_Width | 1 | Set the Width of the POC |
| POC_Background | true | Set the POC to background |
| VAL_Style | 0 | Set the Style of the Value Area Low Line |
| VAL_Color | Orange | Set the Color of the VAL |
| VAL_Width | 2 | Set the Width of the VAL |
| VAL_Background | true | Set the VAL to the Background |
| VAH_Style | 0 | Set the Style of the Volume Area High |
| VAH_Color | Orange | Set the Color of the VAH |
| VAH_Width | 2 | Set the Width of the VAH |
| VAH_Background | true | Set the VAH to the Background |
| Set custom History values (below) | false | Swtich between the general "Bar History" and the custom History values below |
| Bar History XX | XX | History in Bars if the Time Frame is XX |


I migrate to another account with the same broker but the indicator doesn't work... do I need to do some activation or something like that for the indicator to work again? thank you very much