• Overview
  • Reviews (9)
  • Comments (21)
  • What's new

VolumeProfile MT5

4.14

Description:

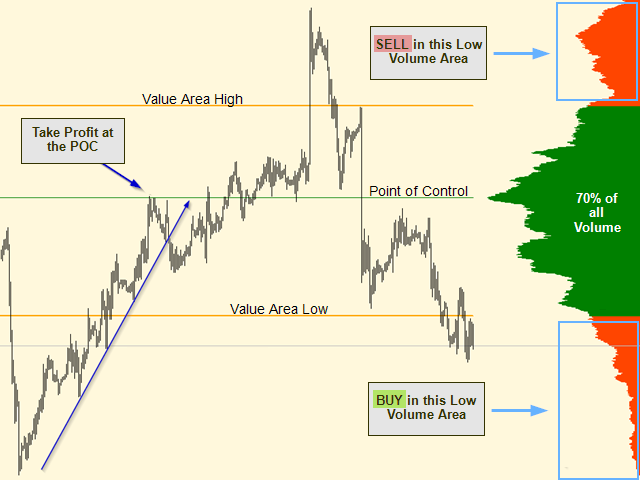
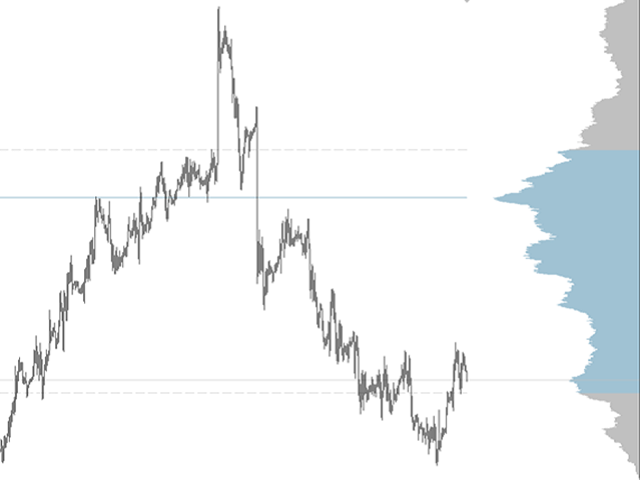
The Volume Profile displays detailed informations of historical trading activities at certain price levels (Market Profile).

Locate the areas with the best prices in the market and get an advantage over other market participants.


Features:

  • Customizable Market Profile
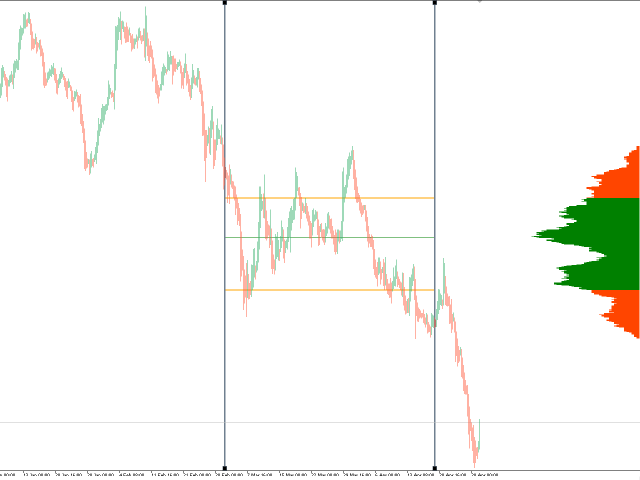
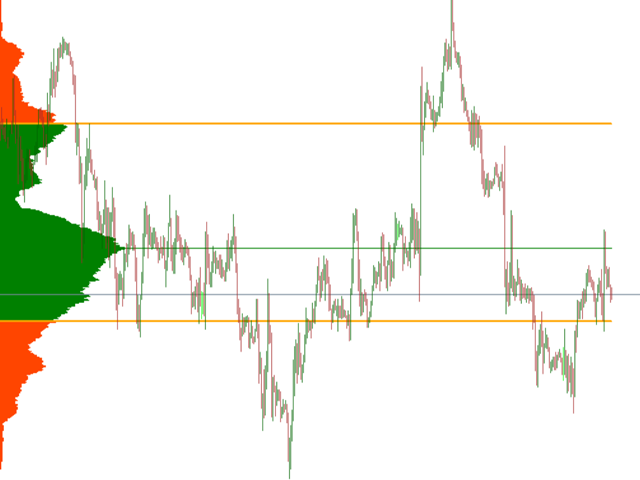
  • Shows the "fair" Value Area with 70% of all Volume
  • Shows critical low volume zones
  • Shows VPOC, VAL and VAH Points
  • integrated resource management to reduce the load while working with multiple charts
  • Works on all timeframes
  • Automatic calculation your defined timeset in all timeframes
  • Drag & Drop for live calculation
  • Also available for MT4
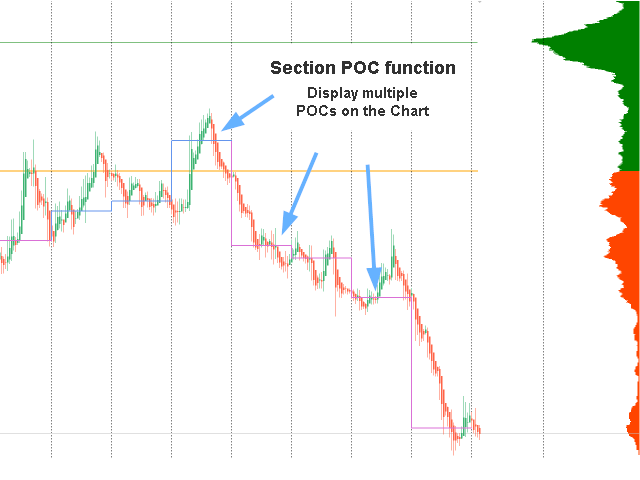
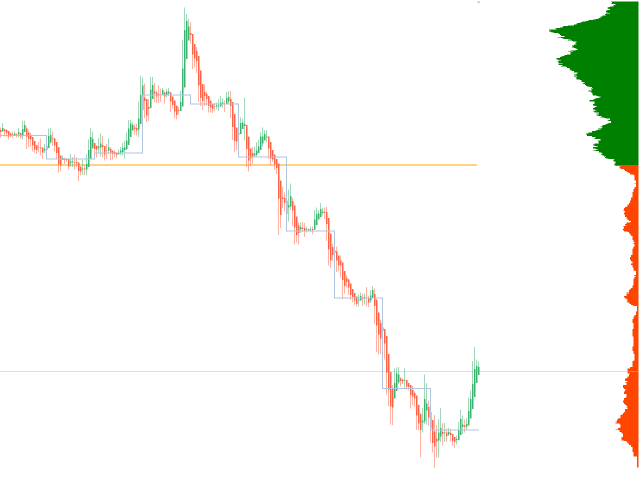
  • Section POCs (Display multiple POCs and VAL/VAH lines in one Chart)

Settings:

Variable
 Standard Value Description
Bar History
1440
Number of historical Bars to calculate from if "Auto calc history" is set to false
Level of Detail
1 Set the resolution for the profile. For protection purposes the level of detail will be automaticaly recalculated if you open a high volatile chart such as BTC.
Mirror to left side
false
Mirrors the whole VolumeProfile to the left side of the chart (Size can be adjusted with "Scale" input)
Horizontal Position (auto)
true
- Set this value to "true" to let the volume profile automaticaly align to your screen.
- Set this value to "false" to ajust the X-Position with the variable "X-Position"
Horizontal Position (manual)
0
Set the X Position of the Indicator on the screen (recommended value is 30 to 60)
Scale
10 Adjust the percentage of the chart, to be coverd by the VolumeProfile
Enable History Start line false Enable the History Start line, with which you can choose the calculation start of the Profile -  drag & Drop to calculate the VolumeProfile
Enable History End line true Enable the History End line, that shows until which candle the VolumeProfile will be calculated - drag & Drop to calculate the VolumeProfile
History line width 3 Set the History line width
History line color SlateGray Set the History line color
Enable Section POC  true Enable/Disable the section POC
Steps of POC 10 Set the number of POCs
Tie to Period separator true ties the sPOC to Period separators
Width of POC 2 Width of sPOC
Color POC Up Cornflower Blue Set the color for a POC that is higher than the last POC
Color POC Down Orchid Set the color for a POC that is lower than the last POC
POC Style solid Set solid or dotted POC Lines
Bars in XX XX Set the Bars for every Period if not tied to Period separator
Refresh auto
true
Set this to "false" if you want the VolumeProfile to not refresh automaticaly
Refresh rate
10
Adjust the refresh timer (Refresh the VolumeProfile every X seconds). Setting this value too low, will lead to a much slower performance
Auto calc history
false
Set this to "true" to activate the automatic conversion of minutes when the timeframe has changed
History (in Minutes)
1440
Set the time in minutes, that is used for the calculation of the VolumeProfile
Value Area percentage 70 Set the percentage of the Value Area
Enable Volume Profile  true Set this to "false" if you wish to hide the Volume Profile
Profile_Color
Green
Color of the area with 70% of all volume (fair value area)
Profile_Color_VLow
OrangeRed
Color of the areas with low volume
Profile_Background
true
Set the profile to background
POC_Style
0
Set the Style of the Point of Control
POC_Color
Green
Set the Color of the POC
POC_Width
1
Set the Width of the POC
POC_Background
true
Set the POC to background
VAL_Style
0
Set the Style of the Value Area Low Line
VAL_Color
Orange
Set the Color of the VAL
VAL_Width
2
Set the Width of the VAL
VAL_Background
true
Set the VAL to the Background
VAH_Style 0
Set the Style of the Volume Area High
VAH_Color Orange
Set the Color of the VAH
VAH_Width 2
Set the Width of the VAH
VAH_Background true
Set the VAH to the Background
Set custom History values (below) false Swtich between the general "Bar History" and the custom History values below
Bar History XX XX History in Bars if the Time Frame is XX


Reviews 9
Douglas De Souza Goncalves
126
Douglas De Souza Goncalves 2023.11.29 22:55 
 

I migrate to another account with the same broker but the indicator doesn't work... do I need to do some activation or something like that for the indicator to work again? thank you very much

Jan Patzig
51
Jan Patzig 2023.08.09 15:42 
 

Supaaaaa...

00023867
139
00023867 2022.02.09 16:20 
 

a very good indicator

Recommended products
Mt5 Market Profile
Mcblastus Gicharu Ndiba
Market Profile Introducing the Market Profile MetaTrader Indicator—your gateway to mastering market dynamics with precision and insight. This powerful tool delivers a classic Market Profile analysis, revealing price density over time and highlighting crucial levels, including the value area and control value for any trading session.  Compatible with timeframes from M1 to D1, it adapts to daily, weekly, monthly, or even intraday sessions, offering you unmatched flexibility. Lower timeframes pro
BoxChart MT5
Evgeny Shevtsov
5 (7)
The market is unfair if only because 10% of participants manage 90% of funds. An ordinary trader has slim changes to stand against these "vultures". This problem can be solved. You just need to be among these 10%, learn to predict their intentions and move with them. Volume is the only preemptive factor that faultlessly works on any timeframe and symbol. First, the volume appears and is accumulated, and only then the price moves. The price moves from one volume to another. Areas of volume accumu
Was: $249  Now: $99   Market Profile defines a number of day types that can help the trader to determine market behaviour. A key feature is the Value Area, representing the range of price action where 70% of trading took place. Understanding the Value Area can give traders valuable insight into market direction and establish the higher odds trade. It is an excellent addition to any system you may be using. Inspired by Jim Dalton’s book “Mind Over Markets”, this indicator is designed to suit the
This indicator allows you to enjoy the two most popular products for analyzing request volumes and market deals at a favorable price: Actual Depth of Market Chart Actual Tick Footprint Volume Chart This product combines the power of both indicators and is provided as a single file. The functionality of Actual COMBO Depth of Market AND Tick Volume Chart is fully identical to the original indicators. You will enjoy the power of these two products combined into the single super-indicator! Below is
Blahtech Supply Demand MT5
Blahtech Limited
4.54 (13)
Was: $299  Now: $99   Supply Demand uses previous price action to identify potential imbalances between buyers and sellers. The key is to identify the better odds zones, not just the untouched ones. Blahtech Supply Demand indicator delivers functionality previously unavailable on any trading platform. This 4-in-1 indicator not only highlights the higher probability zones using a multi-criteria strength engine, but also combines it with multi-timeframe trend analysis, previously confirmed swings
Volume by Price MT5
Brian Collard
3.25 (4)
The Volume by Price Indicator for MetaTrader 5 features Volume Profile and Market Profile TPO (Time Price Opportunity). Volume and TPO histogram bar and line charts. Volume Footprint charts. TPO letter and block marker collapsed and split structure charts. Static, dynamic and flexible range segmentation and compositing methods with relative and absolute visualizations. Session hours filtering and segment concatenation with Market Watch and custom user specifications. Graphical layering, positio
The indicator builds current quotes, which can be compared with historical ones and on this basis make a price movement forecast. The indicator has a text field for quick navigation to the desired date. Options: Symbol - selection of the symbol that the indicator will display; SymbolPeriod - selection of the period from which the indicator will take data; IndicatorColor - indicator color; Inverse - true reverses quotes, false - original view; Next are the settings of the te
Before installing the HeatMap indicator make sure you are using a broker that gives you access to the Depth of market (DOM) !! This indicator creates a heatmap on your chart allowing you to see the buy or sell limit orders easily and in real time. You have the possibility to change the setting and the colors of the HeatMap in order to adapt to all markets and all charts. Here is an example of a setting you can use with the NASDAQ100 on the AMPGlobal broker :  https://www.youtube.com/watch?v=x0
The uniqueness of this indicator lies in the volume accounting algorithm: accumulation occurs directly for the selected period without reference to the beginning of the day. The last bars can be excluded from the calculation, then the current data will have less influence on the significant levels (volumes) formed earlier. For a more accurate calculation, data from the M1 graph is used by default. The step of distribution of price volumes is regulated. By default, the right border of the display
BoxInside MT5
Evgeny Shevtsov
5 (3)
This indicator calculates the volume profile and places labels that correspond to the VAH, VAL and POC levels, for each candle individually. Indicator operation features The indicator works on the timeframes from M3 to MN, but it uses the history data of smaller periods: M1 - for periods from M3 to H1, M5 - for periods from H2 to H12, M30 - for the D1 period, H4 - for the W1 period, D1 - for the MN period. The color and location of the VAL, VAH and POC labels on the current candle are consider
FREE
Order Book, known also as Market Book, market depth, Level 2, - is a dynamically updated table with current volumes of orders to buy and to sell specific financial instument at price levels near Bid and Ask. MetaTrader 5 provides the means for receiving market book from your broker, but in real time only, without access to its history. The indicator OrderBook Cumulative Indicator accumulates market book data online and visualizes them on the chart. In addition, the indicator can show the market
VR Grid Mt5
Vladimir Pastushak
3.43 (7)
The VR Grid indicator is designed to create a graphical grid with user-defined settings. Unlike the standard grid , VR Grid is used to build circular levels . Depending on the user's choice, the step between the round levels can be arbitrary. In addition, unlike other indicators and utilities, VR Grid maintains the position of the grid even when the time period changes or the terminal is rebooted. You can find settings, set files, demo versions, instructions, problem solving, at [blog] You can
FREE
The Penta-O is a 6-point retracement harmonacci pattern which usually precedes big market movements. Penta-O patterns can expand and repaint quite a bit. To make things easier this indicator implements a twist: it waits for a donchian breakout in the right direction before signaling the trade. The end result is an otherwise repainting indicator with a very reliable trading signal. The donchian breakout period is entered as an input. [ Installation Guide | Update Guide | Troubleshooting | FAQ | A
Wapv Price and volume
Eduardo Da Costa Custodio Santos
The WAPV Price and Volume Indicator for MT5 is part of the ( Wyckoff Academy Wave Market ) and (Wyckoff Academy Price and Volume) toolset. The WAPV Price and Volume Indicator for MT5 was created to make it easy to visualize the volume movement on the chart in an intuitive way. With it you can observe the moments of peak volume and moments when the market has no professional interest Identify moments when the market is moving by inertia and not by movement of "smart money". It consists of 4 color
Market profile was developed by Peter Steidlmayer in the second half of last century. This is a very effective tool if you understand the nature and usage. It's not like common tools like EMA, RSI, MACD or Bollinger Bands. It operates independently of price, not based on price but its core is volume. The volume is normal, as the instrument is sung everywhere. But the special thing here is that the Market Profile represents the volume at each price level. 1. Price Histogram The Price Histogram
Premium level is a unique indicator with more than 80% accuracy of correct predictions! This indicator has been tested for more than two months by the best Trading Specialists! The author's indicator you will not find anywhere else! From the screenshots you can see for yourself the accuracy of this tool! 1 is great for trading binary options with an expiration time of 1 candle. 2 works on all currency pairs, stocks, commodities, cryptocurrencies Instructions: As soon as the red ar
ClusterSecond
Rafil Nurmukhametov
4.78 (32)
The utility allows you to build different types of graphs: Seconds chart from 1 second to 86400 seconds Tick chart from 1 tick and above The volume chart Delta chart Renko chart Range chart Demo version of the utility https://www.mql5.com/ru/channels/clustersecond Built-in indicators for volumetric analysis: daily market profile and market profile of the selected timeframe, Cluster Search Imbalance VWAP Dynamic POC, VAH, VAL the profile depth of the market vertical volume with various display op
VP hidden
Emr Aljnaby
4 (6)
The indicator works to convert normal volume into levels and determine financial liquidity control points. It is very similar in function to Fixed Volume Profile. But it is considered more accurate and easier to use than the one found on Trading View because it calculates the full trading volumes in each candle and in all the brokers present in MetaTrade, unlike what is found in Trading View, as it only measures the broker’s displayed prices. To follow us on social media platforms: tel
FREE
VWAP Daily
Anton Polkovnikov
Weighted average price indicator or VWAP. The well-known standard VWAP with the beginning of the day is added with the function of selecting the periodization. It can be calculated both every day and on other periods. Also the indicator allows to exclude the volume from the calculation, which will allow using it on the cryptocurrencies and forex. There is an alert for a VWAP price crossing. There are 1 and 2 standard deviation. Settings: Volume: turning volume on and off in the calculation mecha
This is a multi-symbol and multi-timeframe table-based indicator designed for a candlestick patterns detection with 46 patterns for META TRADER 5. Each formation has own image for easier recognition. Here you find most popular formations such as "Engulfing", "Hammer", "Three Line Strike", "Piercing" or Doji - like candles. Check my full list of patterns on my screenshots below. Also you can not only switch all bearish or bullish patterns from input, but also select formation for a specified symb
This indicator shows a candle combination based on dodge, dodge and pin bar. The logic of the pattern is to stand on the side of strength, after uncertainty. The indicator is universal and is useful for trading binary options, forex, ETFs, cryptocurrency, stocks. The indicator supports timeframes from M5 to MN, including non-standard TF presented in MT5. (М5,М6,М10,M12, M15, M20, M30, H1, H2, H3, H4, H6, H8, H12, D1, W1, MN). The ability to enable and disable TF is implemented. Sound alerts and
Mine Farm
Maryna Kauzova
Mine Farm is one of the most classic and time-tested scalping strategies based on the breakdown of strong price levels. Mine Farm is the author's modification of the system for determining entry and exit points into the market... Mine Farm - is the combination of great potential with reliability and safety. Why Mine Farm?! - each order has a short dynamic Stop Loss - the advisor does not use any risky methods (averaging, martingale, grid, locking, etc.) - the advisor tries to get
Alpha Trend Pro
Eslam Mohamed Abdelrady Shehata
Alpha Trend Pro: Your Ultimate Trading Companion Embark on a new era of trading with Alpha Trend Pro Indicator. Crafted with precision and innovation, Alpha Trend is designed to elevate your trading experience by seamlessly blending powerful elements to navigate various market conditions. **Key Features:** **1. Dynamic Adaptability:**    - In sideways market conditions, Alpha Trend acts as a dead indicator. Say goodbye to many false signals and welcome a tool that adapts seamlessly to mar
The professional tool of stock traders in now available on MetaTrader 5 . The Actual depth of market chart indicator visualizes the depth of market in the form of a histogram displayed on a chart, which refreshes in the real-time mode. Meet new updates according to user requests! Now Actual Depth of Market indicator displays the current ratio of volume of buy and sell requests (B/S ratio). It shows the share of volume of each type of requests in the entire flow of requests as well as the absol
Cumulative delta indicator As most traders believe, the price moves under the pressure of market buying or selling. When someone redeems an offer standing in the cup, the deal is a "buy". If someone pours into the bid standing in the cup - the deal goes with the direction of "sale". The delta is the difference between purchases and sales. A cumulative delta - the difference between the cumulative sum of purchases and sales for a certain period of time. It allows you to see who is currently contr
Market Profile 3 ForexArby com
Hussien Abdeltwab Hussien Ryad
3.83 (12)
Market Profile 3 MetaTrader 5 indicator  version 4.70— is a classic Market Profile implementation that can show the price density over time, outlining the most important price levels, value area, and control value of a given trading session. This indicator can be attached to timeframes between M1 and D1 and will show the Market Profile for daily, weekly, monthly, or even intraday sessions. Lower timeframes offer higher precision. Higher timeframes are recommended for better visibility. It is als
FREE
Value Chart Candlesticks
Flavio Javier Jarabeck
4.7 (10)
The idea of a Value Chart indicator was presented in the very good book I read back in 2020 , " Dynamic Trading Indicators: Winning with Value Charts and Price Action Profile ", from the authors Mark Helweg and David Stendahl. The idea is simple and the result is pure genius: Present candlestick Price analysis in a detrended way! HOW TO READ THIS INDICATOR Look for Overbought and Oversold levels. Of course, you will need to test the settings a lot to find the "correct" one for your approach.
FREE
Crash 1000 Scalping Indicator for the Crash 1000 Deriv Synthetic Index. Introduction The Crash 1000 Scalping Indicator is a specialized tool designed for the Crash 1000 index on the Deriv Synthetic market. This indicator is particularly useful for scalping on the M1 timeframe, helping traders to identify precise entry and exit points for buy positions. It is designed to be non-repainting, providing clear signals with audible alerts and push notifications, and is compatible with mobile devices th
New Combined Indicator - 3 in 1 Are you looking for trading tools that can enhance your market analysis and investment strategies? We have combined three of our best indicators into a single powerful and convenient solution, allowing you to get the most value for your trading. 1. Order Block Indicator (previously sold for $32.90) The Order Block Indicator is an essential tool for identifying areas of strong institutional interest within the market. This indicator marks the highs and lows of orde
Best SAR MT5
Ashkan Hazegh Nikrou
5 (1)
Description :  we are happy to introduce our new free indicator based on one of professional and popular indicators in forex market (Parabolic SAR) this indicator is new modification on original Parabolic SAR indicator, in pro SAR indicator you can see cross over between dots and price chart, this crossover is not signal but talk about end of movement potential, you can start buy by new blue dot, and place stop loss one atr before first blue dot, and finally you can exit as soon as dots cross
FREE
Buyers of this product also purchase
TPSpro RFI Levels MT5
Roman Podpora
4.73 (11)
INSTRUCTIONS    RUS   -    ENG           R ecommended to use with an indicator   -   TPSpro  TREND PRO -  Version MT4                 A key element in trading is zones or levels from which decisions to buy or sell a trading instrument are made. Despite attempts by major players to conceal their presence in the market, they inevitably leave traces. Our task was to learn how to identify these traces and interpret them correctly. Main functions:: Displaying active zones for sellers and buyers! T
First of all Its worth emphasizing here that this Trading System is Non-Repainting   , Non Redrawing and Non Lagging Indicator Which makes it ideal from both manual and robot trading .  Online course, manual and download presets. The Smart Trend Trading System MT5 is a comprehensive trading solution tailored for new and experienced traders . It combines over 10 premium indicators and features more than 7 robust trading strategies , making it a versatile choice for diverse market conditions . Tre
Atomic Analyst MT5
Issam Kassas
4.42 (19)
First of all Its worth emphasizing here that this Trading Indicator is   Non-Repainting   , Non Redrawing and Non Lagging Indicator   Indicator, Which makes it ideal from both manual and robot trading.  User manual: settings, inputs and strategy . The Atomic Analyst  is a PA Price Action Indicator that uses Strength and Momentum of the price to find a better edge in the market. Equipped with Advanced filters which help remove noises and false signals, and Increase Trading Potential. Using Mult
AT Forex Indicator MT5
Marzena Maria Szmit
5 (4)
The AT Forex Indicator MT5 is a sophisticated trading tool designed to provide traders with a comprehensive analysis of multiple currency pairs. This powerful indicator simplifies the complex nature of the forex market, making it accessible for both novice and experienced traders. AT Forex Indicator uses advanced algorithms to detect trends, patterns and is an essential tool for traders aiming to enhance their forex trading performance. With its robust features, ease of use, and reliable signal
TrendMaestro5
Stefano Frisetti
note: this indicator is for METATRADER4, if you want the version for METATRADER5 this is the link:  https://www.mql5.com/it/market/product/108106 TRENDMAESTRO ver 2.4 TRENDMAESTRO recognizes a new TREND in the bud, he never makes mistakes. The certainty of identifying a new TREND is priceless. DESCRIPTION TRENDMAESTRO identifies a new TREND in the bud, this indicator examines the volatility, volumes and momentum to identify the moment in which there is an explosion of one or more of these data a
FxaccurateLS
Shiv Raj Kumawat
WHY IS OUR FXACCCURATE LS MT5 THE PROFITABLE ? PROTECT YOUR CAPITAL WITH RISK MANAGEMENT Gives entry, stop and target levels from time to time. It finds Trading opportunities by analyzing what the price is doing during established trends. POWERFUL INDICATOR FOR A RELIABLE STRATEGIES We have made these indicators with a lot of years of hard work. It is made at a very advanced level. Established trends provide dozens of trading opportunities, but most trend indicators completely ignore them!
MetaForecast M5
Vahidreza Heidar Gholami
5 (2)
MetaForecast predicts and visualizes the future of any market using different powerful methods. While financial markets are not always predictable, if there are patterns in the past data, MetaForecast can learn and predict the future as accurately as possible. It features a complete implementation of neural networks embedded directly into the indicator, enabling traders to create and train AI models using data from multiple symbols to learn complex patterns. MetaForecast leverages your computer'
Boom and Crash Trend Detector is a  Non-Repaint   MT5 trading system usually being sold for 50 0$ . Most people use this for Deriv but can be used to forex too. The boom and crash spike indicator is a spike detecting software, with Multiple features, these features include. Spike Alert ( from 10 to 100-second warning before spike) Continues spike Alert (for double or continuous spikes at a time) supports all Boom/crash Indices M6 time frame works best here . Bigger time frame trend pointer f
How many times have you bought a trading indicator with great back-tests, live account performance proof with fantastic numbers and stats all over the place but after using it, you end up blowing your account? You shouldn't trust a signal by itself, you need to know why it appeared in the first place, and that's what RelicusRoad Pro does best! User Manual + Strategies + Training Videos + Private Group with VIP Access + Mobile Version Available A New Way To Look At The Market RelicusRoad is
THIS INDICATOR, BASED ON ARTIFICIAL INTELLIGENCE, identifies possible market reversal points by reading the footprint, and signals IN ADVANCE small market movements before they occur. Unlike price and volume indicators, which generate "late" entries, i.e. when a confirmation in price or volume has already occurred on a change in direction, and therefore often the movement has already ended, this indicator signals, based on what it reads in the footprint, "WHEN THE MOVEMENT SHOULD HAPPEN" and th
How to use Pair Trading Station Pair Trading Station is recommended for H1 time frame and you can use it for any currency pairs. To generate buy and sell signal, follow few steps below to apply Pair Trading Station to your MetaTrader terminal. When you load Pair Trading Station on your chart, Pair Trading station will assess available historical data in your MetaTrader platforms for each currency pair. On your chart, the amount of historical data available will be displayed for each currency pai
IVISTscalp5
Vadym Zhukovskyi
5 (5)
What's new about iVISTscalp5 forecast indicator (Version 10)? iVISTscalp5 is a unique nonlinear forecasting for a week ahead system for any financial instrument which executes fast scalping using time levels. iVISTscalp5 is a tool for easy study and understanding of financial market. 1) iVISTscalp5 forecast indicator has been completely rewritten into another programming language (C++), which has accelerated data loading and processing. As a result, a different graphical display of forecast
Bill Williams Advanced
Siarhei Vashchylka
5 (8)
Bill Williams Advanced is designed for automatic chart analysis using Bill Williams' "Profitunity" system. The indicator analyzes four timeframes at once. Manual (Be sure to read before purchasing) Advantages 1. Automatically analyzes the chart using the "Profitunity" system of Bill Williams. The found signals are placed in a table in the corner of the screen. 2. Equipped with a trend filter based on the Alligator indicator. Most of the system signals are recommended to be used only accordi
Noize Absorption Index - is the manual trading system that measures the difference of pressure between bears forces and bulls forces. Green line - is a noize free index that showing curent situation. Zero value of index shows totally choppy/flat market.Values above zero level shows how powerfull bullish wave is and values below zero measures bearish forces.Up arrow appears on bearish market when it's ready to reverse, dn arrow appears on weak bullish market, as a result of reverse expectation.
Elliot Waves Analyzer Pro
Viktor Weidenthal
2.67 (3)
Elliot Waves Analyzer Pro calculates Elliot Waves to Help Identify Trend direction and Entry Levels. Mainly for Swing Trading Strategies. Usually one would open a Position in trend direction for Wave 3 or a Correction for Wave C . This Indicator draws Target Levels for the current and next wave. Most important Rules for Elliot Wave Analysis are verified by the Indicator.  The Pro version analyzes Multiple Timeframes and shows the Subwaves and Target-Levels.   For an Overview  " Elliot Waves Anal
Go Way TREND
Ywsf Hsyn Hmad Alrsh
Go with the trend. Yes, wait for the entry signal, whether buy or sell, on a 15-minute frame, and check the signal if it appears on a 30-minute frame (sometimes it takes an hour or more for the signal to appear. You can return to the 15-minute frame and return to the 30-minute frame, and repeat this until the main signal appears for you. If the signal appears on the 30-minute frame, enter with the price and profit is taken when the drawing line changes, profit is booked, or when an opposite si
Currently, the product's selling price is over $480; however, we are offering a monthly rental system for only $30. This allows many people to enjoy and experience our products during this launch stage, which will likely lead to positive reviews from users, making it more enjoyable | We hope that if there are more than 10 positive reviews, the GOOD NEWS is that the next use will last for 3 months at a fixed price of only $30 | Take advantage of our promo opportunity, before it goes back to sell
Introduction to X3 Chart Pattern Scanner X3 Cherart Pattern Scanner is the non-repainting and non-lagging indicator detecting X3 chart patterns including Harmonic pattern, Elliott Wave pattern, X3 patterns, and Japanese Candlestick patterns. Historical patterns match with signal patterns. Hence, you can readily develop the solid trading strategy in your chart. More importantly, this superb pattern scanner can detect the optimal pattern of its kind. In addition, you can switch on and off individu
Piranha version 2
Maria Strudov
5 (1)
"Piranha" - an autonomous trading system that determines overbought and oversold levels on the chart. Red and blue zones represent overbought and oversold levels respectively. Entry points are marked with arrows: a downward arrow in the red zone for "sell" and an upward arrow in the blue zone for "buy". The Take profit level is indicated by the green moving average. Key features: Adjusting the Take profit level as the green moving average changes position. Averaging ability when a new market e
The iChannels
BeeXXI Corporation
5 (2)
Ultra-fast recognition of parabolic channels (as well as linear, horizontal and wavy channels) throughout the depth of history, creating a hierarchy of channels. Required setting: Max bars in chart: Unlimited This indicator is designed primarily for algorithmic trading, but can also be used for manual trading.  This indicator will have a very active evolution in the near future and detailed descriptions on how to apply to create robots
Introducing the Power Trade Plus indicator designed by a small group of traders with a few years of experience trading the market profitably.  The Power Trade Plus is derived from the Power Trade indicator,  the indicator strive in powerful sniper entries and take profit levels,  with an algorithm that's can determine the markets volatility and Provides entries based on the current market volatility. This indicator is much more effective in stock ,currencies and indices.
First of all Its worth emphasizing here that this Trading System is Non-Repainting, Non-Redrawing and Non-Lagging Indicator, Which makes it ideal for professional trading. Online course, user manual and demo. The "Smart Support and Resistance Trading System" is an advanced indicator tailored for  new  and  experienced  traders. It empowers traders with precision and confidence in the forex market. This comprehensive system combines 7+ strategies, 10 indicators, and various trading approaches,
SMCpro
Arief
5 (1)
Currently Price  20% OFF  ( for unlimited use ) Indicator   USER MANUAL , trade setups, solving issues, etc :  Direct Download Here     (  for users only  ) Hello World! Introducing.. SMCpro tool and Indicator for  MetaTrader 5 , a cutting-edge feature designed to revolutionize your trading experience. With innovative ICT Smart Money Concept, you gain unparalleled insight into market dynamics, empowering you to make informed trading decisions like never before. SMC Indicator built on th
Elliott Wave Trend was designed for the scientific wave counting. This tool focuses to get rid of the vagueness of the classic Elliott Wave Counting using the guideline from the template and pattern approach. In doing so, firstly Elliott Wave Trend offers the template for your wave counting. Secondly, it offers Wave Structural Score to assist to identify accurate wave formation. It offers both impulse wave Structural Score and corrective wave Structure Score. Structural Score is the rating to sh
The Precision Index Oscillator (Pi-Osc) for MT5 by Roger Medcalf of Precision Trading Systems First of all, if you have any questions please contact me via my website which you can find by searching the above title. Version 2 has been carefully recoded to be super fast to load up on your chart and some other technical improvements have been incorporated to enhance experience. Pi-Osc was created to provide accurate trade timing signals designed to find   extreme     exhaustion points, the points
Matreshka
Dimitr Trifonov
5 (1)
Matreshka self-testing and self-optimizing indicator: 1. Is an interpretation of the Elliott Wave Analysis Theory. 2. Based on the principle of the indicator type ZigZag, and the waves are based on the principle of interpretation of the theory of DeMark. 3. Filters waves in length and height. 4. Draws up to six levels of ZigZag at the same time, tracking waves of different orders. 5. Marks Pulsed and Recoil Waves. 6. Draws arrows to open positions 7. Draws three channels. 8. Notes support and re
Cryo
Sabina Fik
5 (1)
Cryo is based on the process of identifying the rate of change in price growth and allows you to find entry and exit points from the market. A fundamental technical indicator that allows you to assess the current market situation in order to enter the market of the selected currency pair in a trend and with minimal risk. The Cryo indicator was created on the basis of the original indicators for searching for extremes, the indicator is well suited for determining a reversal or a large sharp je
Introduction Excessive Momentum Indicator is the momentum indicator to measure the excessive momentum directly from raw price series. Hence, this is an extended price action and pattern trading. Excessive Momentum Indicator was originally developed by Young Ho Seo. This indicator demonstrates the concept of Equilibrium Fractal Wave and Practical Application at the same time. Excessive Momentum detects the market anomaly. Excessive momentum will give us a lot of clue about potential reversal and
Dragon Multi Indicator MT5
Mansour Babasafary
5 (5)
3 Indicators in 1 indicator Strategy based on price action Made specifically for the best forex currency pairs Can be used in the best time frame of the market at a very reasonable price This indicator is basically 3 different indicatos . But we have combined these 3 indicators in 1 indicator so that you can use 3 indicators at the lowest price. All three strategies are based on price action. But based on different trends. Long term, medium term and short term Attributes : No repaintin
[ MT4 Version ] Only the next 10 units at current price! Final price: $299 Are you tired of spending months on demo or live accounts to test your trading strategies? The Backtesting Simulator is the ultimate tool designed to elevate your backtesting experience to new heights. Utilizing Metatrader historical symbol information, it offers an unparalleled simulation of real market conditions. Take control of your testing speed, test ideas quickly or at a slower pace, and witness remarkable improve
More from author
VolumeProfile
Robert Hess
3.8 (5)
Descption: The Volume Profile displays detailed informations of historical trading activities at certain price levels (Market Profile). So you can locate the areas with the best prices in the market and get an advantage about other market participants. Features: Customizable Volume Profile / Market Profile Shows the "fair" Value Area with 70% of all Volume Shows critical low volume zones Shows VPOC, VAL and VAH Points Works on all timeframes Also available for MT5 ( https://www.mql5.com/en/m
Description: TrendAccess can optimize your trading time by showing you the trend via two different calculation modes quick and easy. No more searching for Trends. Just open the chart and look at the trend display. Features: Shows Uptrend, Downtrend and "No Trend" indicator Shows the calculated ZigZag Profile Works on all timeframes Two different calculation Modes (MACD and Candle-based calculation) Settings: Variable  Standard Value Description  Calculation Mode  Candle based  C
Description This addon is originated from my own trading. I spent my whole time waiting for signals and just wanted a notification  when a specific signal appears. So i started to wrote my own addon and called it "LifetimeSaver", because thats exactly what it is for me. But because this addon should not only be for my personal trading, I extended the LifetimeSaver and now its highly customizable,  so that it can fit your needs. Functions: Notification at your defined target/signal Notificatio
Description: The Multi POC displays multiple Point Of Controls on one chart.  This Indicator is also already included in the "VolumeProfile" Indicator . Features: Customizable Range POC Customizable section POCs with VAL&VAH lines Works on all timeframes Drag & Drop for live calculation Support: The indicator is constantly being developed and improved. Please do not hesitate to contact me via the MQL5 Platform. I am very grateful about any Bug report, so that i can constantly improve the ind
Filter:
Douglas De Souza Goncalves
126
Douglas De Souza Goncalves 2023.11.29 22:55 
 

I migrate to another account with the same broker but the indicator doesn't work... do I need to do some activation or something like that for the indicator to work again? thank you very much

Jan Patzig
51
Jan Patzig 2023.08.09 15:42 
 

Supaaaaa...

RuedigerWuest
24
RuedigerWuest 2022.06.25 15:26 
 

Ich find das Tool sehr gut gelungen und hilfreich. Leider läuft es auf meinem Windows 11 Notebook nicht mehr. Nur unter Windows 10 läuft es bei mir.

00023867
139
00023867 2022.02.09 16:20 
 

a very good indicator

271811
199
271811 2022.01.26 18:04 
 

Please BEWARE of Fake Reviews by this seller!!Dont waste your money!! VERY BUGGY!! indicator options does not work correctly!!

No I am not selling my own product!! Im not a coder or programmer!! Mr Hess Volume Profile

is no good! It blinks when you change options...Terrible coding IMO!! Dont believe me, go ahead and purchase!!

Robert Hess
1650
Reply from developer Robert Hess 2022.02.09 16:52
My Opinion: I think this is an account of somebody who is selling his own products and rate others bad, so he can sell his own stuff better. The Story: He bought (edit: *rented) the indicator for a Month, seemed very happy and all of a sudden he mentioned various "bugs". I wanted to help him, told him to give me the neccesary informations that I needed to look where exactly the problem is, because: I tested every setting on every timeframe and nearly every chart but couldnt find these issues that he mentioned. I even implemented a new feature on the MT4 version especialy for him. But neither he wanted to be helped, nor could I find any bug in the indicator!?
Lagoon3800
19
Lagoon3800 2021.11.08 10:40 
 

Hallo! Habe Volume Profile am 2.11.2021 für 165$ hier erworben, mir wurden 196,35 von Paypal abgebucht - absolut unfair. Wo findet man eine genauere Anleitung um auch alle Feinheiten dieses Indikators nutzen zu können?

Robert Hess
1650
Reply from developer Robert Hess 2021.12.03 10:50
Hallo Lagoon3800, wie bereits erwähnt findest du eine umfassende Tabelle in der allgemeinen Übersicht des Indikators. Die 19% die du zusätzlich per PayPal bezahlt hast sind leider als Mehrwertsteuer (VAT) in Deutschland fällig. Dafür können weder ich, noch der Webseitenbetreiber etwas. Ich hoffe ich konnte dennoch zu Aufklärung beitragen :) Robert
CSG CSG
1594
CSG CSG 2020.06.05 11:59 
 

Jeden Euro wert! Ich finde es schade, dass manche Leute Bewertungen abgeben und dann auch noch aufgrund ihres mangelnden Wissens negative... Ich arbeite schon länger mit diesem Profil und nach diversen Tests und Fehlkäufen anderer Anbieter stimmen hier die Daten perfekt! Worauf kommt es eigentlich an? 1. Wenn ich rückwärtigen Raum betrachte, z.B. im M5 30 Tage als Profil darstellen will, muss ich 8640 Perioden nutzen, hier versagen manch andere, denn dort stellt man "Monat" ein und es wird nur auf die Daten der Monatskerze zugegriffen, was natürlich, je jünger der Monat ist nichts bringt. 2. Dieser Indikator hier aktualisiert sich sauber und das auch in volatilen Situationen, glaubt mir, wenn es richtig um Geld geht, ist es sehr ärgerlich, wenn ein Indikator die ganze Plattform aufhängt. 3. Man kann den Indikator mehrfach auf einen Chart verwenden und dann sieht man auch beim Umschalten die gleichen Daten, wenn man diese auch entsprechend einstellt. (Visualisierung z.B. nur in H1, dann Perioden 720 wenn man 30 Tage darstellen will) 4. Man kann Farbe, Skalierung, links rechts... alles frei gestalten und wenn gewünscht auch nur die Linien anzeigen. 5. Wenn man wirklich mit einem Indikator arbeitet, dann holt man den Preis dafür bereits nach 1 oder ein paar Trades wieder rein und hier stimmt P/L absolut, was man hier sicher von einigen 10 oder X Euro Produkten nicht sagen kann. 6. Bevor man etwas negativ bewertet, sollte man sich mit der Systematik dahinter beschäftigen und niemand zwingt einen etwas zu kaufen, ein Top Produkt aber aufgrund der eigenen Fehlentscheidung schlecht zu bewerten ist absolut daneben und solche Leute werden auch nie erfolgreich sein, denn sie suchen die Schuld für ihre eigenen Fehler bei anderen. Warum schreibe ich das alles? Weil ich absolut zufrieden mit dem Produkt bin, man auch mit dem Entwickler kommunizieren kann, er es immer aktiv weiter entwickelt und weil es mich ärgert, wenn jemand etwas ohne ausreichende Fachkenntnis schlechter bewertet. Absolute Empfehlung und außerdem - man kann es ja auch erst mal einen Monat testen. Danke und weiter so :-)

James Lavoie
56
James Lavoie 2019.05.14 15:18 
 

User didn't leave any comment to the rating

Robert Hess
1650
Reply from developer Robert Hess 2021.04.25 13:54
Hi James, i wanted to solve the problems with you, but sadly you didnt answered. I think one star isn't what the indicator deserve.
Faisal Javed
803
Faisal Javed 2019.04.24 23:29 
 

Excellent tool and helpful as a part of your trading strategy. Highly recommened.

Reply to review
Version 1.43 2023.07.24
- Added VAL/VAH lines to "Section POC" Option
Version 1.42 2022.05.12
New Feature:
- Customer request: A POC of the current period will now be calculated/displayed
-> You can change the gap between the current candle and the last period section line with a new input field
Version 1.41 2022.05.06
- Usability improvements
Version 1.40 2022.05.02
New Features:
- Set section POC to be tied to period separators
Version 1.39 2022.04.29
New Features:
- implemented a "Section POC"
-> You can now show a POC for multiple sections in the chart
Version 1.38 2022.04.29
New Features:
- Drag & Drop Line for Start and End time of the Indicator calculation

Other:
- Code optimization
- Usability improvements
Version 1.37 2021.12.20
BugFix
- fixed a bug where a zoomed in chart broke the Indicator

Change
- the "Scale" represents now the percentage of the Chart to be covered by the VolumeProfile
-> Changed the default value of "Scale" from 4 to 10 (10% of Chart will be covered)
Version 1.36 2021.10.11
Implemented Feature Request:
- Bar History: You can now insert the History in Bars for every single timeframe and select/switch if you wish to use your custom settings or the general "Bar History" that is the same for every Time Frames (Button "Set custom History values (below)")
Version 1.35 2021.07.02
- Fixed the appearance in "Mirrored to left side" mode, it should now look as in unmirrored mode
Version 1.34 2021.06.11
New Feature:
- You can now adjust the percentage for the "Value Area"
Version 1.33 2021.06.11
- Changed calculation of the profile to improve accuracy
Version 1.32 2021.04.25
- Optimization of some processes to reduce CPU usage
Version 1.31 2021.04.22
BugFix
- the VolumeProfile no longer recalculates if an object in the chart has been dragged
Version 1.30 2021.03.13
- Added a History line, that shows to which time the VolumeProfile will be calculated (Bar History)
- Added a Drag & Drop function for the History line. You can now move the History line, to recalculate the VolumeProfile to the specified point on the chart
Version 1.29 2021.01.17
- Calculation of auto Detail for high volume charts changed for an optimized look of the VolumeProfile
Version 1.28 2020.12.07
- Bugfixes
Version 1.27 2020.12.04
- Added function for minute calculation when the period changes
Version 1.26 2020.09.30
- In standard settings, the VolumeProfile will now refresh every 10 Seconds

Added new Parameters:
- "Refresh Auto": Set this to true, if you want the VolumeProfile to refresh automaticaly
- Refresh rate: Adjust the refresh timer in seconds
Version 1.25 2020.07.20
Changes:
- Bar History default value is now 1440!

Bugfixes:
- Some minor changes to fasten up the initialisation of the VolumeProfile
Version 1.24 2020.07.06
Bug Fix:
- The VolumeProfile will now redraw, if the timeframe has changed
Version 1.23 2020.06.03
Changes:
- it is now possible to hide the VolumeProfile and only show the POC and VHigh/VLow Lines via the "Enable Volume Profile" Switch
Version 1.22 2020.06.03
BugFix:
- Objects you created will no longer be deleted if you change the period
Version 1.21 2020.06.03
Changes:
- you can now "scale" the VolumeProfile in mirrored Mode
Version 1.2 2020.05.09
New Function:
- Mirror to left side: Mirrors the VolumeProfile to the left side of the chart

Changes:
- Added "Mirror to left side" function
- changed the description of inputs
- "auto set X-Position" -> Horizontal Position (auto)
- "X-Position" -> Horizontal Position (manual)
Version 1.1 2019.04.09
Initial release