Interactive BB Matrix
- Indicateurs
- Tsvetan Tsvetanov
- Version: 1.0
- Activations: 6
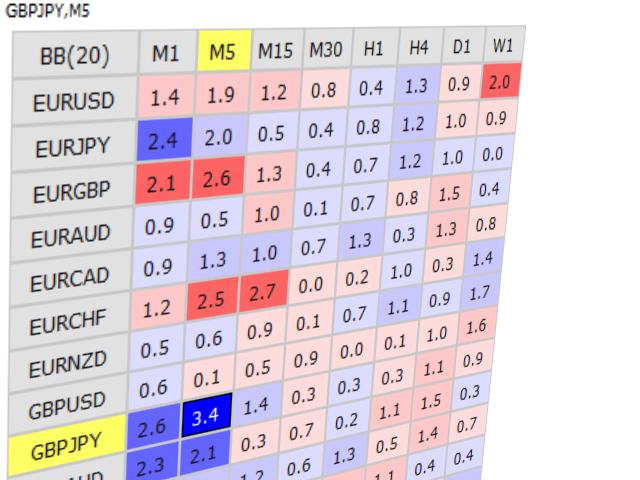
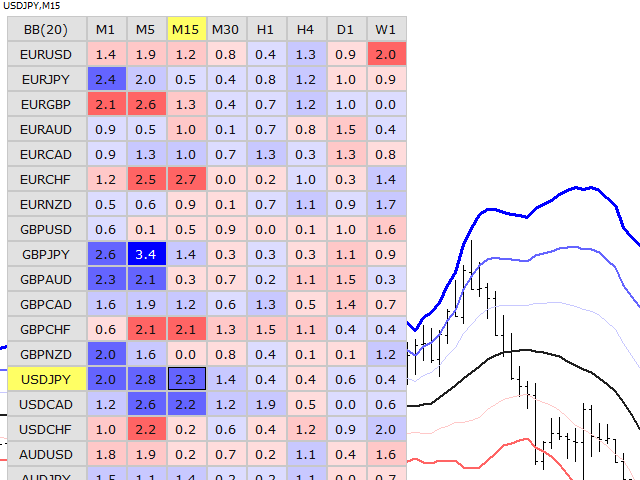
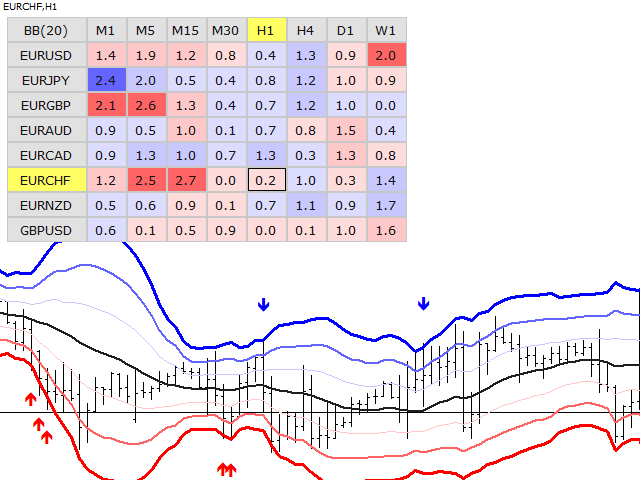
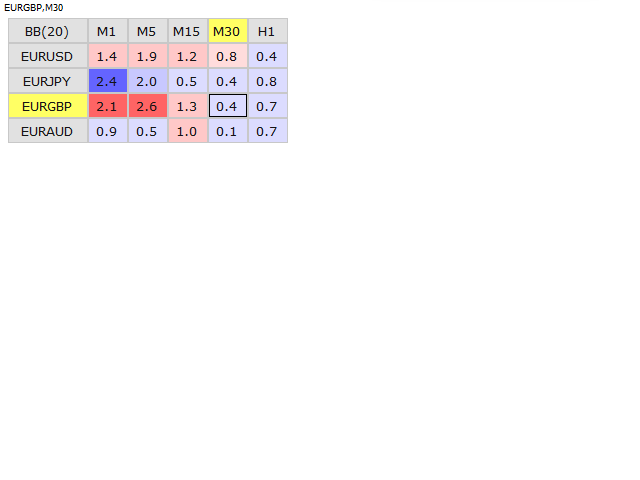
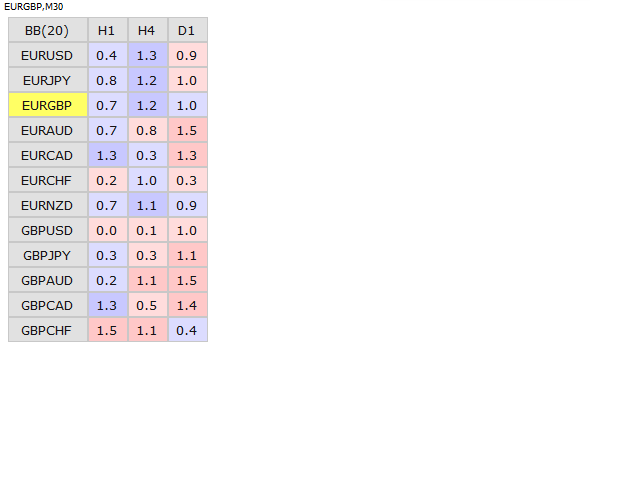
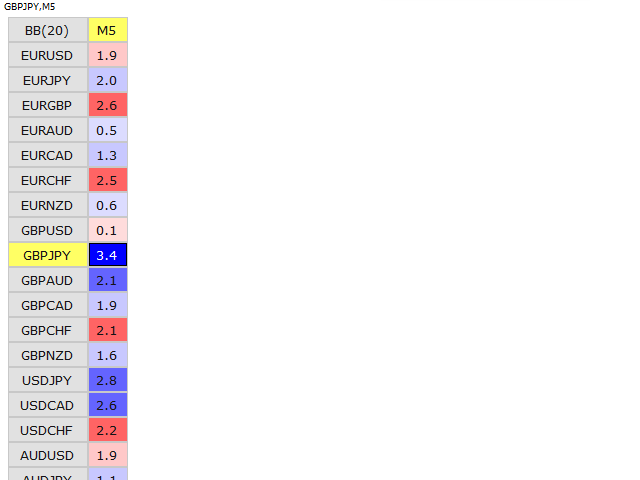
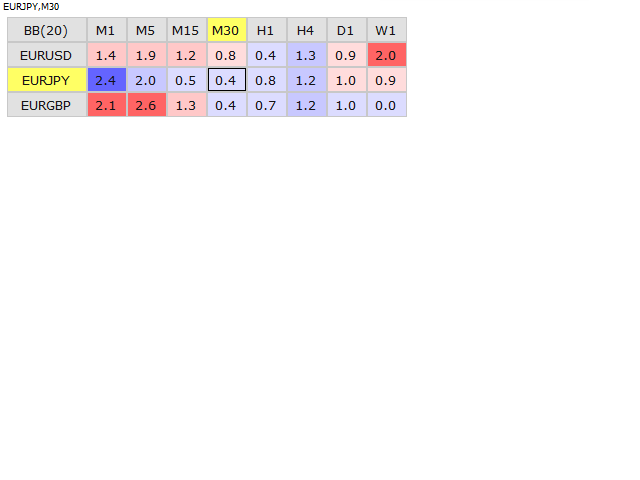
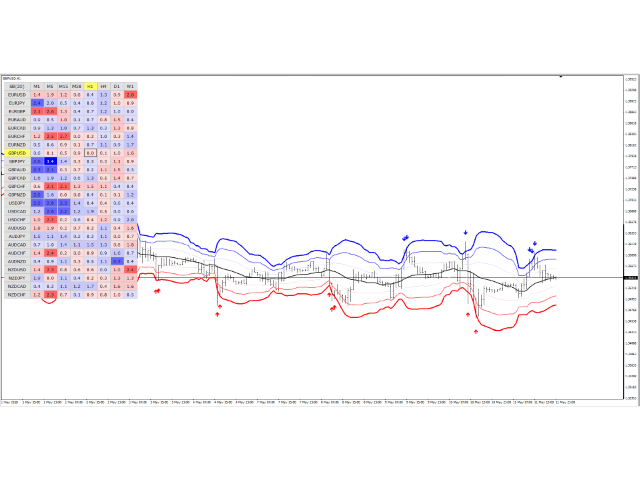
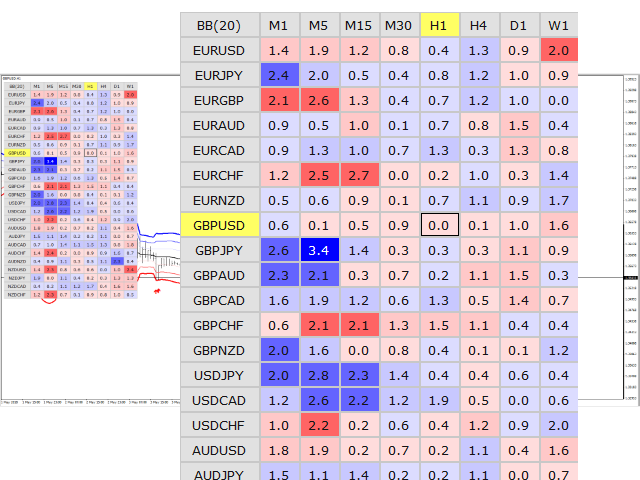
This indicator displays Bollinger Bands signals for multiple symbols and multiple time frames. The signals are created as a simple ratios which represent the distance between the current price and the moving average measured in standard deviations. This way we create a very versatile and easy to use indicator which helps us to identify not only the strongest trends but also the most overbought and oversold conditions.
Features
- Accurate signals in real time for multiple time frames and multiple symbols.
- Colorful interactive panel with quick buttons which gives you the ability to switch time frames and symbols simultaneously with one click.
- Ability to set the number of visible symbols (vertically) and the number of time frames (horizontally).
- The indicator is automatically synchronized with the Market Watch window in Meta Trader 4 where you can set custom lists with symbols.
- Wide range of settings for visual customization including panel size, font size and colors.
Settings
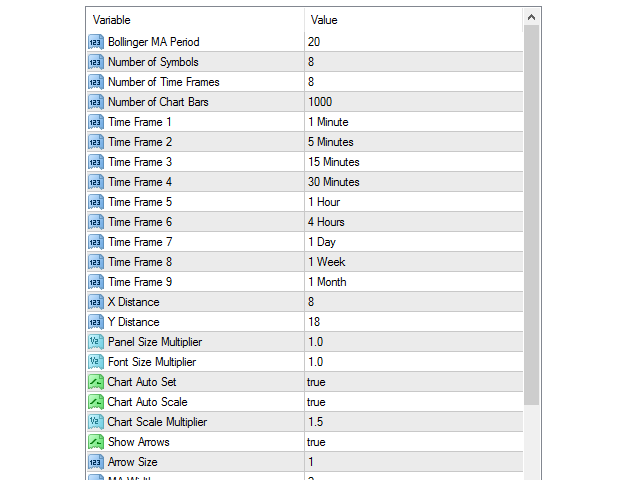
- Bollinger MA Period - number of bars for the calculation of the moving average and the standard deviation for each time frame.
- Number of Symbols - how many symbols to display.
- Number of Time Frames - how many timeframes to display.
- Number of Chart Bars - how much history to show on the current chart.
- Time Frame 1 - select timeframe.
- Time Frame 2 - select timeframe.
- Time Frame 3 - select timeframe.
- Time Frame 4 - select timeframe.
- Time Frame 5 - select timeframe.
- Time Frame 6 - select timeframe.
- Time Frame 7 - select timeframe.
- Time Frame 8 - select timeframe.
- Time Frame 9 - select timeframe.
- X Distance - horizontal distance from the upper left corner.
- Y Distance - vertical distance from the upper left corner.
- Panel Size Multiplier - increase or decrease the size of the interface.
- Font Size Multiplier - increase or decrease the size of the font.
- Chart Auto Set - enable/disable the automatic default chart configuration.
- Chart Auto Scale - enable/disable the automatic vertical scaling.
- Chart Scale Multiplier - multiplier for the vertical scaling.
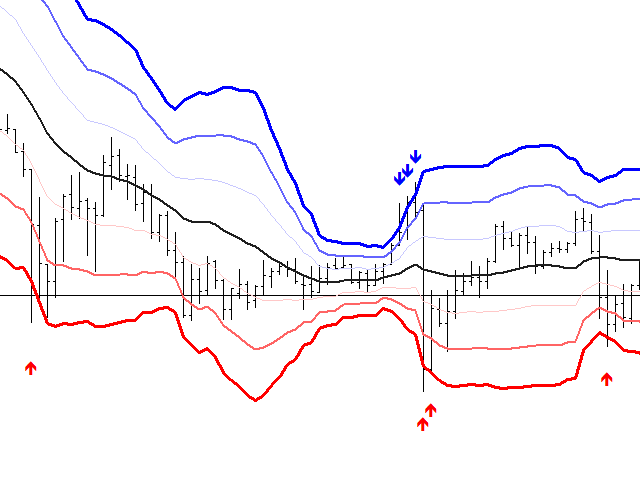
- Show Arrows - true/false. The arrows show the bars in the history where the prices are above or below 3 standard deviations.
- Arrow Size - size of the arrows.
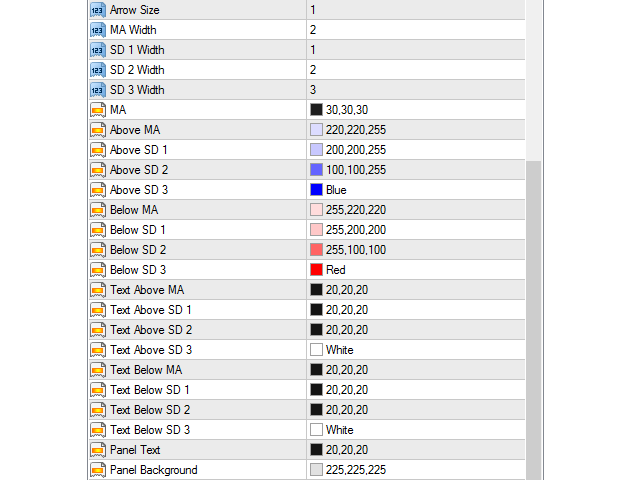
- MA Width - thickness of the moving average on the chart.
- SD 1 Width - thickness of the first line. (1 standard deviation below/above the MA)
- SD 2 Width - thickness of the second line. (2 standard deviations below/above the MA)
- SD 3 Width - thickness of the third line. (3 standard deviations below/above the MA)
- Color Settings.
Note! Due to technical limitations the demo works only with one symbol in the strategy tester. So there is no way to switch between symbols and time frames.
If you have some questions or if you need help, contact me via PM.









Ottimo scanner con valori corretti per l'uso delle bande di Bollinger. Bravo