• 미리보기
  • 리뷰 (2)
  • 코멘트 (2)

Interactive BB Matrix

2

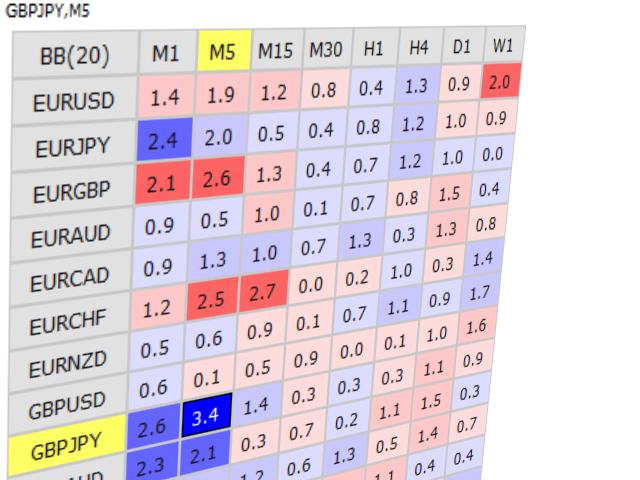
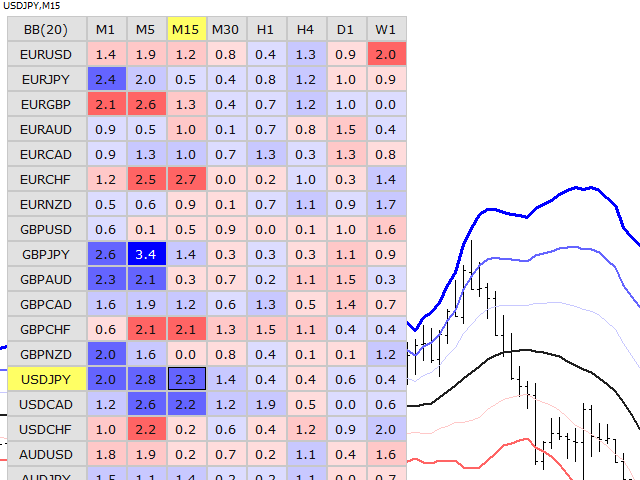
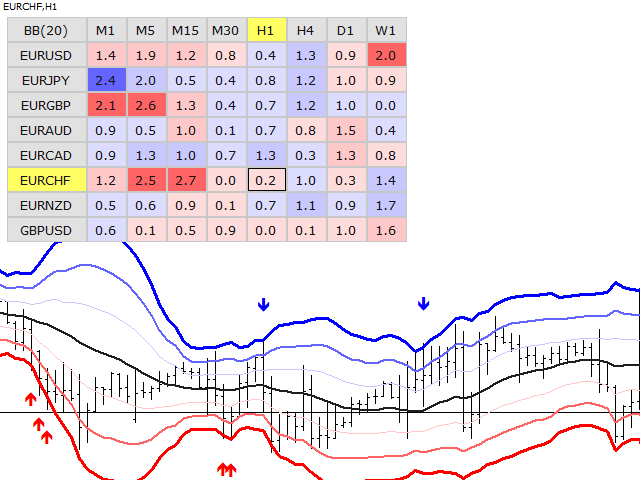
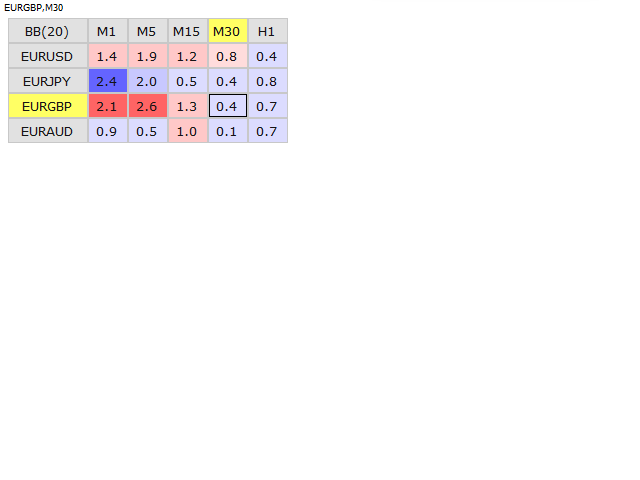
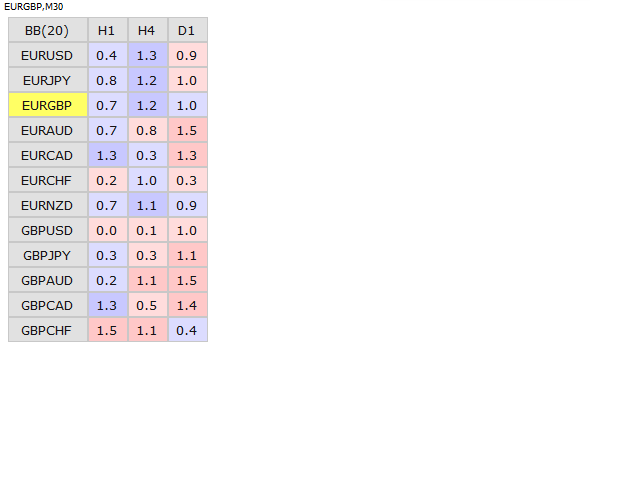
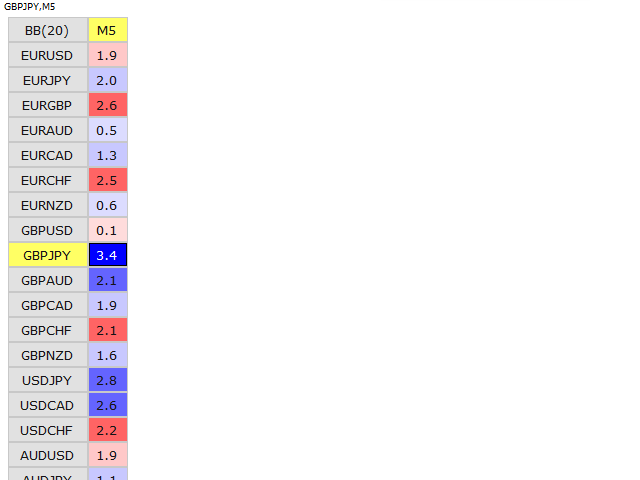
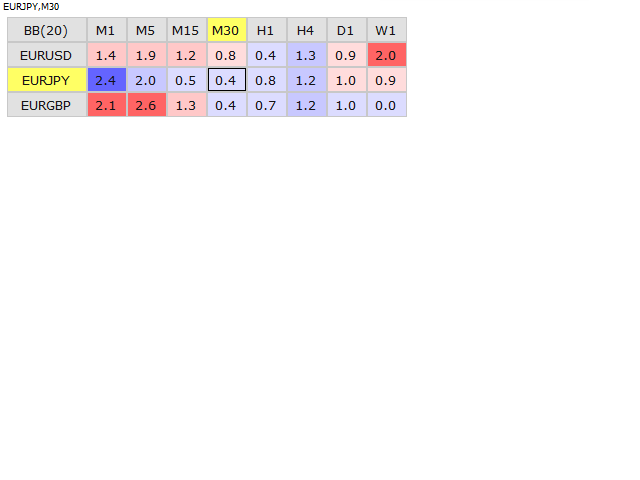
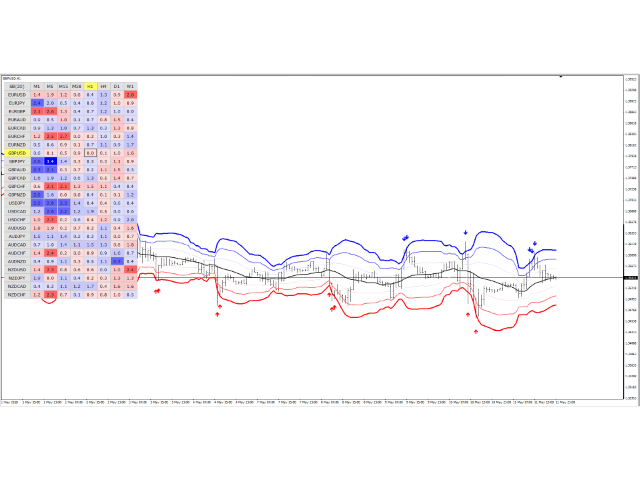
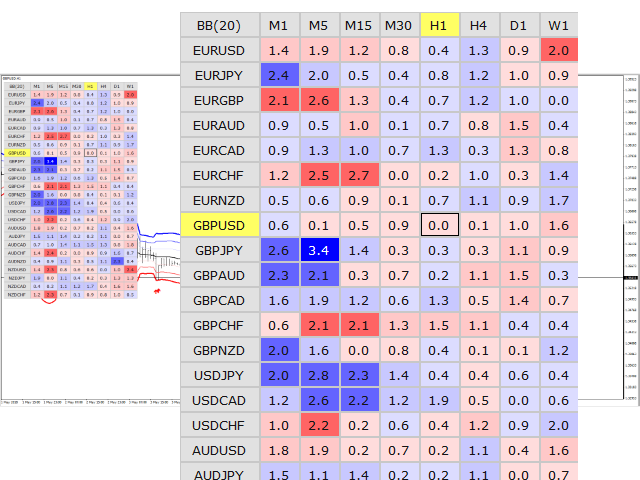
This indicator displays Bollinger Bands signals for multiple symbols and multiple time frames. The signals are created as a simple ratios which represent the distance between the current price and the moving average measured in standard deviations. This way we create a very versatile and easy to use indicator which helps us to identify not only the strongest trends but also the most overbought and oversold conditions.


Features

  • Accurate signals in real time for multiple time frames and multiple symbols.
  • Colorful interactive panel with quick buttons which gives you the ability to switch time frames and symbols simultaneously with one click.
  • Ability to set the number of visible symbols (vertically) and the number of time frames (horizontally).
  • The indicator is automatically synchronized with the Market Watch window in Meta Trader 4 where you can set custom lists with symbols.
  • Wide range of settings for visual customization including panel size, font size and colors.
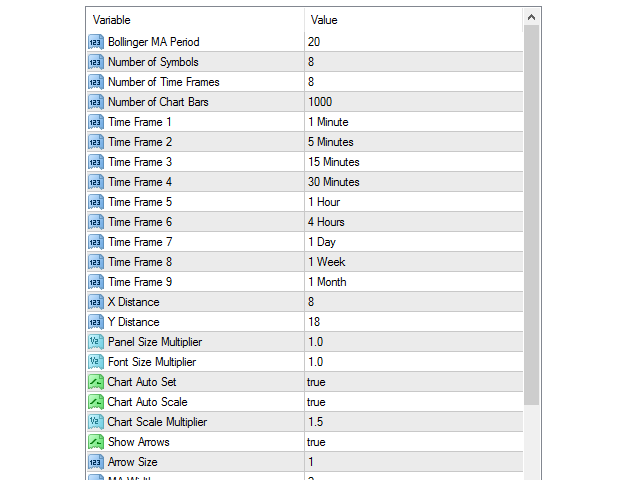

Settings

  • Bollinger MA Period - number of bars for the calculation of the moving average and the standard deviation for each time frame.
  • Number of Symbols - how many symbols to display.
  • Number of Time Frames - how many timeframes to display.
  • Number of Chart Bars - how much history to show on the current chart.
  • Time Frame 1 - select timeframe.
  • Time Frame 2 - select timeframe.
  • Time Frame 3 - select timeframe.
  • Time Frame 4 - select timeframe.
  • Time Frame 5 - select timeframe.
  • Time Frame 6 - select timeframe.
  • Time Frame 7 - select timeframe.
  • Time Frame 8 - select timeframe.
  • Time Frame 9 - select timeframe.
  • X Distance - horizontal distance from the upper left corner.
  • Y Distance - vertical distance from the upper left corner.
  • Panel Size Multiplier - increase or decrease the size of the interface.
  • Font Size Multiplier - increase or decrease the size of the font.
  • Chart Auto Set - enable/disable the automatic default chart configuration.
  • Chart Auto Scale - enable/disable the automatic vertical scaling.
  • Chart Scale Multiplier - multiplier for the vertical scaling.
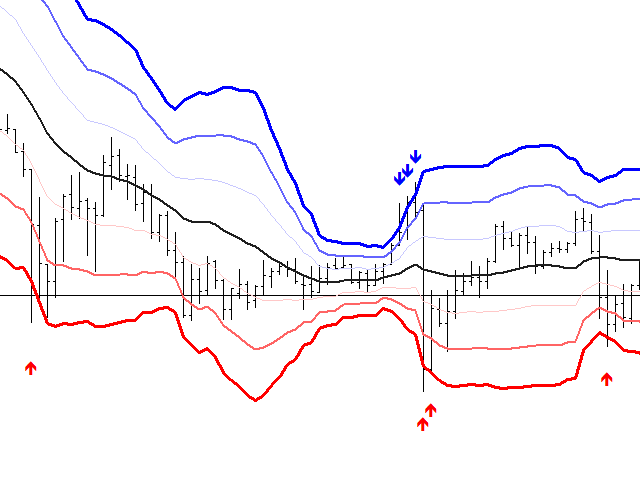
  • Show Arrows - true/false. The arrows show the bars in the history where the prices are above or below 3 standard deviations.
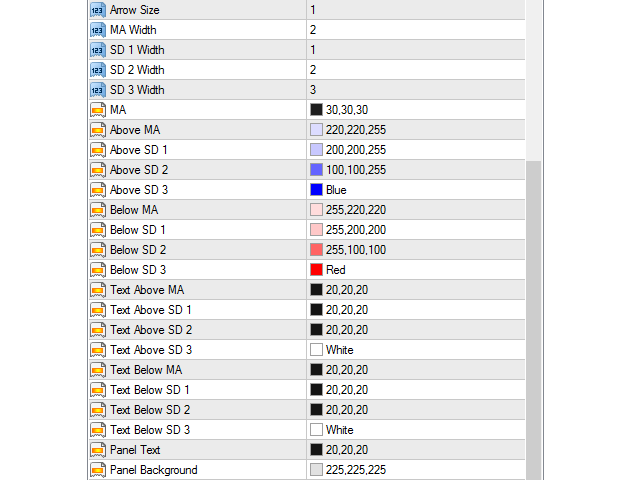
  • Arrow Size - size of the arrows.
  • MA Width - thickness of the moving average on the chart.
  • SD 1 Width - thickness of the first line. (1 standard deviation below/above the MA)
  • SD 2 Width - thickness of the second line. (2 standard deviations below/above the MA)
  • SD 3 Width - thickness of the third line. (3 standard deviations below/above the MA)
  • Color Settings.

Note! Due to technical limitations the demo works only with one symbol in the strategy tester. So there is no way to switch between symbols and time frames.

If you have some questions or if you need help, contact me via PM.

추천 제품
VR Cub
Vladimir Pastushak
VR Cub 은 고품질 진입점을 얻는 지표입니다. 이 지표는 수학적 계산을 용이하게 하고 포지션 진입점 검색을 단순화하기 위해 개발되었습니다. 지표가 작성된 거래 전략은 수년 동안 그 효율성을 입증해 왔습니다. 거래 전략의 단순성은 초보 거래자라도 성공적으로 거래할 수 있다는 큰 장점입니다. VR Cub은 포지션 개시 지점과 이익 실현 및 손절매 목표 수준을 계산하여 효율성과 사용 편의성을 크게 높입니다. 간단한 거래 규칙을 이해하려면 아래 전략을 사용한 거래 스크린샷을 살펴보세요. 설정, 세트 파일, 데모 버전, 지침, 문제 해결 등은 다음에서 얻을 수 있습니다. [블로그] 다음에서 리뷰를 읽거나 작성할 수 있습니다. [링크] 버전 [MetaTrader 5] 진입점 계산 규칙 포지션 개설 진입점을 계산하려면 VR Cub 도구를 마지막 최고점에서 마지막 최저점까지 늘려야 합니다. 첫 번째 지점이 두 번째 지점보다 빠른 경우, 거래자는 막대가 중간선 위에서 마감될 때까지 기다립
Trend Ray
Andriy Sydoruk
The indicator shows the potential trend direction by cyclical-wave dependence. Thus, all the rays of the intersection will be optimal rays, in the direction of which the price is expected to move, taking into account the indicator period. Rays can be used as a direction for potential market movement. But we must not forget that the approach must be comprehensive, the indicator signals require additional information to enter the market.
"Adjustable Fractals" - 프랙탈 표시기의 고급 버전으로 매우 유용한 거래 도구입니다! 우리가 알고 있듯이 표준 프랙탈 mt4 표시기에는 설정이 전혀 없습니다. 이는 거래자에게 매우 불편합니다. 조정 가능한 프랙탈(Adjustable Fractals)이 해당 문제를 해결했습니다. 필요한 모든 설정이 포함되어 있습니다. 조정 가능한 표시 기간(권장 값 - 7 이상) 고점/저점과의 거리 조절 가능 프랙탈 화살표에 따라 조정 가능한 디자인 ............................................................................................................................................. // 더 훌륭한 전문가 자문 및 지표는 여기에서 확인할 수 있습니다: https://www.mql5.com/en/users/def1380/seller 본 MQL5 홈페이지에서만 제공
KDJ Index 4   交易实用必备工具指标 波浪自动计算指标,通道趋势交易 完美的趋势-波浪自动计算通道计算 , MT4版本 完美的趋势-波浪自动计算通道计算 , MT5版本 本地跟单复制交易 Easy And Fast Copy , MT4版本 Easy And Fast Copy , MT5版本 本地跟单复制交易 模拟试用 Easy And Fast Copy , MT4 模拟账号运行 Easy And Fast Copy , MT5 模拟账号运行 "Cooperative QQ:556024  "  "Cooperation wechat:556024"  "Cooperative email:556024@qq.com" 强烈推荐趋势指标, 波浪的标准自动计算   和   波浪的标准自动计算MT5版本     KDJ指标又叫 随机指标 ,是一种相当新颖、实用的技术分析指标,它起先用于期货市场的分析,后被广泛用于股市的中短期趋势分析,是期货和股票市场上最常用的技术分析工具。 随机指标KDJ一般是用于股票分析的统计体系,根据统计学原理,通过一个特定的周期(常为9日、9周等
MA Crosses PRO MT4
Volodymyr Hrybachov
5 (1)
MA CROSSES PRO MT4는 이동 평균 십자 화살표 표시기입니다. 표시기 매개변수는 직관적인 이름을 가지며 각 라인은 별도로 구성됩니다. 표시기는 화살표를 표시하고, 신호음을 울리고, 이동 단말기 및 전자 메일로 알림을 전송하여 신호를 보낼 수 있습니다. 표시기는 다시 그리지 않습니다 촛불이 닫힐 때만 신호를 보냅니다. 스캘핑에 탁월 모든 쌍 및 모든 시간대에서 작동 시간 프레임이 오래될수록 신호가 더 좋습니다. 모든 거래 전략과 애드온으로 호환됩니다. 옵션: FASTER_MA - 빠르게 움직이는 기간; FASTER_MA_METHOD - 빠르게 이동하는 평균화 방법. FASTER_MA_PRICE - 중고 가격; FASTER_MA_SHIFT - 시프트; SLOWER_MA - 느리게 움직이는 기간; SLOWER_MA_METHOD - 느린 이동 평균 방법. SLOWER_MA_PRICE - 중고 가격; SLOWER_MA_SHIFT - 시프트; ALERT - 대
Chart Patterns Detect 15 patterns (Ascending Triangle, Descending Triangle, Rising Wedge, Falling Wedge, Bullish Flag, Bearish Flag, Bullish Rectangle, Bearish Rectangle Symmetrical triangle, Head and Shoulders, Inverted Head and Shoulders, Triple top, Triple Bottom, Double Top, Double Bottom) Use historical data to calculate the probability of each pattern to succeed (possibility to filter notification according to the chance of success) gives graphic indication about the invalidation level and
Infinity Trend Pro
Yaroslav Varankin
1 (1)
This is a trend indicator without redrawing Developed instead of the binary options strategy (by the color of the Martingale candlestick) Also works well in forex trading When to open trades (binary options) A signal will appear in the place with a candle signaling the current candle It is recommended to open a deal for one candle of the current timeframe M1 and M5 When a blue dot appears, open a deal up When a red dot appears, open a trade down. How to open trades on Forex. When a signal is rec
Owl smart levels
Sergey Ermolov
4.58 (55)
MT5 버전  |   FAQ Owl Smart Levels Indicator 는   Bill Williams 의 고급 프랙탈, 시장의 올바른 파동 구조를 구축하는 Valable ZigZag, 정확한 진입 수준을 표시하는 피보나치 수준과 같은 인기 있는 시장 분석 도구를 포함하는 하나의 지표 내에서 완전한 거래 시스템입니다. 시장과 이익을 취하는 장소로. 전략에 대한 자세한 설명 표시기 작업에 대한 지침 고문-거래 올빼미 도우미의 조수 개인 사용자 채팅 ->구입 후 나에게 쓰기,나는 개인 채팅에 당신을 추가하고 거기에 모든 보너스를 다운로드 할 수 있습니다 힘은 단순함에 있습니다! Owl Smart Levels   거래 시스템은 사용하기 매우 쉽기 때문에 전문가와 이제 막 시장을 연구하고 스스로 거래 전략을 선택하기 시작한 사람들 모두에게 적합합니다. 전략 및 지표에는 눈에 보이지 않는 비밀 공식 및 계산 방법이 없으며 모든 전략 지표는 공개되어 있습니다. Owl Smart Lev
Nice Trade Point
Muhammed Emin Ugur
This    Nice Trade Point     indicator is designed for signal trading. This indicator generates trend signals. It uses many algorithms and indicators to generate this signal. It tries to generate a signal from the points with the highest trend potential. This indicator is a complete trading product. This indicator does not need any additional indicators. The indicator certainly does not repaint. The point at which the signal is given does not change.     Features and Suggestions Time
Signal From Level
Yaroslav Varankin
Binary Options Support Resistance Indicator This indicator is designed for binary options trading and effectively shows retracements from support and resistance levels. Signals appear on the current candle. A red arrow pointing downwards indicates a potential selling opportunity, while a blue arrow pointing upwards suggests buying opportunities. All that needs adjustment is the color of the signal arrows. It is recommended to use it on the M1-M5 timeframes as signals are frequent on these timef
ZhiBiCCI MT4
Qiuyang Zheng
5 (1)
[ZhiBiCCI] indicators are suitable for all cycle use, and are also suitable for all market varieties. [ZhiBiCCI] Green solid line is a reversal of bullish divergence. The green dotted line is a classic bullish divergence. [ZhiBiCCI] The solid line to the red is a reverse bearish divergence. The red dotted line is a classical bearish divergence. [ZhiBiCCI] can be set in the parameters (Alert, Send mail, Send notification), set to (true) to send instant signals to the alarm window, email, in
승률 계산 시스템이 적용된 지표 [인디케이터 기능] 이 지표는 트레이더가 기호 신호를 통해 정기적인 기술 분석을 직관적이고 명확하게 확인할 수 있도록 합니다. 또한 승률을 확인하여 현재 파라미터가 적절한지 확인할 수 있으며 승률이 낮을 때 신호를 생성하지 않는 자동 승률 결정 시스템이 포함되어 있습니다. 이는 불필요한 응모를 줄이고 승률이 높은 기간에만 응모할 수 있도록 합니다. [중요 설명] ・다시 칠하지 않습니다. 1분에서 매주까지의 시간대에 사용할 수 있습니다. ・통화 제한이 없습니다. 모든 통화 쌍에 사용할 수 있습니다. ・승률을 계산할 수 있습니다. ・미리 정의된 승률 이상이 충족될 때만 신호가 생성됩니다. ・부하 경감 대책으로 설계! 9개의 통화쌍으로 장기간 사용 및 동시 사용에 적합합니다. ・잘 알려진 지표로 신호를 관찰하면서 공부할 수 있습니다. ・모든 문제를 해결하기 위해 디버거에 의해 디버깅 및 검증되었습니다. [하이킨 아시 애로우 시그널 설명] Hei
Based on MACD indicator waves with standard parameters Applies Fibonacci levels to the last two MACD waves, positive and negative respectively, if at the moment the MACD indicator runs out of negative Wave - the color is green, if at the moment the MACD indicator runs out of positive Wave - the color is red. The Wave termination criterion is two ticks with a different MACD sign. Applies trend lines on the last four MACD Waves. Works well with the expert Figures MACD   https://www.mql5.com/ru/mar
FX Flow
Eva Stella Conti
FX Flow   indicator can be used as an anticipator of the next trend, preferably confirmed by Price Action or another oscillator (RSi, Stochastic ..). It takes the money flows of the major currencies USD EUR GBP AUD NZD CAD CHF JPY into account, and processes them. Excellent tool for indices, but also for correlations between currencies. Works on each timeframes.  Blue line: Bull market Yellow line: Bear market Note : if the indicator opens the window, but does not draw lines, load the histo
Sto Signal AM
Andriy Matviyevs'kyy
5 (1)
This indicator displays Stochastic osc signals on the price chart and allows the user to receive notifications of such signals. The Stochastic indicator is a classic and proven indicator of the technical analysis of the markets. Despite its age, it is still relevant today. Depending on the settings, the indicator allows you to work effectively on various TFs and any markets. Signals are given on fully formed bars and are not redrawn. Custom Parameters: Stochastic_Price (0-1) - The applied pric
FREE
Divergent Accuracy
Yaroslav Varankin
The Divergent Accuracy indicator is designed to identify discrepancies on the price chart of a currency pair. The Divergent Accuracy indicator recognizes bullish and bearish divergences, and can also output a signal that a divergence has been detected... In addition to identifying divergences, the indicator works with overbought and oversold levels, and also shows arrows to enter the market...
Trend PA
Mikhail Nazarenko
5 (3)
The Trend PA indicator uses   Price Action   and its own filtering algorithm to determine the trend. This approach helps to accurately determine entry points and the current trend on any timeframe. The indicator uses its own algorithm for analyzing price changes and Price Action. Which gives you the advantage of recognizing, without delay, a new nascent trend with fewer false positives. Trend filtering conditions can be selected in the settings individually for your trading style. The indicator
The indicator detects and displays 3 Drives harmonic pattern (see the screenshot). The pattern is plotted by the extreme values of the ZigZag indicator (included in the resources, no need to install). After detecting the pattern, the indicator notifies of that by a pop-up window, a mobile notification and an email. The indicator highlights the process of the pattern formation and not just the complete pattern. In the former case, it is displayed in the contour triangles. After the pattern is com
DYJ Alligator SignalSource   is based on Alligator   indicator. It can be used for any currency pair and timeframe. The blue line (Alligator's Jaw) is the Balance Line for the timeframe that was used to build the chart (13-period Smoothed Moving Average, moved into the future by 8 bars); Red Line (Alligator's Teeth) is the Balance Line for the value timeframe of one level lower (8-period Smoothed Moving Average, moved by 5 bars into the future); Green Line (Alligator's Lips) is the Balance Line
The indicator detects and displays Shark harmonic pattern (see the screenshot). The pattern is plotted by the extreme values of the ZigZag indicator (included in the resources, no need to install). After detecting the pattern, the indicator notifies of that by a pop-up window, a mobile notification and an email. The indicator highlights the process of the pattern formation and not just the complete pattern. In the former case, it is displayed in the contour triangles. After the pattern is comple
Trendiness Index
Libertas LLC
5 (3)
"The trend is your friend" is one of the best known sayings in investing, because capturing large trendy price movements can be extremely profitable. However, trading with the trend is often easier said than done, because many indicators are based on price reversals not trends. These aren't very effective at identifying trendy periods, or predicting whether trends will continue. We developed the Trendiness Index to help address this problem by indicating the strength and direction of price trend
TrendInChannel
Andriy Sydoruk
This indicator is the undisputed leader among the indicators. And for this statement there is a good reason. The indicator builds a very high quality channel in which it generates signals to enter! What is the ideal strategy for the trader, since the trader always hesitates when choosing a strategy for the job. That is, this indicator will allow you to solve the dilemma of choosing a job by trend or to the channel, since it combines these two basic concepts. Working with the indicator is very
Trend Scanner
Vladimir Kalendzhyan
4.38 (8)
By purchasing this indicator, you have the right to receive a free copy of one of   my other indicator's or advisor’s!  (All future updates are included. No limits) . To get it , please contact me by  mql5 message ! The Trend Scanner trend line indicator displays the trend direction and its changes. The indicator works on all currency pairs and  timeframes. The indicator simultaneously displays multiple readings on the price chart: the support and resistance lines of the currency pair, the exist
Renko, Heiken Ashi, Ticks Bar, Range Bar.    Easy switching, easy setup, all in one window.        Place the Custom Chart indicator and view Renko, Heiken Ashi, Tick bar, Range bar charts in real time at real chart.    Position the offline chart window so that the indicator control panel is visible.    Switch the chart mode by click of a button.    Connect to the output chart any indicator, expert advisor without any restrictions.    No, it doesn't work in the tester.    Yes, you can use an
Reversal Prices
Oleksii Ferbei
Reversal Prices is an indicator that has a fairly powerful and effective mechanism for adapting to changing market conditions. Reversal Prices - the new word in trend detection! With the development of information technology and a large number of participants, financial markets are less and less amenable to analysis by outdated indicators. Conventional technical analysis tools, such as the Moving Average or Stochastic, in their pure form are not able to determine the direction of the trend or it
EA Black Box
Vitali Vasilenka
EA 블랙박스 전문가 자문은 이미 시대를 앞서 있습니다! - 주요 고조파 패턴을 포함하는 거래 알고리즘 고조파 패턴이 있습니다: 강세_5-0_패턴 약세_5-0_패턴 Bearish_Three_Drives Bullish_Three_Drives 우리 커뮤니티의 텔레그램 채널 - https://t.me/EAQuantumLab 공식 커뮤니티 사이트 - https://eaQuantumlab.com 실제 신호는 여기에서 확인할 수 있습니다: https://www.mql5.com/en/users/vitalvasa/seller 거래를 위한 최소 입금액 1000$ 최소 스프레드가 있는 계좌를 사용하세요 M15-M30-H1-H4 거래에 가장 적합한 기간 최고의 거래 쌍: XAUUSD. EURUSD. GBPUSD. USDCAD.NZDUSD. GBPJPY. CADJPY. EURJPY 중요한 정보! 지침에 따라 고문을 설정하십시오 !!! 중요한 정보! 처음 2주 동안은 데모 계좌 또는
MT4에 대한 외환 지표 "지원 저항 수준" 지표 "지원 저항 수준"은 거래에 매우 유용한 보조 지표입니다. '지지'와 '저항'은 차트에서 가격으로 존중되는 중요한 영역입니다. 지지 수준은 가격이 정기적으로 하락을 멈추고 다시 반등하는 수준입니다. 저항 수준은 일반적으로 가격이 상승을 멈추고 다시 하락하는 지점입니다. 표시기 "지원 저항 수준"은 최근 수준을 보여줍니다. 저항 수준 - 빨간색 선. 지원 수준 - 파란색 선 계산에 사용되는 막대 수, 선 유형 및 색상은 설정에서 조정할 수 있습니다. 지표 "지원 저항 수준"은 가격 조치 패턴을 통해 이익실현 목표, 가격 반전 및 재테스트를 계획하는 데 유용합니다. // 더 훌륭한 전문가 자문 및 지표는 여기에서 확인할 수 있습니다: https://www.mql5.com/en/users/def1380/seller MQL5 홈페이지에서만 제공되는 오리지널 제품입니다.
Fractal Zig Zag
Mikhail Nazarenko
5 (1)
A   professional version of the ZigZag indicator for visualizing the structure of price movements by fractals. Fractal ZigZag fixes the flaws of the standard version of the ZigZag indicator MT4. It uses Price action and a unique filtering algorithm to determine fractals. Suitable for all types of trading. Ideal for trading according to the WM pattern "Sniper" strategy !!! Features Marks the place of price reversal during the formation of a new fractal with specified parameters. Suitable for
PABT Pattern Indicator - it's classical system one of the signal patterns. Indicator logic - the Hi & Lo of the bar is fully within the range of the preceding bar, look to trade them as pullback in trend. In the way if indicator found PABT pattern it's drawing two lines and arrow what showing trend way.  - First line - it's entry point and drawing at: 1. On the high of signal bar or on middle of the signal bar (depending from indicator mode) for buy; 2. On the low of signal bar or on middle of t
Combined MT4
Ahmed Alaaeldin Abdulrahman Ahmed Elherzawi
Welcome to Investment Castle products   This product is exclusively available in the MQL5 market and is not available and will not be available anywehere else. The Combined indicator is a multi-time frame indicator and it is built using 3 indicators: Bands indicator which draws the support and resistance key levels   using up to 5 different time frames Patterns indicator which draws the chart patterns using up to 6 different time frames Spots indicator which shows the common candlestick pattern
이 제품의 구매자들이 또한 구매함
Gann Made Easy
Oleg Rodin
4.88 (100)
Gann Made Easy 는 mr.의 이론을 사용하여 최고의 거래 원칙을 기반으로 하는 전문적이고 사용하기 쉬운 Forex 거래 시스템입니다. W.D. 간. 이 표시기는 Stop Loss 및 Take Profit Levels를 포함하여 정확한 BUY 및 SELL 신호를 제공합니다. PUSH 알림을 사용하여 이동 중에도 거래할 수 있습니다. 구매 후 연락주세요! 내 거래 팁과 훌륭한 보너스 지표를 무료로 공유하겠습니다! 아마도 Gann 거래 방법에 대해 이미 여러 번 들었을 것입니다. 일반적으로 Gann의 이론은 초보자 거래자뿐만 아니라 이미 거래 경험이 있는 사람들에게도 매우 복잡한 것입니다. Gann의 거래 방식은 이론적으로 적용하기 쉽지 않기 때문입니다. 나는 그 지식을 연마하고 Forex 지표에 최고의 원칙을 적용하기 위해 몇 년을 보냈습니다. 표시기는 적용하기가 매우 쉽습니다. 차트에 첨부하고 간단한 거래 권장 사항을 따르기만 하면 됩니다. 지표는 지속적으로 시장 분석 작업
Trend Punch
Mohamed Hassan
4.91 (23)
This indicator is unstoppable when combined with our other indicator called  Support & Resistance . After purchase, send us a message and you will get it   for  FREE as a BONUS! Introducing Trend Punch , the revolutionary forex trend indicator that will transform the way you trade! Trend Punch is uniquely designed to provide precise buy and sell arrows during strong market trends, making your trading decisions clearer and more confident. Whether you're trading major currency pairs or exotic sym
Gold Stuff
Vasiliy Strukov
4.9 (270)
Gold Stuff는 금을 위해 특별히 설계된 추세 지표이며 모든 금융 상품에서도 사용할 수 있습니다. 표시기가 다시 그려지지 않고 지연되지 않습니다. 권장 기간 H1. 표시기에서 완전 자동 Expert Advisor EA Gold Stuff를 작동합니다. 내 프로필에서 찾을 수 있습니다. 설정 및 개인 보너스를 받으려면 구매 후 즉시 저에게 연락하십시오!   강력한 지원 및 트렌드 스캐너 표시기의 무료 사본을 받으실 수 있습니다. 메시지를 보내주세요. 나!   설정 화살표 그리기 - 켜기 끄기. 차트에 화살표 그리기. 경고 - 가청 경고를 끕니다. 이메일 알림 - 켜기 끄기. 이메일 알림. Puch-notification - 켜기 끄기. 푸시 알림. 다음으로 색 영역을 조정합니다. Gold Stuff는 금을 위해 특별히 설계된 추세 지표이며 모든 금융 상품에서도 사용할 수 있습니다. 표시기가 다시 그려지지 않고 지연되지 않습니다. 권장 기간 H1. 표시기에서 완
FX Power MT4 NG
Daniel Stein
5 (13)
모닝 브리핑 여기 mql5 와 텔레그램에서 FX Power MT4 NG 는 오랫동안 인기 있는 통화 강도 측정기인 FX Power의 차세대 버전입니다. 이 차세대 강도 측정기는 무엇을 제공합니까? 기존 FX Power에서 좋아했던 모든 것 PLUS GOLD/XAU 강도 분석 더욱 정밀한 계산 결과 개별 구성 가능한 분석 기간 더 나은 성능을 위한 사용자 정의 가능한 계산 한도 특별 멀티더 많은 것을보고 싶은 사람들을위한 특별한 다중 인스턴스 설정 모든 차트에서 좋아하는 색상을위한 끝없는 그래픽 설정 수많은 알림 옵션, 중요한 것을 다시는 놓치지 않도록 Windows 11 및 macOS 스타일의 둥근 모서리가 있는 새로운 디자인 마법처럼 움직이는 인디케이터 패널 FX 파워 키 특징 모든 주요 통화의 완전한 강세 이력 모든 시간대에 걸친 통화 강세 이력 모든 브로커 및 차트에서 고유 계산 결과 100% 신뢰할 수있는 실시간100 % 신뢰할 수있는 실시간 계산-> 다시 칠하지 않음
Apollo Pips PLUS SP
Oleg Rodin
5 (3)
제품을 구매하기 전에 아래 정보를 읽어보세요! Apollo Pips PLUS SP는 독특한 제품입니다! 모든 거래 지표에 액세스할 수 있는 새로운 "APOLLO PIPS" 지표와 "슈퍼 팩" 보너스를 받고 싶은 분들을 위한 것입니다! Apollo Pips PLUS SP 제품을 구매하면 실제로 Apollo Pips 표시기의 완전히 새로운 버전을 구매하게 됩니다. 이 버전의 지표에는 개선된 알고리즘과 사용하기 쉬운 매개변수가 있어 모든 시장 및 거래 스타일에서 지표를 사용할 수 있는 기회를 제공합니다. 이 제품의 구매자는 슈퍼 보너스로 다른 모든 표시기에 무료로 액세스할 수 있습니다! 내 모든 거래 도구에 액세스하고 싶었다면 이 제품이 당신에게 딱 맞습니다! :) 하지만 이것이 전부는 아닙니다! :) 이 제품의 모든 구매자는 또한 내 새로운 지표를 무료로 받을 자격이 있습니다! :) 새로운 거래 지표를 사용할 수 있게 되었는데, 귀하는 저의 특별한 "SUPER PACK" 평생 보너스
TPSproTREND PrO
Roman Podpora
4.79 (19)
TPSpro TREND PRO는   시장을 자동으로 분석하여 추세와 각 변화에 대한 정보를 제공할 뿐만 아니라 다시 그리지 않고도 거래에 진입할 수 있는 신호를 제공하는 추세 지표입니다! 지표는 각 양초를 사용하여 개별적으로 분석합니다. 다른 임펄스를 언급합니다 - 업 또는 다운 임펄스. 통화, 암호화폐, 금속, 주식, 지수 거래의 정확한 진입점! 버전 MT5                   표시기에 대한 전체 설명       표시기   와 함께 사용하는 것이 좋습니다   -   RFI LEVELS 주요 기능: 렌더링 없이 정확한 입력 신호! 신호가 나타나면 관련성은 유지됩니다! 이는 신호를 제공한 후 변경하여 예금 자금 손실을 초래할 수 있는 다시 그리기 지표와의 중요한 차이점입니다. 이제 더 큰 확률과 정확도로 시장에 진입할 수 있습니다. 화살표가 나타난 후 목표에 도달(이익실현)하거나 반전 신호가 나타날 때까지 캔들을 색칠하는 기능도 있습니다. STOP LOSS / TAK
Trend Pulse
Mohamed Hassan
5 (5)
Please contact me after purchase to immediately get your PDF strategy + documentation for Trend Pulse !  Official release price of $89  (2 /50 copies left). Next price is $199 . Introducing Trend Pulse , a unique and robust indicator capable of detecting bullish, bearish, and even ranging trends! Trend Pulse uses a special algorithm to filter out market noise with real precision. If the current symbol is moving sideways, Trend Pulse will send you a ranging signal, letting you know that it'
Scalper Inside PRO
Alexey Minkov
4.75 (60)
An exclusive indicator that utilizes an innovative algorithm to swiftly and accurately determine the market trend. The indicator automatically calculates opening, closing, and profit levels, providing detailed trading statistics. With these features, you can choose the most appropriate trading instrument for the current market conditions. Additionally, you can easily integrate your own arrow indicators into Scalper Inside Pro to quickly evaluate their statistics and profitability. Scalper Inside
Atomic Analyst
Issam Kassas
5 (3)
우선적으로 언급할 점은이 거래 지표가 다시 그리지 않고 지연되지 않으며 이를 통해 수동 및 로봇 거래 모두에 이상적이라는 점입니다. 사용자 매뉴얼: 설정, 입력 및 전략. Atomic Analyst는 가격의 강도와 모멘텀을 활용하여 시장에서 더 나은 이점을 찾는 PA Price Action Indicator입니다. 고급 필터를 장착하여 잡음과 거짓 신호를 제거하고 거래 잠재력을 높이는 데 도움이 됩니다. 복잡한 지표의 다중 레이어를 사용하여 Atomic Analyst는 차트를 스캔하고 복잡한 수학적 계산을 간단한 신호와 색상으로 변환하여 초보 트레이더가 이해하고 일관된 거래 결정을 내릴 수 있도록합니다. "Atomic Analyst"는 새로운 및 경험이 풍부한 트레이더를위한 종합적인 거래 솔루션입니다. 프리미엄 지표와 최고 수준의 기능을 하나의 거래 전략에 결합하여 모든 종류의 트레이더에 대한 다재다능한 선택지가되었습니다. 인트라데이 거래 및 스캘핑 전략 : 빠르고 정확한
Trend Screener
STE S.S.COMPANY
4.82 (92)
트렌드 표시기, 트렌드 트레이딩 및 필터링을 위한 획기적인 고유 솔루션, 하나의 도구 안에 내장된 모든 중요한 트렌드 기능! Forex, 상품, 암호 화폐, 지수 및 주식과 같은 모든 기호/도구에 사용할 수 있는 100% 다시 칠하지 않는 다중 시간 프레임 및 다중 통화 표시기입니다. Trend Screener는 차트에 점이 있는 화살표 추세 신호를 제공하는 효율적인 지표 추세 추종 지표입니다. 추세 분석기 표시기에서 사용할 수 있는 기능: 1. 트렌드 스캐너. 2. 최대 이익 분석이 있는 추세선. 3. 추세 통화 강도 측정기. 4. 경고가 있는 추세 반전 점. 5. 경고가 있는 강력한 추세 점. 6. 추세 화살표 Trend Screener Indicator가 있는 일일 분석 예, 일일 신호 성능...등은 여기에서 찾을 수 있습니다.   여기를 클릭하십시오. LIMITED TIME OFFER : Trend Screener Indicator는 50 $ 및 평생 동안만 사용할 수 있
Currency Strength Wizard
Oleg Rodin
4.92 (52)
통화 강도 마법사는 성공적인 거래를 위한 올인원 솔루션을 제공하는 매우 강력한 지표입니다. 표시기는 여러 시간 프레임의 모든 통화 데이터를 사용하여 이 또는 해당 외환 쌍의 힘을 계산합니다. 이 데이터는 특정 통화의 힘을 확인하는 데 사용할 수 있는 사용하기 쉬운 통화 지수 및 통화 전력선의 형태로 표시됩니다. 필요한 것은 거래하려는 차트에 표시기를 부착하는 것뿐입니다. 표시기는 거래하는 통화의 실제 강세를 보여줍니다. 지표는 또한 추세와 거래할 때 유리하게 사용할 수 있는 구매 및 판매 거래량 압력의 극한값을 보여줍니다. 지표는 또한 피보나치에 기반한 가능한 대상을 보여줍니다. 표시기는 PUSH 알림을 포함한 모든 유형의 알림을 제공합니다. 구매 후 연락주세요. 나는 당신과 거래 팁을 공유하고 당신에게 무료로 훌륭한 보너스 지표를 줄 것입니다! 나는 당신에게 행복하고 유익한 거래를 기원합니다!
- Real price is 80$ - 40% Discount ( It is 49$ now ) Contact me for instruction, any questions! Introduction The breakout and retest strategy is traded support and resistance levels. it involves price breaking through a previous level.  The break and retest strategy is designed to help traders do two main things, the first is to avoid false breakouts. Many false breakouts start with a candlestick that breaks out of a level but ends with an immediate candlestick that brings the price back into t
현재 20% 할인 ! 초보자 또는 전문가 트레이더를 위한 최고의 솔루션! 이 대시보드 소프트웨어는 28개의 통화 쌍에서 작동합니다. 2가지 주요 지표(Advanced Currency Strength 28 및 Advanced Currency Impulse)를 기반으로 합니다. 전체 Forex 시장에 대한 훌륭한 개요를 제공합니다. 고급 통화 강도 값, 통화 이동 속도 및 모든(9) 시간대의 28 Forex 쌍에 대한 신호를 보여줍니다. 추세 및/또는 스캘핑 기회를 정확히 파악하기 위해 차트의 단일 지표를 사용하여 전체 시장을 볼 수 있을 때 거래가 어떻게 개선될지 상상해 보십시오! 잠재적인 거래를 식별하고 확인하면서 강력한 통화와 약한 통화를 더욱 쉽게 식별할 수 있도록 이 지표에 기능을 내장했습니다. 이 표시기는 통화의 강세 또는 약세가 증가 또는 감소하는지 여부와 모든 시간대에서 수행되는 방식을 그래픽으로 보여줍니다. 추가된 새로운 기능은 현재 시장 조건 변화에 적
Clear Breakout
Martin Alejandro Bamonte
5 (1)
"Breakout Buy-Sell" 지표는 다양한 시장 세션(도쿄, 런던, 뉴욕) 동안 가격 돌파를 기반으로 매수 및 매도 기회를 식별하고 강조하도록 설계되었습니다. 이 지표는 트레이더가 매수 및 매도 영역뿐만 아니라 이익 실현(TP) 및 손절매(SL) 수준을 명확하게 시각화하는 데 도움이 됩니다. 사용 전략 이 지표는 다음과 같이 사용할 수 있습니다: 초기 설정 : 시장 세션을 선택하고 GMT 오프셋을 조정합니다. 시장 시각화 : 각 세션 시작 시 그려지는 돌파 상자를 관찰합니다. 이러한 상자는 기간의 최고점과 최저점을 나타냅니다. 매수 및 매도 신호 : 상자의 최고점을 초과하는 돌파는 매수 신호로 간주됩니다. 최저점을 밑도는 돌파는 매도 신호로 간주됩니다. 위험 관리 : TP1, TP2, TP3 및 SL 수준을 사용하여 포지션을 관리합니다. TP 수준은 다양한 수익 목표를 위해 설계되었으며 SL은 불리한 움직임으로부터 보호를 보장합니다. 적용 전략 이 지표를 최대한 활용하기 위해
Advanced Currency Strength28 Indicator
Bernhard Schweigert
4.91 (667)
현재 26% 할인 초보자 또는 전문가 트레이더를 위한 최고의 솔루션! 이 지표는 우리가 독점 기능과 새로운 공식을 통합했기 때문에 독특하고 고품질이며 저렴한 거래 도구입니다. 단 하나의 차트로 28 Forex 쌍의 통화 강도를 읽을 수 있습니다! 새로운 추세 또는 스캘핑 기회의 정확한 트리거 포인트를 정확히 찾아낼 수 있기 때문에 거래가 어떻게 개선될지 상상해 보십시오. 사용 설명서: 여기를 클릭  https://www.mql5.com/en/blogs/post/697384 그것이 첫 번째, 원본입니다! 쓸모없는 지망생 클론을 사지 마십시오. 더 스페셜  강력한 통화 모멘텀을 보여주는 하위 창의 화살표 GAP가 거래를 안내합니다! 기본 또는 호가 통화가 과매도/과매도 영역(외부 시장 피보나치 수준)에 있을 때 개별 차트의 기본 창에 경고 표시가 나타납니다. 통화 강도가 외부 범위에서 떨어질 때 풀백/반전 경고. 교차 패턴의 특별 경고 추세를 빠르게 볼 수 있는
PRO Renko System
Oleg Rodin
5 (26)
PRO Renko System 은 RENKO 차트 거래를 위해 특별히 고안된 매우 정확한 거래 시스템입니다. 이것은 다양한 거래 상품에 적용될 수있는 보편적 인 시스템입니다. 체계는 효과적으로 당신에게 정확한 반전 신호에 접근을 주는 소위 시장 소음을 중화합니다. 이 표시기는 사용하기가 매우 쉽고 신호 생성을 담당하는 매개 변수가 하나만 있습니다. 당신은 쉽게 당신의 선택의 어떤 무역 계기에 공구를 적응시킬 수 있고 renko 막대기의 크기. 나는 항상 당신이 내 소프트웨어로 수익성있게 거래 할 수 있도록 추가 지원을 제공 할 준비가되어 있습니다! 나는 당신에게 행복하고 수익성있는 거래를 기원합니다! 구매 후 저에게 연락하십시오! 내 렌코 차트 생성기를 보내드립니다. 또한 내 개인 권장 사항 및 시스템의 다른 모듈을 무료로 공유 할 것입니다!
Gold Channel XAUUSD
Paulo Rocha
5 (2)
Gold Channel is a volatility-based indicator, developed with a specific timing algorithm for the XAUUSD pair, which consists of finding possible corrections in the market. This indicator shows two outer lines, an inner line (retracement line) and an arrow sign, where the theory of the channel is to help identify overbought and oversold conditions in the market. The market price will generally fall between the boundaries of the channel. If prices touch or move outside the channel it is a tra
우선적으로, 이 거래 도구는 전문적인 거래에 이상적인 비-다시 그리기 및 지연되지 않는 지표입니다.  온라인 강좌, 사용자 매뉴얼 및 데모. 스마트 가격 액션 컨셉트 인디케이터는 신규 및 경험 많은 트레이더 모두에게 매우 강력한 도구입니다. Inner Circle Trader Analysis 및 Smart Money Concepts Trading Strategies와 같은 고급 거래 아이디어를 결합하여 20가지 이상의 유용한 지표를 하나로 결합합니다. 이 인디케이터는 스마트 머니 컨셉트에 중점을 두어 대형 기관의 거래 방식을 제공하고 이동을 예측하는 데 도움을 줍니다.  특히 유동성 분석에 뛰어나 기관이 어떻게 거래하는지 이해하는 데 도움을 줍니다. 시장 트렌드를 예측하고 가격 변동을 신중하게 분석하는 데 탁월합니다. 귀하의 거래를 기관 전략에 맞추어 시장의 동향에 대해 더 정확한 예측을 할 수 있습니다. 이 인디케이터는 시장 구조를 분석하고 중요한 주문 블록을 식별하고 다양한
Advanced Currency IMPULSE with ALERT
Bernhard Schweigert
4.91 (495)
현재 31% 할인!! 초보자 또는 전문가 트레이더를 위한 최고의 솔루션! 이 지표는 우리가 독점 기능과 비밀 공식을 통합했기 때문에 독특하고 고품질이며 저렴한 거래 도구입니다. 단 하나의 차트로 28개 통화 쌍 모두에 대한 경고를 제공합니다. 새로운 추세 또는 스캘핑 기회의 정확한 트리거 포인트를 정확히 찾아낼 수 있기 때문에 거래가 어떻게 개선될지 상상해 보십시오! 새로운 기본 알고리즘을 기반으로 구축되어 잠재적인 거래를 훨씬 더 쉽게 식별하고 확인할 수 있습니다. 이는 통화의 강세 또는 약세가 가속되는지 여부를 그래픽으로 표시하고 가속 속도를 측정하기 때문입니다. 자동차의 속도계처럼 생각하면 됩니다. 가속화할 때 Forex 시장에서 동일한 일이 분명히 더 빠르게 발생합니다. 즉, 반대 방향으로 가속화되는 통화를 페어링하면 잠재적으로 수익성 있는 거래를 식별한 것입니다. 통화 모멘텀의 수직선과 화살표가 거래를 안내합니다! 역동적인 Market Fibonacci 23
NAM Order Blocks
NAM TECH GROUP, CORP.
5 (1)
MT4 Multi-timeframe Order Blocks detection indicator. Features - Fully customizable on chart control panel, provides complete interaction. - Hide and show control panel wherever you want. - Detect OBs on multiple timeframes. - Select OBs quantity to display. - Different OBs user interface. - Different filters on OBs. - OB proximity alert. - ADR High and Low lines. - Notification service (Screen alerts | Push notifications). Summary Order block is a market behavior that indicates order collection
RelicusRoad Pro
Relicus LLC
4.73 (141)
이제 $ 147 (몇 가지 업데이트 후 $ 499 증가) - 무제한 계정 (PCS 또는 MACS) RelicusRoad 사용 설명서 + 교육 비디오 + 비공개 Discord 그룹 액세스 + VIP 상태 시장을 보는 새로운 방법 RelicusRoad는 외환, 선물, 암호화폐, 주식 및 지수에 대한 세계에서 가장 강력한 거래 지표로서 거래자에게 수익성을 유지하는 데 필요한 모든 정보와 도구를 제공합니다. 우리는 초보자부터 고급까지 모든 거래자가 성공할 수 있도록 기술적 분석 및 거래 계획을 제공합니다. 미래 시장을 예측할 수 있는 충분한 정보를 제공하는 핵심 거래 지표입니다. 우리는 차트에서 말이 안 되는 여러 지표 대신 완전한 솔루션을 믿습니다. 타의 추종을 불허하는 매우 정확한 신호, 화살표 + 가격 조치 정보를 표시하는 올인원 표시기입니다. 강력한 AI를 기반으로 하는 RelicusRoad는 누락된 정보와 도구를 제공하여 교육하고 성공적인 트레이더인 트레이딩 전문
PZ Trend Trading
PZ TRADING SLU
4.8 (5)
Capture every opportunity: your go-to indicator for profitable trend trading Special Offer: Purchase now to receive free bonuses worth $159! (Read more for details) Trend Trading is an indicator designed to profit as much as possible from trends taking place in the market, by timing pullbacks and breakouts. It finds trading opportunities by analyzing what the price is doing during established trends. [ Installation Guide | Update Guide | Troubleshooting | FAQ | All Products ] Trade financial
TPSpro RFI Levels
Roman Podpora
4.83 (24)
Reversal First Impulse levels (RFI)    INSTRUCTIONS        RUS       -       ENG              R ecommended to use with an indicator   -   TPSpro  TREND PRO -  Version MT5 A key element in trading is zones or levels from which decisions to buy or sell a trading instrument are made. Despite attempts by major players to conceal their presence in the market, they inevitably leave traces. Our task was to learn how to identify these traces and interpret them correctly. Main functions: Displaying activ
Break and Retest
Mohamed Hassan
4.17 (18)
This Indicator only places quality trades when the market is really in your favor with a clear break and retest. Patience is key with this price action strategy! If you want more alert signals per day, you increase the number next to the parameter called: Support & Resistance Sensitivity.  After many months of hard work and dedication, we are extremely proud to present you our  Break and Retest price action indicator created from scratch. One of the most complex indicators that we made with ove
Order Block Hunter
Noha Mohamed Fathy Younes Badr
5 (2)
Order block hunter indicator is the best indicator for  hunt the order blocks that area where there has been a large concentration of limit orders waiting to be executed Order blocks are identified on a chart by observing previous price action and looking for areas where the price experienced significant movement or sudden changes in direction .This indicator does that for you by using very complicated codes and helps you to take the best areas To buy and sell because it make marks at the best a
Scalper Vault
Oleg Rodin
5 (29)
Scalper Vault 는 성공적인 스캘핑에 필요한 모든 것을 제공하는 전문 스캘핑 시스템입니다. 이 표시기는 외환 및 바이너리 옵션 거래자가 사용할 수 있는 완전한 거래 시스템입니다. 권장 시간 프레임은 M5입니다. 시스템은 추세 방향으로 정확한 화살표 신호를 제공합니다. 또한 상단 및 하단 신호와 Gann 시장 수준을 제공합니다.  이 시스템은 사용하기가 매우 쉽습니다. 원하는 시장 지역의 화살표만 따라가면 됩니다. 엑시트는 가격이 적정 수준에 도달하거나 시장의 고점 또는 저점 신호가 나타날 때 수행됩니다.  표시기는 PUSH 알림을 포함한 모든 유형의 경고를 제공합니다. 인디케이터 구매 후 연락주세요. 내 개인 거래 권장 사항과 훌륭한 보너스 지표를 무료로 공유합니다! 나는 당신에게 행복하고 유익한 거래를 기원합니다!
IX Power MT4
Daniel Stein
5 (6)
IX Power는 마침내 FX Power의 탁월한 정밀도를 외환이 아닌 기호에도 적용했습니다. 좋아하는 지수, 주식, 원자재, ETF, 심지어 암호화폐까지 단기, 중기, 장기 추세의 강도를 정확하게 파악할 수 있습니다. 단말기가 제공하는 모든 것을 분석할 수 있습니다. 사용해 보고 트레이딩 타이밍이 크게 향상되는 것을 경험해 보세요. IX Power 주요 특징 단말기에서 사용 가능한 모든 거래 심볼에 대해 100% 정확한 비재도장 계산 결과 제공 사전 구성 및 추가적으로 개별 구성 가능한 강도 분석 기간의 드롭다운 선택 가능 이메일, 메시지, 모바일 알림을 통한 다양한 알림 옵션 제공 EA 요청을 위한 액세스 가능한 버퍼 더 나은 성능을 위한 사용자 지정 가능한 계산 한도 더 많은 것을 보고 싶은 사용자를 위한 특별 다중 인스턴스 설정 모든 차트에서 좋아하는 색상을 위한 무한한 그래픽 설정 가능 Windows 11 및 macOS 스타일의 둥근 모서리를 가
M1 Arrow
Oleg Rodin
4.73 (15)
시장의 두 가지 기본 원칙에 기반한 일중 전략. 알고리즘은 추가 필터를 사용하여 거래량 및 가격 파동 분석을 기반으로 합니다. 지표의 지능형 알고리즘은 두 가지 시장 요인이 하나로 결합될 때만 신호를 제공합니다. 지표는 더 높은 시간 프레임의 데이터를 사용하여 M1 차트에서 특정 범위의 파도를 계산합니다. 그리고 파동을 확인하기 위해 지표는 볼륨 분석을 사용합니다. 이 표시기는 준비된 거래 시스템입니다. 트레이더가 필요로 하는 모든 것은 신호를 따르는 것입니다. 또한 지표는 자신의 거래 시스템의 기초가 될 수 있습니다. 거래는 분 차트에서만 수행됩니다. 지표가 MTF 원리를 사용한다는 사실에도 불구하고 지표 알고리즘은 가능한 한 안정적입니다. 구매 후 반드시 저에게 편지를 보내주세요! 내 거래 설정 및 권장 사항을 공유하겠습니다!
Backtest and Read Overview before purchase. Chart patterns have been a topic of debate among traders; some believe they are reliable signalers, while others do not. Our Chart Patterns All-in-One indicator displays various chart patterns to help you test these theories for yourself. The profitability of these patterns is not a reflection of the indicator's effectiveness but rather an evaluation of the patterns themselves. The Chart Patterns All-in-One indicator is an excellent tool for visualizin
Advanced Supply Demand
Bernhard Schweigert
4.9 (314)
현재 33% 할인! 초보자나 전문 트레이더를 위한 최고의 솔루션! 이 보조지표는 우리가 다수의 독창적 기능과 새로운 공식을 통합한 독특하고 고품질이며 저렴한 거래 도구입니다. 이 업데이트를 통해 이중 시간대를 표시할 수 있습니다. 더 높은 TF를 표시할 수 있을 뿐만 아니라 차트 TF와 더 높은 TF 모두를 표시할 수 있습니다: 중첩 영역 표시. 모든 Supply Demand 트레이더들이 좋아할 것입니다. :) 중요한 정보 공개 Advanced Supply Demand의 잠재력을 극대화하려면 다음을 방문하십시오. https://www.mql5.com/ko/blogs/post/720245   진입 또는 목표의 명확한 트리거 포인트를 정확히 찾아냄으로 해서 거래가 어떻게 개선될지 상상해 보십시오. 새로운 알고리즘을 기반으로 매수자와 매도자 간의 잠재적인 불균형을 훨씬 더 쉽게 분간할 수 있습니다. 왜냐하면 가장 강한 공급영역과 가장 강한 수요 영역과 과거에 어떻게 진행 되었는지를(이
제작자의 제품 더 보기
FX28 Trader
Tsvetan Tsvetanov
5 (1)
FX28 Trader Dashboard 소개 - 귀하의 궁극적인 트레이드 매니저 FX28 Trader Dashboard는 외환 거래를 새로운 차원으로 끌어올릴 수 있는 포괄적이고 직관적인 트레이드 매니저로 귀하의 거래 경험의 전체 잠재력을 발휘합니다. 귀하가 경험이 풍부한 트레이더이든, 금융 여정을 시작한 지 얼마 안 된 초보자이든, 이 강력한 도구는 귀하의 거래 활동을 효율적으로 정리하고 의사 결정 과정을 향상시키기 위해 개발되었습니다. 주요 특징: 사용자 친화적 인터페이스: FX28 Trader Dashboard는 모든 수준의 트레이더에게 적합한 사용자 친화적 인터페이스를 자랑합니다. 다양한 기능과 도구를 쉽게 탐색하여 몇 번의 클릭으로 거래를 완전히 통제할 수 있습니다. 실시간 시장 데이터: 실시간 시장 데이터 피드를 통해 통화 쌍, 트렌드 및 시장 변동에 대한 최신 정보를 얻어 자신감 있게 거래를 실행하세요. 고급 트레이드 분석: FX28 Trader Dashboard를 사
DFGX Dashboard
Tsvetan Tsvetanov
4.33 (3)
Take your trading to the next level with DFGX - our second generation Dynamic Fibonacci Grid. This new, powerful and easy to use application is specially designed and optimized for contrarian intraday trading, scalping and news trading on the Forex market. This system is the ideal solution for active professional traders and scalpers who are looking for innovative ways to optimize their strategy. The system also provides excellent opportunity for new traders who want to learn to trade in a syste
SDX Chart
Tsvetan Tsvetanov
4.5 (2)
The SDX Chart is a free additional indicator which can be used in combination with SDX Dashboard . Features Ability to review the history of each symbol and time frame. Ability to change symbols and time frames with one click. Works perfectly in combination with SDX Dashboard and helps you to understand the system better. Settings MA Period - number of periods for the calculation of the moving average and the standard deviation. Number of Bars - how far back to draw the indicator. Buttons Siz
FREE
Custom Pivots MT5
Tsvetan Tsvetanov
5 (1)
Pivots Points are significant levels traders can use to determine directional movement, support and resistance. Pivot Points use the prior period's high, low and close to formulate future support and resistance. In this regard, Pivot Points are predictive and leading indicators. Pivot Points were originally used by floor traders to set key levels. Floor traders are the original day traders. They deal in a very fast moving environment with a short-term focus. At the beginning of the trading day,
The Dynamic Fibonacci Grid Dashboard ( DFG-360 ) is a multi functional trading app designed for work primarily in the Forex market. The app combines several modules and tools into one complete trading system. The unique interface of the app is optimized for active day trading, scalping, news trading, short term trend following as well as counter trend and grid trading. Main features Advanced Multi Time Frame and Multi Market analysis. Quick and efficient position management. Semi-Automated tra
Custom Pivots
Tsvetan Tsvetanov
4.2 (5)
Pivots Points are significant levels traders can use to determine directional movement, support and resistance. Pivot Points use the prior period's high, low and close to formulate future support and resistance. In this regard, Pivot Points are predictive and leading indicators. Pivot Points were originally used by floor traders to set key levels. Floor traders are the original day traders. They deal in a very fast moving environment with a short-term focus. At the beginning of the trading day,
Custom Market Watch
Tsvetan Tsvetanov
3.33 (3)
The Custom Market Watch ( CMW ) is a professional grade trading application which allows you to operate effortlessly with large number of symbols and multiple open positions simultaneously from one chart. The Custom Market Watch shows the most essential daily technical information for each symbol in combination with very simple and easy to use trading interface where you can monitor the net exposure for each symbol and you can open and close positions with one click. The app is automatically syn
Interactive RSI Matrix
Tsvetan Tsvetanov
4.89 (9)
This indicator shows the current RSI values for multiple symbols and multiple timeframes and allows you to switch between timeframes and symbols with one click directly from the matrix. With this indicator, you can analyze large number of symbols across multiple timeframes and detect the strongest trends in just a few seconds. Features Shows RSI values for multiple symbols and timeframes simultaneously. Colored cells with progressive color intensity depending on the RSI values. Ability to chan
This indicator is using the Central Limit Theorem in combination with historical volatility and Fibonacci ratios in order to create unique type of chart tool called Projected Volatility Distribution. This tool allows you to perform highly accurate intraday technical analysis where in a split second you can detect overbought and oversold conditions as well as strong trends. In addition you have at your disposal multi-functional panel which shows signals in real time and gives you the ability to o
SDX Dashboard
Tsvetan Tsvetanov
SDX is our latest and most advanced dashboard for manual trading. The app is based on our proven grid platform and offers unique trading opportunities for both experienced and new traders. This unique combination of innovative tools is designed to simplify the trading process and to give you real advantage. The system is ideal for short term trend following, counter-trend trading and scalping on the Forex market. Main Features Ability to work simultaneously with 10 pairs from one screen. Abili
Pivot Points Pro
Tsvetan Tsvetanov
This indicator is based on the classic Pivot Points concept combined with additional optimizations and advanced features.  The levels of support and resistance are calculated by taking into account the average historical volatility.  The added multi-symbol scanner allows you to detect the best conditions and trade setups.  You can see in real time the current situation for all of your favorite symbols and you can switch the chart to any symbol with one click. The build in alert system allows you
Currency Strength 28 Pro
Tsvetan Tsvetanov
4.5 (2)
This indicator allows you to analyze the hidden trends and correlations between the 8 most traded currencies via unique strength meter which creates multiple charts in a single window based on the price action of each currency in relation to all other currencies. The indicator also includes interactive panel where you can see the trends for all 28 pairs as well as the distance to the highest and the lowest price for the selected period. With this panel you can switch between currency pairs with
Interactive RSI Matrix MT5
Tsvetan Tsvetanov
5 (1)
This indicator shows the current RSI values for multiple symbols and multiple timeframes and allows you to switch between timeframes and symbols with one click directly from the matrix. With this indicator, you can analyze large number of symbols across multiple timeframes and detect the strongest trends in just a few seconds. Features Shows RSI values for multiple symbols and timeframes simultaneously. Colored cells with progressive color intensity depending on the RSI values. Ability to chan
FX28 Trader MT5
Tsvetan Tsvetanov
3 (1)
FX28 Trader Dashboard 소개 - 귀하의 궁극적인 트레이드 매니저 FX28 Trader Dashboard는 외환 거래를 새로운 차원으로 끌어올릴 수 있는 포괄적이고 직관적인 트레이드 매니저로 귀하의 거래 경험의 전체 잠재력을 발휘합니다. 귀하가 경험이 풍부한 트레이더이든, 금융 여정을 시작한 지 얼마 안 된 초보자이든, 이 강력한 도구는 귀하의 거래 활동을 효율적으로 정리하고 의사 결정 과정을 향상시키기 위해 개발되었습니다. 주요 특징: 사용자 친화적 인터페이스: FX28 Trader Dashboard는 모든 수준의 트레이더에게 적합한 사용자 친화적 인터페이스를 자랑합니다. 다양한 기능과 도구를 쉽게 탐색하여 몇 번의 클릭으로 거래를 완전히 통제할 수 있습니다. 실시간 시장 데이터: 실시간 시장 데이터 피드를 통해 통화 쌍, 트렌드 및 시장 변동에 대한 최신 정보를 얻어 자신감 있게 거래를 실행하세요. 고급 트레이드 분석: FX28 Trader Dashboard를 사
필터:
Anpex
378
Anpex 2021.01.17 01:27 
 

Ottimo scanner con valori corretti per l'uso delle bande di Bollinger. Bravo

viamal777
378
viamal777 2019.02.07 11:45 
 

I think the arrows redraw :(

리뷰 답변