SSACD Forecast Limited Edition
- Indicateurs
- Roman Korotchenko
- Version: 2.55
- Mise à jour: 25 novembre 2021
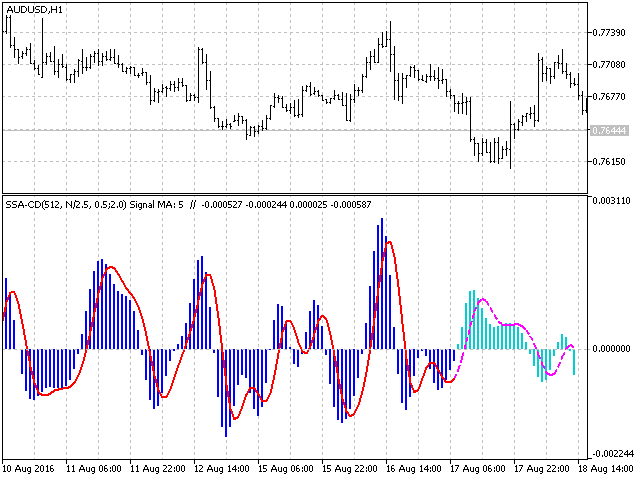
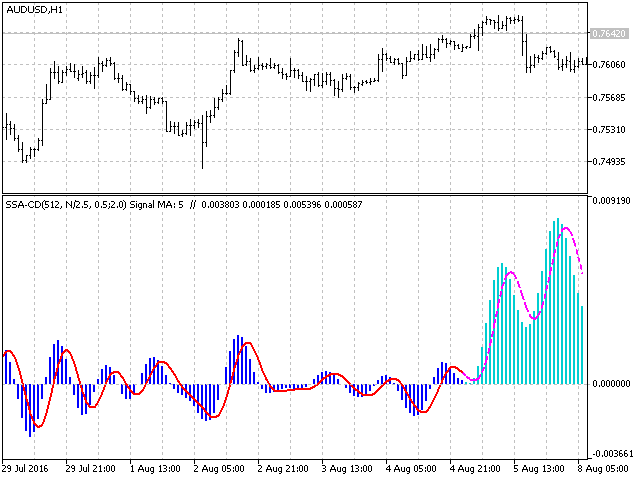
SSACD - Singular Spectrum Average Convergence/Divergence
This is an analogue of the MACD indicator based on the Caterpillar-SSA (Singular Spectrum Analysis) method.
Limited version of the SSACD Forecast indicator. Limitations include the set of parameters and their range.
Specificity of the method
The Caterpillar-SSA is an effective method to handle non-stationary time series with unknown internal structure. The method allows to find the previously unknown periodicities of the series and make forecasts based on the found regularities, which include trends and oscillations of different scales.
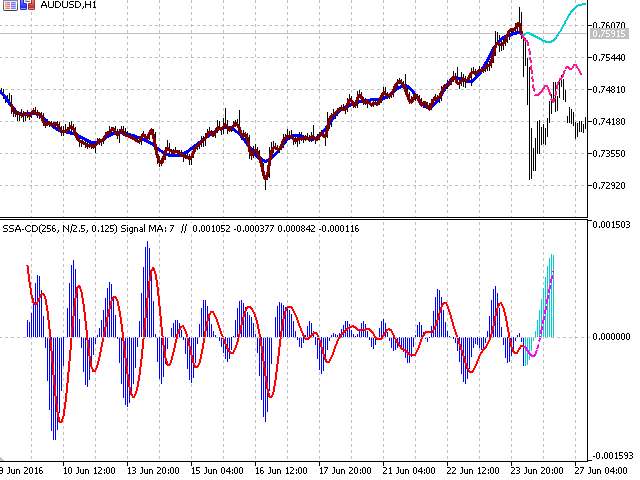
Unlike the MACD which uses moving averages, the processing results of the SSA have no time delay relative to the original series. Accordingly, the indicator does not have such a typical flaw like delay and reflects the variability in the behavior of the price series with more precision and synchronism. The constructed forecast for extracting the "fast" and "slow" price oscillations considers the cumulative detected factors of different scales, which form a "wave" behavior of the data series and can be used for reducing the risks in the strategy.
The typical behavior, signals and interpretation of indicator are similar to those of the linear MACD.
The purpose of the parameters
- N: Data fragment — length of the analyzed price series.
- FastTrend High frequency limit— filtering parameter for extracting the fast oscillating equivalent of the "average".
- SlowTrend High frequency limit— filtering parameter for extracting the smoothly oscillating equivalent of the "average".
- Signal SMA period — smoothing period of the difference between the fast and slow moving averages
- Recalculate period — indicator recalculation interval (с)
- BackwardShift — backward shift of analyzed fragment in history. For construction of the model and forecast according to the known data.
Explanation of the parameters set
High frequency limit limits the contribution of the high-frequency noise to the total dispersion of the price series. For the fast oscillating average it is equal to 0.5 - 1.5, for the slow it is 1.5 - 4. The value depends on the fragment length. All oscillators with contribution less or equal to this level will be filtered out.
BacwardShift is designed for shifting the calculation along the data series in order to compare the forecast with the known prices and to select the indicator parameters.
P.S. Visualization of individual trends is available with the help of the SSA Trend Predictor indicator.









Relativ ungenau.