Smart Candle
- Experts
- Wanchai Phonphromchot
- Version: 1.40
- Mise à jour: 20 avril 2025
- Activations: 5
Introduction
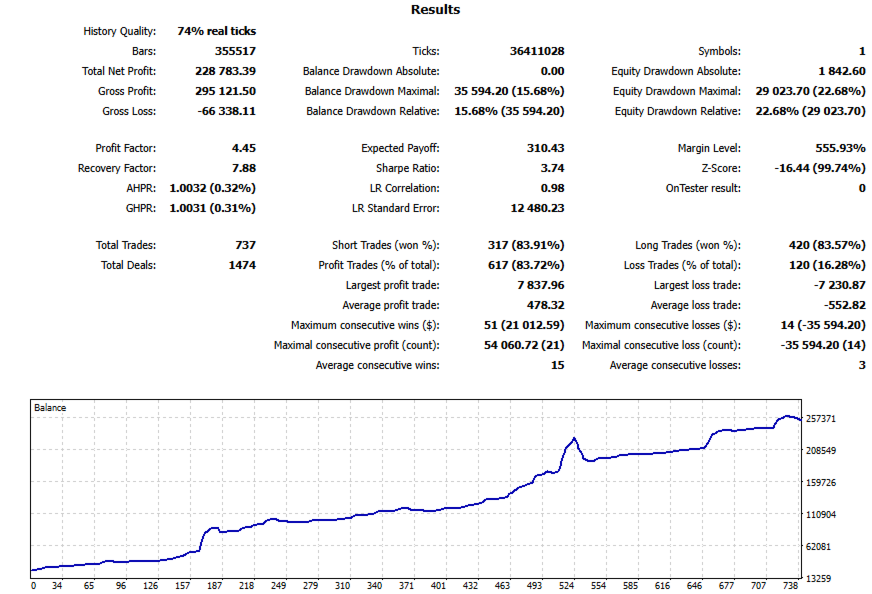
This EA is designed to survive the one-year testing period with a low drawdown and a high Sharpe ratio. The calculation concepts are new, but they are easily understood. Here are the best results.
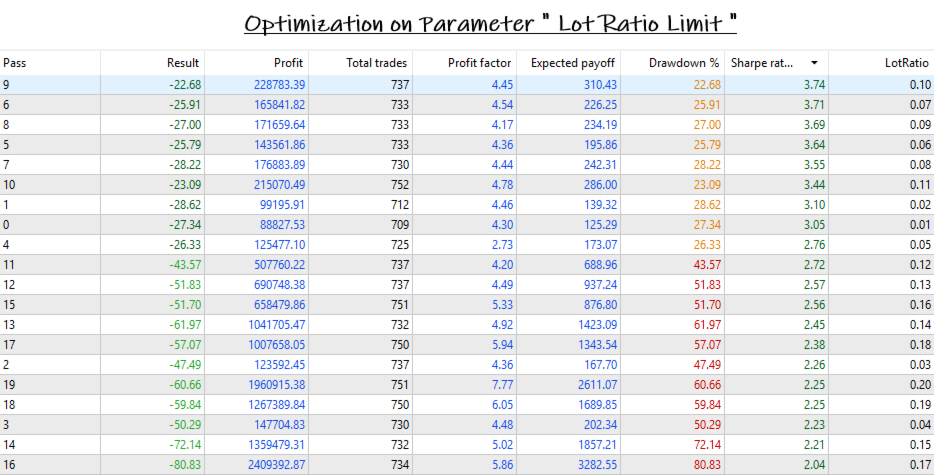
On the test period of 1 year (Jan 2023 - Jan 2024), the profit at the end is about 900% of the initial deposit with a maximum drawdown of 22%, and the Sharpe ratio is greater than 3.74. (Results tested on version V1.4)
Note that the 22% drawdown mentioned above is the result from the strategy tester, which seems to use peak equity as a reference. Compared to the drawdown 13% result from this EA, which uses starting equity as a base. From this point of view, we will see the great performance of the EA and the Sharpe ratio over 3.0 is categorized as an excellent investment. Please see the attached video for the testing record. ( when you run this EA on tester please set delays to zero latency )
Upcoming Next Version (in June 2025)
- Capability to resume trading round. to solve the problem when the system crashes or experiences an accidental shutdown.
- Realtime potential side switching monitoring instead new bar event on current version.
- Improve trading algorithm to more efficient - the Sharpe ratio over than 4.0.
4 Keys Concept of Program
The algorithm is composed of 4 main functions as follows:
1. Market Analyzing - The used method is extremely new but very simple, called "Smart Candle," that I developed by myself. It's like a normal candlestick, but the start and end of the bar are specified by the dump event (not by the time interval). By this way we will see the clarity of the movement of the price and also the support and resistance level.
2. Trading Strategy - There are two main category. the first is about the direction of trading and the second is about the lot size.
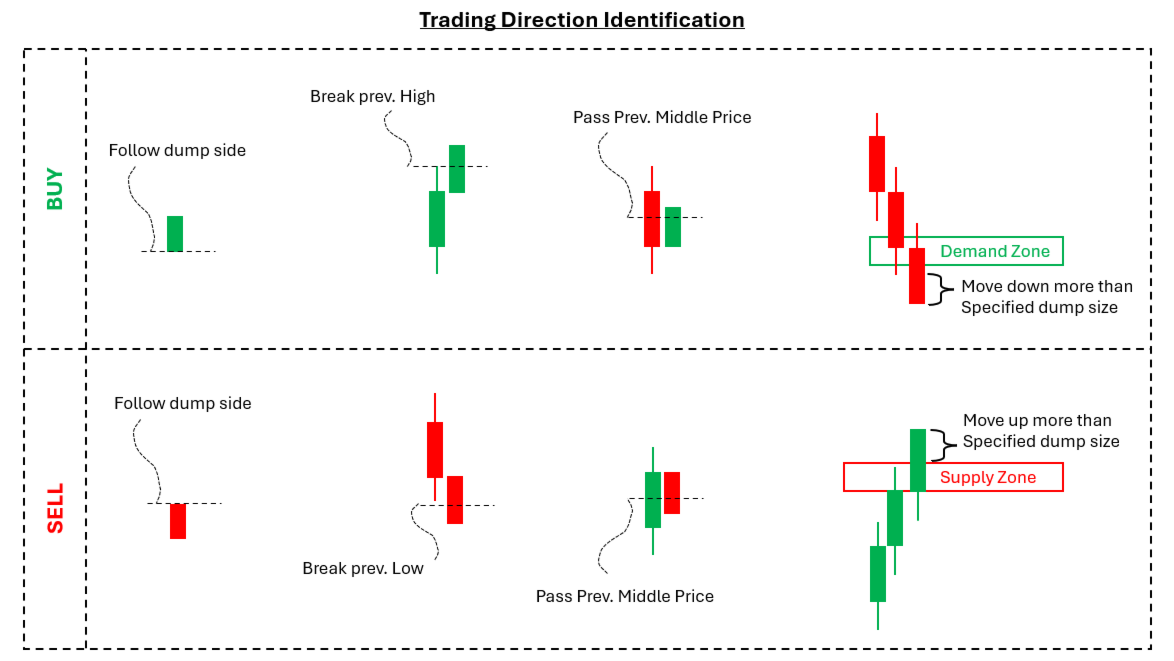
2.1 Trading Direction Identification. - There are 4 type of events that used to identify the trading direction.
2.1.1 The first is use the direction of dump event as as trading direction.
2.1.2 The second is the higher-high and lower-low method. The trading direction is buy when current price break up the high price of previous bar. and the trading direction is sell when the price break down the low price of previous bar.
2.1.3 The third is use the middle price of previous bar as a decision price. when the previous bar is bearish bar and the price travel up pass the middle price then the trading direction is set to buy. and in the other way when the previous
bar is bullish bar and the price travel down pass the middle price then the trading direction is set to sell.
2.1.4 The forth is use the demand and supply zone to determine the counter trend. when the price is over the supply zone and the price change is positive with size more than the limited dump size then the trading direction is set to sell.
and in the other way when the price below the demand zone and the price change is negative with size more than the limited dump size then the trading direction is set to buy.
2.2 Lot scaling. - The lot of trading will auto scale to match the situation. The scale factor is based on current price movement and the current accumulated lot on each side, user can adjust the overall scale factor by the parameter called
"Overall lot scaling factor.". And in the last updated version V1.4 user can adjust internal scaling parameter which composed of two parameter as follow
2.2.1 Parameter Named " Opposite Level Ratio limit " - the parameter is the ratio of position range of current direction divide by position range of the opposite direction. use to control the base of lot calculation. when the current position range divide by the opposite position range is less than the limit then the accumulate lot on opposite side is used as base of current trading volume calculation. otherwise the current accumulate lot is used as base of current trading volume calculation.
2.2.2 Parameter Named "Lot Ratio limit". - the ratio of accumulate lot.
3.Close Positive Position - There are two type of events that activate the positions closing command.
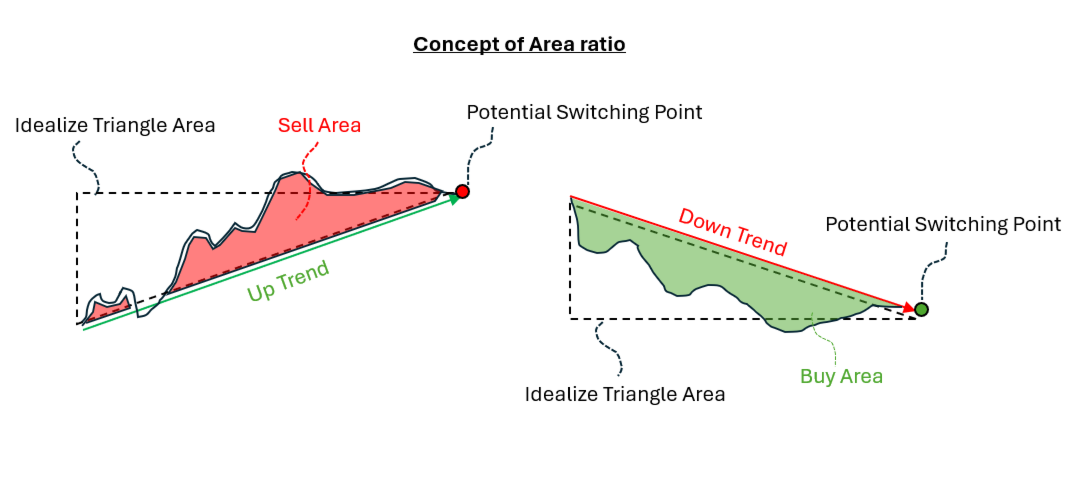
- 3.1 When the potential of price movement is switched. This is one of the most important things. We will close the positive position when the potential of price movement is switching (buy to sell, sell to buy). The concept to indicate the switching point is the curvature of the price movement, which is calculated by the ratio of the price area divided by the idealized triangle area. Imaginary of the uptrend line. The first thing we have is a price difference in the y-axis and a time difference in the x-axis. Multiply these two values and divide by 2; the result is an idealized triangle area. Then we consider the area above the trend line that is a sell area. Integrate the sell area over the time domain of the trend line. and then we can calculate the area ratio. After this, we need to trial the value of the area ratio to get the best actual closing price. (See the attached image for the concept of area ratio.)
- 3.2 When the new dump event is occur.
4.Close Trading Round—the trading round starts at the first time of placing an order. Then all trading activity has a record. The trading round will close when all these three criteria are satisfactory. The first criterion is that the profit must reach the target profit. The second criterion is the risk-reward ratio must reach the target risk-reward ratio. and the last criteria is the lot amount after the close positive is switching from higher to lesser. When closing the trading round, that means all positions and orders will be cleared, and the profit round record will be reset.
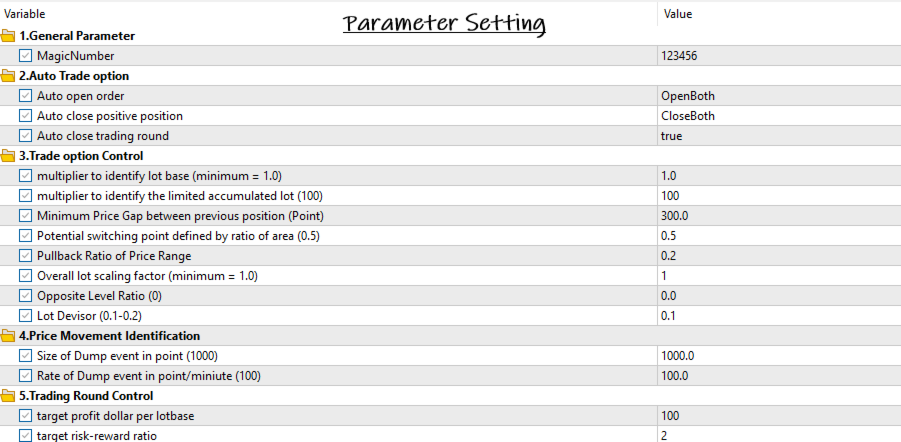
Parameters
There are a total of 14 parameters that are split into 5 groups as follows.
1.General Parameter
- Magic Number
2.Auto Trade option
- Auto open order - select auto open order option. there is 4 choice ( Both ,Buy ,Sell and Manual ).
- Auto close positive position - select auto close position option. there is 4 choice ( Both ,Buy ,Sell and Manual ).
- Auto close trading round - select auto close trading round option. there is 2 choice - ( true or false ).
3.Trade option Control
- multiplier to identify the lot base - The number will multiply with minimum lot to get the lot base. The recommended value is 1.
- multiplier to identify the limited accumulated lot - The number will multiply with minimum lot to get the maximum accumulated lot. The recommended value is 500.*
- Minimum Price Gap between previous position (Point) - Control the spacing of each order. The recommended value is 300.
- Potential switching point defined by ratio of area - Determine the potential switching. The recommended value is 0.2-0.3.
- Pullback Ratio of Price Range - use to count the wave and tip switching not effect to algorithm trading but intent to guide the manual trading. the recommended value is 0.2-0.3.
- Overall lot scaling factor - use to adjust the trading lot.
4.Price Movement Identification
- Size of Dump event in point - specify dump event. the recommended value is 1000.*
- Rate of Dump event in point/minute - specify dump event. the recommended value is 100.*
5.Trading Round Control
- target profit dollar per lot base - targeting profit per lot base.
- target risk-reward ratio - targeting risk-reward ratio. The recommended value is 1.5-2.0.
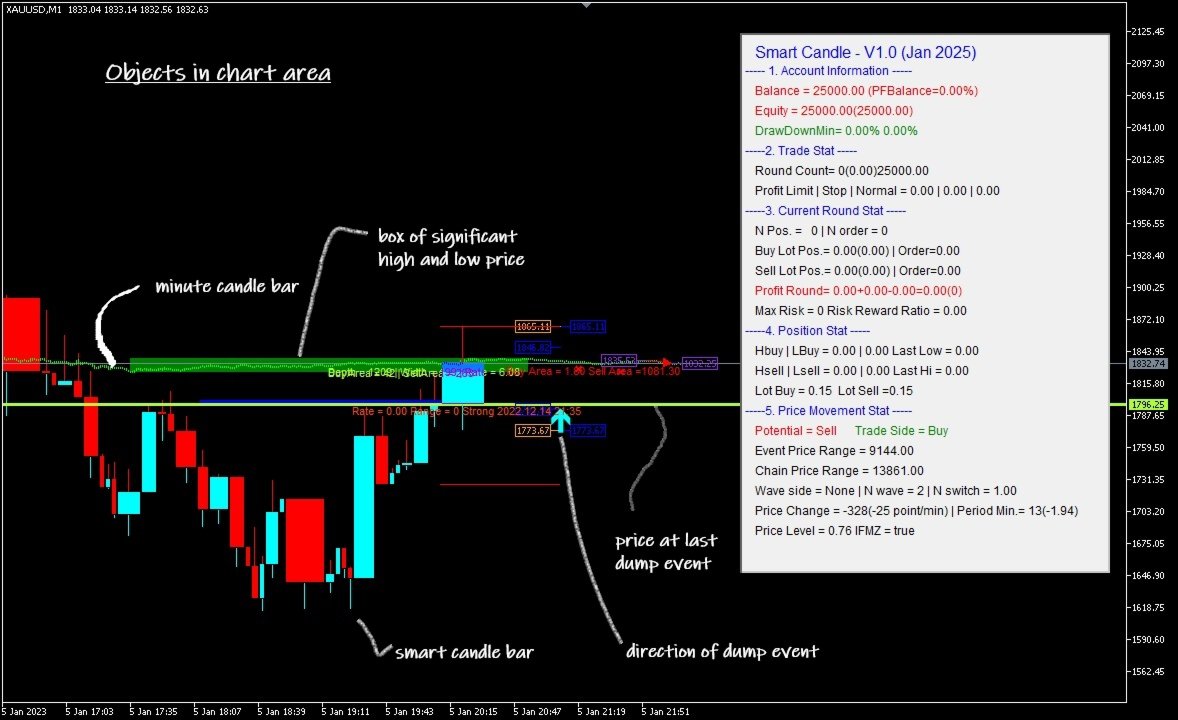
Objects in chart area
1.The information panel is on the right side. There are many lines of information that split into five groups. as follows.
group 1 - Account Information
- Balance
- Equity
- Draw Down - The drawdown is calculated based on the previous equity record, which differs from the drawdown that is calculated by the tester, which references the peak equity.
group 2 - Trade Stat
- Round Count Record
- Profit Record - record of profit that separate by type of order (limit ,stop, or by user)
group 3 - Current Round Stat
- Total Position - current opened position
- Buy Lot - sum of current buy lot
- Sell Lot - sum of current sell lot
- Profit Round - sum of profit and loss of current position
- Max Risk - record of maximum risk and current risk-reward ratio
group 4 - Position Stat
- Buy Position - high and low of current buy position
- Sell Position - high and low of current sell position
- Lot Current - lot size after scaling for open order buy and sell.
group 5 - Price Movement Stat
- Potential Movement & Trading Side - potential movement of price determine by the area ratio method. trading side determine by the higher-high or Lower-low method
- Event Price Range - the range of price movement related to dump event which shown in blue arrow price in the chart area.
- Chain Price Range - the range of price movement related to chain of the same direction of candle bars.
- Wave Stat - wave stat id include wave side ,number of wave and number of side switching. these stat are not effect the trading algorithm but intent to guide manual trading.
- Price Change - the property of price change relate to high price and low price which shown in purple arrow price in the chart area.
- Price Level - the comparing of current bid price to the range of chain of price. the value is 0 to 1.0 which 0 is means bid price is the lowest price of chain and the value 1.0 is means bid price is highest price of chain.
2.The smart candlestick is shown on the chart in the format of a red-blue color. At the start, it may need some time, such as 2-3 minutes, for the complete construction of the smart candlestick. The smart candlestick is almost the same as the normal candlestick, with the difference being the width of the bar. The width of the smart candlestick is a reflection of the time period. The biggest advantage of smart candles is the clarity of the support and resistance level (and also the demand and supply zone).
3. The supply zone is shown in red box. and the demand zone is shown in green box.
User Guideline
the ways to use this EA.
1.If you have a large budget, such as 25000 dollars. There is nothing to worry about; you can run EA by the recommended value without any scaling down.
2.If you have no large budget, there are 3 options.
2.1 You may need alliance. Gather funds from your friends and trade as one account. The large budget is more chance to survive in the market.
2.2 You may need to scale down. trial on tester to find the proper scaling that matches your budget.
2.3 Only use this EA as an indicator and perform manual trading. You can use the auto-close positive option to help you close the position at the best chance.
Restriction
- EA was tested on paring of XAUUSD. the leverage is 1:100.
- EA was tested on low spread account type.
- EA must run on 1 minute chart.
Remark
The initial price of this EA is 50 dollars/month; that is the special promotion. After one year and so on, the price will be increasing by 2x per year until the price reaches 800 dollars/month.