• Aperçu
  • Avis
  • Commentaires

Super Cluster Volume Candle

Volume Cluster Indicator for MetaTrader 4: Advanced Analysis of Support, Resistance, and Market Dynamics

The Volume Cluster Indicator for MetaTrader 4 is a powerful tool designed for traders seeking an in-depth understanding of market dynamics. It provides detailed insights into volume behavior within each candlestick, highlighting levels where volume is "overpriced" and areas of weakness. This enables precise identification of support and resistance zones, making it indispensable for traders leveraging order flow strategies, price action, and technical analysis.

What is the Volume Cluster Indicator?

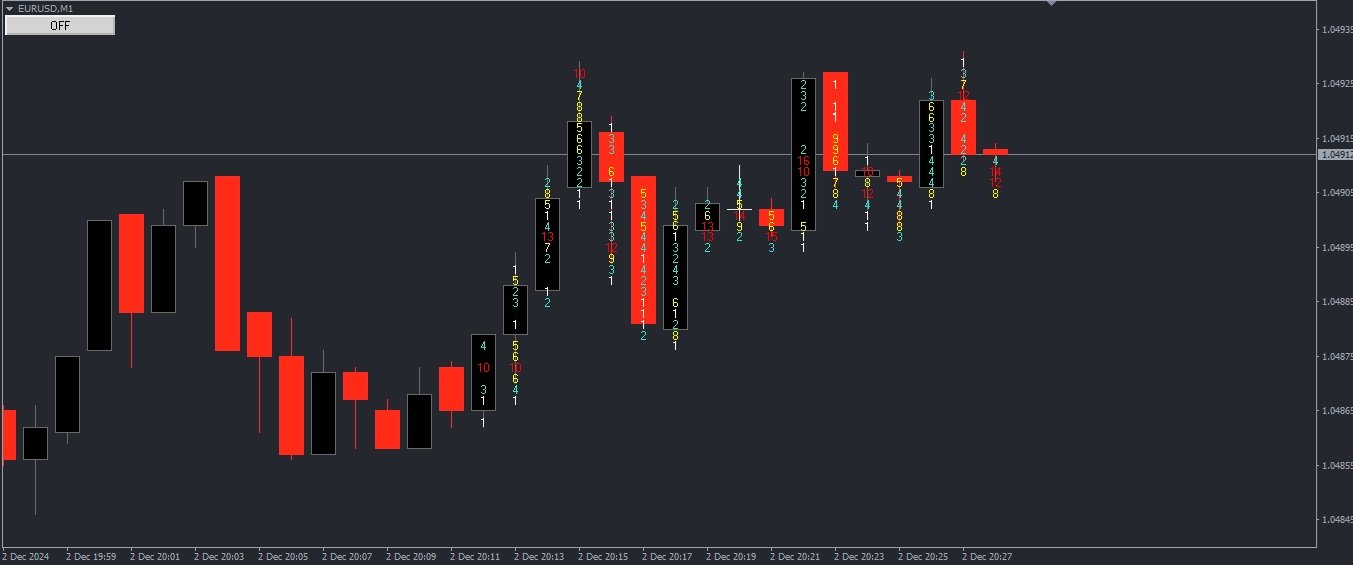
The Volume Cluster Indicator is a solution that maps the trading volume within each candlestick, segmenting it into clusters to reveal where buyers and sellers are concentrating their activity. These clusters are graphically represented, highlighting:

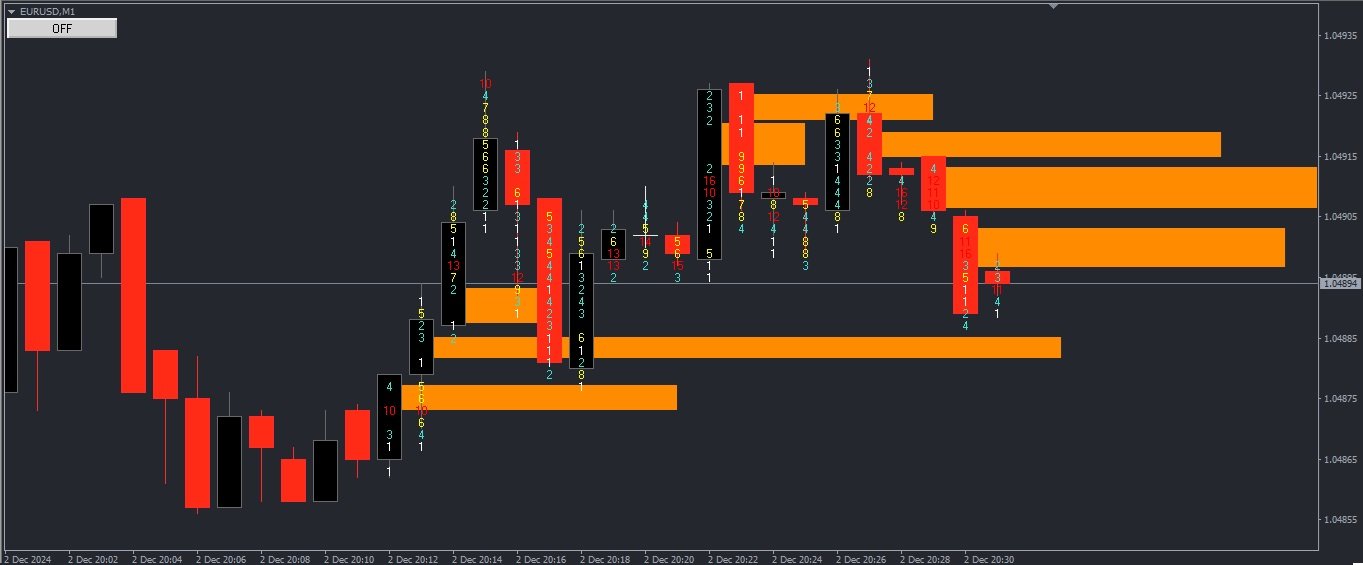
  • Overpriced Volume Zones: Areas where the traded volume is exceptionally high, indicating potential exhaustion of price movement or zones of institutional interest.
  • Volume Weakness Zones: Areas with low volume, often signaling a lack of interest or the market's inability to sustain certain price levels.

Key Features

  1. Detailed Candlestick Analysis

    • The indicator breaks down each candlestick's total volume and distributes the data into horizontal levels, showing where the volume is most concentrated.
    • Displays metrics such as:
      • Total volume;
      • Breakdown of buying and selling volumes;
      • Volume-weighted average price.
  2. Support and Resistance Identification

    • Uses volume clusters to determine optimal levels of support and resistance.
    • High-volume zones often act as significant barriers for price, while low-volume zones facilitate rapid price movements.
  3. Mapping of Key Interest Zones

    • Automatically highlights levels where the traded volume was extreme (overpriced) or insufficient (weak), allowing traders to focus on critical areas.
  4. Clear Visual Representation

    • Information is presented intuitively on the chart with colors and formats for quick comprehension.
    • Buying volume clusters are shown in green, while selling volume clusters are displayed in red, providing clear visual differentiation.
  5. Customizable Settings

    • Users can adjust indicator parameters, such as:
      • Cluster size;
      • Thresholds for identifying extreme or weak volumes;
      • Display of additional data, such as volume standard deviations.

How Does the Indicator Aid in Trading?

1. Identification of Dynamic Support and Resistance

Support and resistance levels are fundamental to many trading strategies. The Volume Cluster Indicator not only pinpoints these levels with precision but also provides contextual information to help traders understand their relevance.

  • Support: Levels with strong buying volume concentration. These zones often act as a "floor" for price due to significant buying interest.
  • Resistance: Levels with significant selling volume, acting as a "ceiling" for price.

Integrating this information enables traders to anticipate reversals or breakouts with greater confidence.

2. Detection of Market Traps

One of the biggest pitfalls for traders is entering positions at levels where volume is overpriced. The indicator alerts users to these zones, which may signal movement exhaustion or manipulation by large players.

3. Evaluation of Market Strength and Weakness

Volume is a critical indicator of market strength. The Volume Cluster Indicator allows traders to clearly see whether a price movement is supported by strong volume (a sign of conviction) or weak volume (an indication of potential reversal).

4. Detailed Information for Decision-Making

Within each candlestick, the indicator displays:

  • Where the highest volume concentration occurred;
  • The relative behavior of buyers and sellers;
  • Price regions with the highest institutional interest.

These insights help traders determine:

  • Whether a trend is sustainable;
  • Whether a breakout is valid or false;
  • The optimal time to enter or exit the market.

Practical Example

Imagine the price approaching a resistance level identified by the indicator. Upon analyzing the volume clusters, the trader notices a significant concentration of selling volume near this level, suggesting that sellers are defending this area. This increases the likelihood of a reversal.

Conversely, if buying volume consistently surpasses selling volume at this resistance, it may indicate an imminent breakout, offering an opportunity to position oneself in favor of the trend.

Why Choose This Indicator?

The financial markets are highly competitive, and relying solely on price observation is insufficient to gain a significant edge. The Volume Cluster Indicator offers a detailed view of what is happening "behind the scenes," enabling traders to:

  • Anticipate Movements: Identify where the market shows clear signs of strength or weakness.
  • Avoid Traps: Recognize overpriced volume zones where reversals are more likely.
  • Be Precise: Determine exact support and resistance levels based on objective data.

Competitive Advantages

  1. Easy Integration: Designed to work seamlessly on MetaTrader 4, the indicator is simple to install and use without requiring additional tools.
  2. Real-Time Analysis: Updates information in real time, ensuring traders have the latest data.
  3. Flexibility: Suitable for short-term traders, such as scalpers and day traders, as well as long-term traders looking to identify accumulation or distribution zones.

Who Should Use This Indicator?

  • Scalpers and Day Traders: Needing quick decisions based on precise volume data.
  • Swing Traders: Seeking to identify support and resistance zones to position their trades.
  • Technical Analysts: Looking for an additional tool to validate market hypotheses.
  • Institutional Traders: Wanting a granular view of the market to identify other players' interests.

Conclusion

The Volume Cluster Indicator for MetaTrader 4 is an essential tool for any trader serious about market analysis. It not only reveals support and resistance levels based on volume clusters but also provides a comprehensive analysis of each candlestick, highlighting where the market is showing strength or weakness.

With this indicator, users gain a significant competitive edge, enabling them to identify high-probability trading opportunities and avoid common traps. Its intuitive interface, combined with detailed and customizable information, makes it an indispensable choice for traders aiming for consistency and precision in their operations.

Whether you are a beginner looking for a reliable tool or an experienced professional seeking an advantage, the Volume Cluster Indicator for MetaTrader 4 will transform how you interpret the market.


Produits recommandés
Galactic Volume spread analysis (VSA), is an indicator designed for the visualization of the Volume, and the proportion in which it affects the volatility of the spread of the different pairs. The strategy consists of the following: Bull Trend: Always going in favor of the trend, open buying operations at the lows of the trend, provided that it coincides with a high volume shown by the Galactic VSA indicator. Downtrend: Always going in favor of the trend, open sales operations at the highs of
Smart Ai Levels  Accumulation & Distribution indicator Smart Ai Levels are Ai controlled indicator which is based on Wyckoff Price cycle theory . It automatically scans the Accumulation & Distribution phases on chart and Ai draws the possible areas before Mark up and Mark down which acts as hot zones and can be traded with confirmation to catch those big price movements . It's a great tool for both Reversal and Breakout Trades suitable to all Trading Styles such as Scalping - Intraday - Swing 
OFFER!   OFFER ! After 3 weeks the unlimited price will be 500$ and in the future you will regret why you didn't make a purchase at this lowest price. Dear Traders, the atomic power Entries Indicator is one of the indicators that if used wisely and correctly can help you to find an edge over the market.  The indicator will work for all forex pairs, all markets and all timeframes. Still it is your duty to find the most effective timeframe for you. When the sell or buy arrow appears you will get a
The   Visual Volatility Clustering   indicator clusters the market based on volatility. The indicator does not redraw and gives accurate data, does not use closing prices. Uses the opening prices or the highs or lows of the previous completed bar. Therefore, all information will be clear and unambiguous. The essence of the indicator is to divide the price market into certain areas according to a similar type of volatility. This can be done in any way. In this example, the indicator is configure
GMMA Trade X is an EA based on GMMA. GMMA parameters such as MovingAveragePeriod1-24, MovingAverageMAShift1-24, MovingAverageShift1-24 and CandlestickShift1-24 can be adjusted. GMMA Trade X applies BTN TECHNOLOGY's state-of-the-art intelligent technology to help you create optimal results for your trades. May your dreams come true through GMMA Trade X. Good luck. = == == Inquiries = == == E-Mail:support@btntechfx.com
Robot scalpeur pour la période M5. Négocie sur la paire de devises GBPUSD. Ce robot a été spécialement développé par une société de traders professionnels pour le trading de la livre sterling. Le robot ouvre environ 5 à 15 transactions par jour. Il est préférable de négocier avec des courtiers qui ont un faible écart sur GBPUSD jusqu'à 10 pips. Le dépôt minimum recommandé pour commencer est de 500 $ ou plus. Avantages : n'utilise pas de martingale. pas un filet. chaque transaction a un stop lo
Introduction It is common practice for professional trades to hide their stop loss / take profit from their brokers. Either from keeping their strategy to the themselves or from the fear that their broker works against them. Using this indicator, the stop loss / take profit points will be drawn on the product chart using the bid price. So, you can see exactly when the price is hit and close it manually.  Usage Once attached to the chart, the indicator scans the open orders to attach lines for t
Mean Reversion Supply Demand Indicator Mean Reversion Supply Demand is the indicator to detect the important supply demand zone in your chart. The concept of supply demand trading relies on the quantity mismatching between buying and selling volumes in the financial market. Typically, supply demand zone serves to predict the turning point. The wave pattern, for any supply demand zone to work as an successful trade, looks like the price must touch the base zone, move away and then return to zone
ECM Elite Channel is a volatility-based indicator, developed with a specific time algorithm, which consists of finding possible corrections in the market. This indicator shows two outer lines, an inner line (retracement line) and an arrow sign, where the channel theory is to help identify overbought and oversold conditions in the market. The market price will generally fall between the boundaries of the channel. If prices touch or move outside the channel, it's a trading opportunity. The ind
Indicateur Crypto_Forex "CHANNEL of FRACTALS" pour MT4. - Cet indicateur affiche les lignes de tendance locales réelles basées sur les hauts/bas des fractales. - Idéal pour les traders qui utilisent l'analyse graphique. - Lignes de tendance locales de résistance - Couleur rouge. - Lignes de tendance locales de support - Couleur bleue. - Il a peu de paramètres responsables du nombre de fractales, des couleurs et de la largeur des lignes de tendance. - L'indicateur est idéal pour détecter l'état
Gemini Trump
Jingzhi Wang
Gemini Trump EA represents a sophisticated advancement in grid trading systems. Unlike traditional methods that rely on fitting the system to historical data, Gemini Trump EA is engineered to exploit existing market inefficiencies, leveraging authentic market dynamics. Gemini boasts an impressive array of features designed for both convenience and performance. With its One Chart Setup, you can trade all supported symbols using a single chart, while its Multi-Currency Support seamlessly handles m
SindiX Margin Index
Ahmad Amiruldin A Sindi
this indicator will help you see the following : first , price levels that shows : 1. breakeven level for all open positions ( BEA shown in blue line ) 2. breakeven level for all open buy positions ( BEB shown in green line ) 3. breakeven level for all open sell positions ( BES shown in red line ) 4. draw a line at Margin level 100% ( violet color line ) 5. draw a line at Margin call level ( violet color line ) 6. draw a line at StopOut ( violet color line ) second , to the left : 1. it will s
Chart Patterns Detect 15 patterns (Ascending Triangle, Descending Triangle, Rising Wedge, Falling Wedge, Bullish Flag, Bearish Flag, Bullish Rectangle, Bearish Rectangle Symmetrical triangle, Head and Shoulders, Inverted Head and Shoulders, Triple top, Triple Bottom, Double Top, Double Bottom) Use historical data to calculate the probability of each pattern to succeed (possibility to filter notification according to the chance of success) gives graphic indication about the invalidation level and
This EA is a free version of Tiger Grid which is available here:  https://www.mql5.com/en/market/product/33835 Tiger Grid EA is an expert advisor using trading strategy  which has been developed by using machine learning concepts. It has passed 14 years of backtest of real tick data and real variable spread (with commission) from 2004 to 2018. The entries are usually accurate and in case if the trend signal has a delay the positions will be managed by a smart grid system.  This system uses a gr
FREE
This indicator Super Channel Pro Pluss indicator.Indicator displays trend movement. Indicator calculates automatically line. Features FiltPer - displays indicator channel period. deviation - displays indicator channel deviation. deviation2 - displays indicator channel deviation. deviation3 - displays indicator channel deviation. How to understand the status: If the arrow is up and line color Teal ;trend is up. If the arrow is down and line color Red; trend is down. If the arrow is Yellow close
Last 50 Pips
Martin Alejandro Bamonte
L'indicateur Last 50 Pips est conçu pour identifier rapidement des opportunités d'achat et de vente basées sur le comportement récent des prix. Il mesure la variation des prix sur les dernières bougies pour mettre en évidence en jaune les moments où le prix peut changer de direction. Signal d'achat : Vous devez ouvrir une position d' ACHAT lorsque l'indicateur passe du ROUGE au JAUNE , ce qui suggère un passage d'une tendance baissière à une tendance haussière. Veuillez consulter les images pou
Gecko
Profalgo Limited
4.4 (10)
NEW PROMO: Only a few copies copies available at 349$ Next price: 449$ Make sure to check out our " Ultimate EA combo package " in our   promo blog ! Gecko runs a simple, yet very effective, proven strategy.  It looks for important recent high and lows and will trade the breakouts.  The actual execution of this strategy however, is what makes this EA truly shine.  Entry calculations and exit algorithms are not only unique but also very advanced. LIVE RESULTS: https://www.mql5.com/en/signals/75
Voenix
Lorentzos Roussos
4.58 (12)
Motifs harmoniques , scanner et commerçant  Patrons inclus : Modèle ABCD Motif Gartley Motif chauve-souris Modèle de chiffrement Modèle 3Drives Motif cygne noir Motif cygne blanc Motif Quasimodo ou motif Over Under Modèle de chauve-souris alternative Motif papillon Motif de crabe profond Motif crabe Motif requin Motif FiveO Motif tête et épaules Motif triangle ascendant Modèle un deux trois Et 8 motifs personnalisés Voenix est un scanner de modèles harmoniques multi-périodes et multi-paires, pr
NOTE: PRICE WILL RISE VERY SOON. DON'T SKIP THIS OFFER! Dear traders I am glad to introduce the " Market Swing Scanner Board" indicator to you. This indicator was made mainly to be used in combination with the Market Swing Index Indicator. You use the  "Market Swing Scanner Board"  indicator to scan for trading opportunities on the  Market Swing Index Indicator . This tool is designed for serious traders who have decided to make a difference through trading. Be the next person to witness this st
TradeLogic Pro – The Advanced MT4 EA for Long Term Investing TradeLogic Pro   is an advanced   MetaTrader 4 Expert Advisor (EA)   designed to harness the power of price imbalances in the forex trading markets. Whether you’re a beginner or a professional trader,   TradeLogic Pro   uses sophisticated market analysis to identify high-potential entry points, allowing you to trade smarter and more efficiently. How Does TradeLogic Pro Work? At the core of   TradeLogic Pro   is its ability to   detect
Swing trading is a method in which traders attempt to take advantage of market fluctuations. They buy a security when they believe the market will rise and sell if they feel the market will fall, which, as you can imagine, is common in most trading strategies, irrespective of trading style. The four most frequently occurring patterns in the swing trading domain are reversal, retracement (or pullback), breakouts, and breakdowns. it work all currency pair, and work all timeframe 100% non repaint
Weis Wave Indicator
Dhabaleswar Prasad Jena
This indicator is based on the Weis wave principle of wave volume. Below are few features of the indicator It draws the wave on the chart while the accumulated volume per wave in a different window at the bottom of the chart You can configure the turning point move It displays the accumulated volume (in thousands, eg for 15000 volume it will show 15) at the end of each wave You can also configure to show number of candles in the wave along with the wave volume The indicator calculates the distin
Indicador Taurus All4
Fabio Oliveira Magalhaes
Taurus All4 Taurus All4 is a high-performance indicator, it will tell you the strength of the trend, and you will be able to observe the strength of the candle. Our indicator has more than 4 trend confirmations. It is very simple and easy to use. Confirmation Modes Candle Trend Confirmations: When the candle switches to light green the trend is high. When the candle switches to light red the trend is reverting down. When the candle changes to dark red the trend is low. Trendline Trend Confirm
Introduction to Chart Pattern MT Chart Pattern MT is a chart pattern scanner to detect the triangle pattern, falling wedge pattern, rising wedge pattern, channel pattern and so on. Chart Pattern MT uses highly sophisticated chart pattern detection algorithm. However, we have designed it in the easy to use with intuitive user interface. Chart Pattern MT will show all the patterns in your chart in the most efficient format for your trading. You do not have to do tedious manual pattern detection an
Towers
Yvan Musatov
Towers - Trend indicator, shows signals, can be used with optimal risk ratio. It uses reliable algorithms in its calculations. Shows favorable moments for entering the market with arrows, that is, using the indicator is quite simple. It combines several filters to display market entry arrows on the chart. Given this circumstance, a speculator can study the history of the instrument's signals and evaluate its effectiveness. As you can see, trading with such an indicator is easy. I waited for an a
Reversal Monster Mini
Abdulfattah Yahya Mohammed Alhazmi
The Most advanced and comprehensive EA to trade Trend Reversals/Pullbacks It is a very profitable EA, to trade trends breakout, and manage trades, takeprofit, stoploss, move to breakeven, and trailing stop. The   “Reversal Monster EA”   trades Reversal/Pullbacks when the current price of the pair pullback to a predefined horizontal level or trendline on the currency chart. The opening of the position can be immediate after pullback to the drawn trendline or after closing the candle below/above
FREE
Blahtech Supply Demand
Blahtech Limited
4.58 (36)
Was: $299  Now: $149   Supply Demand uses previous price action to identify potential imbalances between buyers and sellers. The key is to identify the better odds zones, not just the untouched ones. Blahtech Supply Demand indicator delivers functionality previously unavailable on any trading platform. This 4-in-1 indicator not only highlights the higher probability zones using a multi-criteria strength engine, but also combines it with multi-timeframe trend analysis, previously confirmed swings
Mechanism : The EA opening trade base on the standard " Japanese CandleSticks Technical Analysis " and confirming the signal by various reversal zone define by "Divergence, Support and Resistance, and some common Indicators like Sto, Bollinger Band, MACD etc" under the CONFIRMATION INPUTS SETTINGS (True/false option). Lot Method: The EA is Implemented with fixed lot size and Auto lot base on specified Risk Management System base on the available account balance by some percent risk of that's. Tr
This indicator works on MT4 and is very easy to use. When you receive a signal from it, you wait for that candle with the signal to close and you enter your trade at the beginning of the next new candle . A red arrow means sell and a green arrow means buy. All arrows comes with Alert  like for easy identification of trade signal. Are you okay with that? 1 minute candle 1 minute expire
Intel Trend
Tatiana Savkevych
Intel Trend is a forex trend indicator based on all the usual SAR, using differential calculus to generate a signal not directly from the price but from the derivative of the function. Also, when using the SAR indicator, the first point often changes, which is why the default parameter ShiftBar = 1. To skip the first baoa and read information directly from the second bar. If you set ShiftBar = 0, there will be perfect signals, but they are false. real signals for each timeframe and for each cur
Les acheteurs de ce produit ont également acheté
Cycle Maestro
Stefano Frisetti
NOTE: CYCLEMAESTRO is distributed only on this website, there are no other distributors. Demo version is for reference only and is not supported. Full versione is perfectly functional and it is supported CYCLEMAESTRO , the first and only indicator of Cyclic Analysis, useful for giving signals of TRADING, BUY, SELL, STOP LOSS, ADDING. Created on the logic of Serghei Istrati and programmed by Stefano Frisetti ; CYCLEMAESTRO is not an indicator like the others, the challenge was to interpret only t
System Trend Pro
Aleksandr Makarov
5 (2)
Special offer! https://www.mql5.com/ru/users/bossik2810 System Trend Pro - This is the best trend trading indicator!!! The indicator no repaint!!!  The indicator has   MTF   mode, which adds confidence to trading on the trend (   no repaint   ). How to trade? Everything is very simple, we wait for the first signal (big arrow), then wait for the second signal (small arrow) and enter the market in the direction of the arrow. (See screens 1 and 2.) Exit on the opposite signal or take 20-30 pips,
StalkeR Arrow
Abdulkarim Karazon
5 (3)
StalkeR Arrow est un indicateur de flèche qui donne un signal d'achat et de vente sur la barre ouverte/intra-bar, cet indicateur est basé sur les modèles d'action des prix et les fractales. cet indicateur donne tp et sl pour chaque signal d'achat et de vente, les tp et sl se présentent sous forme de lignes au-dessus et en dessous de chaque signal, ils s'étendent jusqu'à ce qu'un nouveau signal soit formé cet indicateur a un panneau/tableau de bord de backtesting qui donne des statistiques de v
TrendMaestro
Stefano Frisetti
4 (4)
note: this indicator is for METATRADER4, if you want the version for METATRADER5 this is the link:  https://www.mql5.com/it/market/product/108106 TRENDMAESTRO ver 2.4 TRENDMAESTRO recognizes a new TREND in the bud, he never makes mistakes. The certainty of identifying a new TREND is priceless. DESCRIPTION TRENDMAESTRO identifies a new TREND in the bud, this indicator examines the volatility, volumes and momentum to identify the moment in which there is an explosion of one or more of these data a
Hit Rate Top Bottom Signal
Martin Alejandro Bamonte
Hit Rate Top Bottom Signal Hit Rate Top Bottom Signal Hit Rate Top Bottom Signal offre une approche totalement innovante. Il est idéal pour ceux qui souhaitent évaluer à l’avance comment le signal fonctionne avec un TP-SL spécifique et dans quels PAIRES/TF il est le plus performant. La stratégie Hit Rate Top Bottom Signal est un outil essentiel pour tout trader et type de trading car elle émet non seulement des signaux précis sans redessiner , indiquant clairement quand trader et dans quelle dir
Enigmera
Ivan Stefanov
5 (7)
ENIGMERA : Le cœur du marché Important : La démo de MQL5.com fonctionne dans le Strategy Tester et peut ne pas refléter pleinement les fonctionnalités d'Enigmera. Consultez la description, les captures d'écran et la vidéo pour plus de détails. N'hésitez pas à m'envoyer un message si vous avez des questions ! Le code de l'indicateur a été entièrement réécrit. La version 3.0 ajoute de nouvelles fonctionnalités et corrige les bugs accumulés depuis le lancement de l'indicateur. Introduction Cet in
MartingaleArrow
Abdulkarim Karazon
Martingale Arrow est un indicateur mt4 de type flèche conçu pour le trading d'options binaires martingale, cette flèche s'imprime sur la barre ouverte/intra barre et donne une alerte. COMMENT UTILISER : ouvrez le commerce dès que la flèche apparaît, si le commerce est gagné, attendez le prochain signal et négociez le même lot. Si le commerce perd le double lot au signal suivant et continuez ainsi jusqu'à ce qu'un signal gagne, réinitialisez et négociez avec le premier lot commercial. DÉLAI RECO
Linear Trend Predictor - Un indicateur de tendance qui combine des points d'entrée et des lignes de support de direction. Fonctionne sur le principe de franchissement du canal des prix haut/bas. L'algorithme de l'indicateur filtre le bruit du marché, prend en compte la volatilité et la dynamique du marché. Capacités de l'indicateur  À l'aide de méthodes de lissage, il montre la tendance du marché et les points d'entrée pour l'ouverture d'ordres d'ACHAT ou de VENTE.  Convient pour déterminer l
RelicusRoad Pro
Relicus LLC
4.63 (104)
Maintenant 147 $ (augmentant à 499 $ après quelques mises à jour) - Comptes illimités (PCS ou Mac) Manuel d'utilisation RelicusRoad + Vidéos de formation + Accès au groupe Discord privé + Statut VIP UNE NOUVELLE FAÇON DE REGARDER LE MARCHÉ RelicusRoad est l'indicateur de trading le plus puissant au monde pour le forex, les contrats à terme, les crypto-monnaies, les actions et les indices, offrant aux traders toutes les informations et tous les outils dont ils ont besoin pour rester rentables
PTS Precision Index Oscillator V2
PrecisionTradingSystems
5 (1)
L'oscillateur de l'indice de précision (Pi-Osc) de Roger Medcalf de Precision Trading Systems La version 2 a été soigneusement recodée pour être ultra-rapide à charger sur votre graphique, et quelques autres améliorations techniques ont été incorporées pour améliorer l'expérience. Le Pi-Osc a été créé pour fournir des signaux de synchronisation de trading précis conçus pour trouver des points d'épuisement extrêmes, les points auxquels les marchés sont contraints d'aller simplement pour élimin
Full Forex Market View Dashboard
Opengates Success International
5 (2)
Indicateur de tableau de bord FULL FOREX MARKET VIEW Il s'agit d'un indicateur personnalisé créé pour donner aux commerçants une vue complète de ce qui se passe sur le marché. Il utilise des données en temps réel pour accéder au marché et afficher toutes les informations nécessaires pour effectuer des transactions réussies. INSTALLATION: Avant de joindre cet indicateur à votre graphique de fenêtre, accédez au panneau Market Watch de votre MT4 et MASQUEZ toutes les paires de devises dont vous
Bomb Bank Signal
Igor Pereira Calil
5 (1)
Signal Bomb Bank : votre indicateur de confiance dans MetaTrader 4 Bomb Bank Signal est un indicateur puissant pour MetaTrader 4, conçu pour identifier les tendances les plus pertinentes du marché financier. Si vous recherchez un outil qui anticipe avec précision les mouvements, la Bomb Bank est l’alliée qu’il vous faut. Comment ça marche : Cet indicateur combine trois méthodes distinctes – analyse de volume, clôture de bougie et tendance symétrique – pour détecter et signaler les opportunit
This is a mini version(One pair) of Advanced Detector of Trend Reversal and Continuance known as TrueTrendStarM(TTSm25). It is a sensitive and Predictive indicator of Price Trends for Professional traders. ( WEEKEND DISCOUNT 15% OFF !!! )( ATTENTION BUYERS:- PLEASE CONTACT ME FOR HOW BEST TO USE THE INDICATOR FOR MAXIMUM PROFITS )    It detects high odds changes in Price Trend direction long before other indicator detects it. I have been working on it since 2019.    This is possible due to f
Gold Channel is a volatility-based indicator, developed with a specific timing algorithm for the XAUUSD pair, which consists of finding possible corrections in the market. This indicator shows two outer lines, an inner line (retracement line) and an arrow sign, where the theory of the channel is to help identify overbought and oversold conditions in the market. The market price will generally fall between the boundaries of the channel. If prices touch or move outside the channel it is a tradi
Algo Trading Indicaor  With this indicator , you’ll have zones and trends that hight probability the price will reverse from it. so will gives you all the help that you need  Why should you join us !?  1-This indicator is logical since it’s working in previous days movement , to predict the future movements. 2-Algo trading indicator will help you to draw trends which is special and are too strong than the basics trend , trends will change with the frame time that you work on . 3-We can use
Description Very precise patterns to detect: entry signals as well as breakout, support and resistance reversal patterns. It points out zones in which, with a high probability, institutional orders with the potential to change the price’s direction and keep moving towards it, have been placed.  KEY LINKS:   Indicator Manual  –  How to Install   –  Frequent Questions  -  All Products  How is this indicator useful? It will allow you to trade on the order’s direction, once its direction has been id
Nous vous présentons ON Trade Waves Patterns Harmonic Elliot Wolfe, un indicateur avancé conçu pour détecter divers types de schémas sur le marché à l'aide de méthodes manuelles et automatiques. Voici comment il fonctionne : Schémas Harmoniques : Cet indicateur peut identifier les schémas harmoniques qui apparaissent sur votre graphique. Ces schémas sont essentiels pour les traders qui pratiquent la théorie du trading harmonique, telle qu'elle est décrite dans le livre de Scott Carney "Harmonic
Introduction to X3 Chart Pattern Scanner X3 Cherart Pattern Scanner is the non-repainting and non-lagging indicator detecting X3 chart patterns including Harmonic pattern, Elliott Wave pattern, X3 patterns, and Japanese Candlestick patterns. Historical patterns match with signal patterns. Hence, you can readily develop the solid trading strategy in your chart. More importantly, this superb pattern scanner can detect the optimal pattern of its kind. In addition, you can switch on and off individu
Key level wedge pro
Presley Annais Tatenda Meck
5 (1)
We have combined all of our beloved indicators the likes of: Key level order block , Key level supply and demand , Key level liquidity grab and Key level wedge into one single indicator and dashboard. Whats new Dashboard : There is an easy access dashboard for all your needs. Multi-timeframe button : There is now a multi-timeframe option for Order Blocks and Supply and demand zones, making it easy to see higher timeframe zones easily on the current timeframe by just clicking the desired timefra
Please send me Direct message on MQL5 CHAT after purchasing the Indicator for Training and Installation Support There are some additional files that is important to use with the Indicator . So be sure to contact me after purchasing the Indicator So that I can add you for training and support . If you find any difficulty with installation then send me Direct message here So that I can connect with you via Anydesk or Teamview for the product installation. " Smart Order Block Indicator " to find m
Trade Invest Pro - Boss in the world of cryptocurrency! This indicator is ideal for cryptocurrency trading! Work on Trade Invest Pro took us half a year! But not in vain! Now only accurate signals near support - resistance levels! He showed himself well on timeframes m5 m15 for binary options! Optionally, it can be configured for forex for timeframes m30 and more! Reacts well to news! Doesn't paint! and does not disappear from the schedule! As soon as a red arrow appears, open a deal fo
ZO Trend
Trung Le Hoang
4 (4)
Important!! ZO Trend can't work on MN timeframe. /*--------------------------------------------------------------------------------------------------------------------------------------------------------------------------------------------- ZO Trend an indicator used to search for entry point. With the session candle algorithm on many timeframe, ZO Trend creates an area for traders find good Entry Point. ZO SYSTEM BASIC SETUP :  https://www.youtube.com/watch?v=qdNOXHWozNw ZO TREND User guide : 
La VITESSE DE TRANSACTION est l'indicateur de la plus haute qualité qui montre où et quand les ordres importants s'accumulent sur le marché et quels en sont les avantages. Il détecte les changements de tendance à un stade très précoce. Il s'agit à la fois d'un indicateur et d'un système de trading. Le concept est unique et incroyablement rentable. Sur le marché des changes, le tick volume est appelé de manière assez trompeuse volume. Il s'agit en fait de la variation du prix par unité de temps
How to use Pair Trading Station Pair Trading Station is recommended for H1 time frame and you can use it for any currency pairs. To generate buy and sell signal, follow few steps below to apply Pair Trading Station to your MetaTrader terminal. When you load Pair Trading Station on your chart, Pair Trading station will assess available historical data in your MetaTrader platforms for each currency pair. On your chart, the amount of historical data available will be displayed for each currency pai
Binary Booster
Yaroslav Varankin
5 (1)
Binary Options Trading Indicator: A Reliable Tool for Your Trades This indicator is specifically designed for binary options trading and has proven its high quality, reliability, and adequate accuracy, depending on the dynamics of the chart. Key Points: Signal Interpretation: When a blue cross signal appears, it indicates a potential entry into a trade, though it is considered a weak signal on its own. However, if the blue cross is accompanied by an arrow, it is considered a more reliable buy s
Dark Sniper
Dmitriy Kashevich
Dark Sniper pointer indicator.  Complete absence of redrawing   The percentage of correct indicator forecasts depends on your settings; the default is period 7 (performed better) The arrow indicates the direction of the next candle and the possible direction of the trend in the future.  Suitable for small timeframes m1 and m5  It is recommended to open transactions from 1 to 2 candles.  The signal appears on the current candle. Open a trade on the next one since the signal is being generat
All in One package includes the  Oscillator Predictor ,  MACD Predictor ,  Thrust Scanner  and  Advanced Fibonacci  indicators which are mandatory for applying  Dinapoli  trade plans.  Please visit below links for detailed explanations of indicators. Advanced Fibonacci Indicator =>  https://www.mql5.com/en/market/product/52834 Thrust Scanner Indicator => https://www.mql5.com/en/market/product/52830 Overbought /Oversold Predictor indicator => https://www.mql5.com/en/market/product/52621 Macd P
Hello Dear Trader, Today Im Telling You About The "Golden Scalp System V1 " Metatrader4 Golden Scalp System Scalper with EMA   This is a  Scalper strategy   based on ( Exponential moving average) EMA . Time frame: H1 Pair: EUR/USD, GBP/USD,AUD/USD XAU/USD Platform Mt4   Indicators for Scalper with Ema: 300  EMA (Exponential Moving Average) ; 500 EMA (Expontial Moving Average); Stochastic   (5,3,3)   Long Entry 1) 300  EMA   > 500  EMA . 2) Find significant levels of support. 3) Wait for the c
The Nihilist 5.0 Indicator includes Forexalien and Nihilist Easy Trend trading strategies and systems. It is composed of an MTF Dashboard where you can analyze the different input possibilities of each strategy at a glance. It has an alert system with different types of configurable filters. You can also configure which TF you want to be notified on your Metatrader 4 platform and Mobile application The indicator has the option to view how could be a TP and SL by using ATR or fixed points, even w
Il s'agit d'une stratégie simple basée sur les niveaux BREAKOUT et FIBONACCI. Après une évasion, soit le marché poursuit son mouvement directement vers les niveaux 161, 261 et 423 ou, revient au niveau de 50 % (également appelé correction) et continue ensuite très probablement le mouvement dans la direction initiale jusqu'aux niveaux 161, 261 et 423. La clé du système est la détection de la barre de répartition indiquée par un objet rectangle vert (UP TREND) ou rouge (DOWN TREND). Au momen
Plus de l'auteur
SR arrows liquid lines
Teresinha Moraes Correia
In the fifth update , the indicator now aims to predict the direction of the next candle, issuing a buy or sell arrow precisely when the conditions are met. Since its first version, which showed support and resistance levels on the chart, up to the current version 5, many improvements have been made. One of the key changes is the removal of visual support and resistance levels to prevent memory overload. This is no longer necessary, as arrows are now issued when the price is near or touches th
Value Chart Probability
Teresinha Moraes Correia
This updated version of the Value Chart indicator introduces new parameters in the way the indicator is calculated. Its main objective is to analyze the current range and attempt to predict the direction of the ongoing candle, displaying an arrow indicating where the candle is expected to move. The calculation structure is based on the last 1,000 candles. First, a weighted average is calculated for each candle. Then, the modified Value Chart calculation is applied to determine the range and str
Trend Colored Average
Teresinha Moraes Correia
This custom indicator for MetaTrader 4 is a powerful tool designed to help traders of all experience levels identify clear trends in the financial market. It is built to provide precise visual support, eliminating the confusion and subjectivity often associated with chart analysis. Additionally, it ensures that you can stay in a profitable position throughout the entire duration of a trend, avoiding premature exits before the movement is fully realized. Identifying Clear Trends The foundation o
Profile SR
Teresinha Moraes Correia
Description of Support and Resistance Indicator Based on Volume Profile for MetaTrader 4 Introduction The financial market is an arena where traders and investors constantly seek ways to gain a competitive edge. One of the most widely used and respected concepts in any market is support and resistance . These levels represent key price zones where supply and demand balance out, and where significant decisions are made by participants who drive the market. Our Support and Resistance Indicator wit
Ultimate Binary Options
Teresinha Moraes Correia
Ultimate Binary Options: The Best Indicator for Your Binary Options Trading If you're looking for a reliable, efficient, and powerful way to boost your results in binary options trading, Ultimate Binary Options is the perfect solution for you. This indicator was developed to provide traders with unparalleled accuracy, delivering success rates above 90% . But it's not just about numbers—it's about turning your strategies into consistently winning trades. What Makes Ultimate Binary Options S
Filtrer:
Aucun avis
Répondre à l'avis