Super Cluster Volume Candle
- Indicatori
- Teresinha Moraes Correia
- Versione: 1.0
- Attivazioni: 5
Volume Cluster Indicator for MetaTrader 4: Advanced Analysis of Support, Resistance, and Market Dynamics
The Volume Cluster Indicator for MetaTrader 4 is a powerful tool designed for traders seeking an in-depth understanding of market dynamics. It provides detailed insights into volume behavior within each candlestick, highlighting levels where volume is "overpriced" and areas of weakness. This enables precise identification of support and resistance zones, making it indispensable for traders leveraging order flow strategies, price action, and technical analysis.
What is the Volume Cluster Indicator?
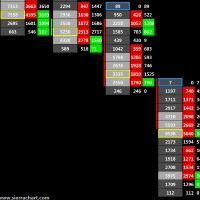
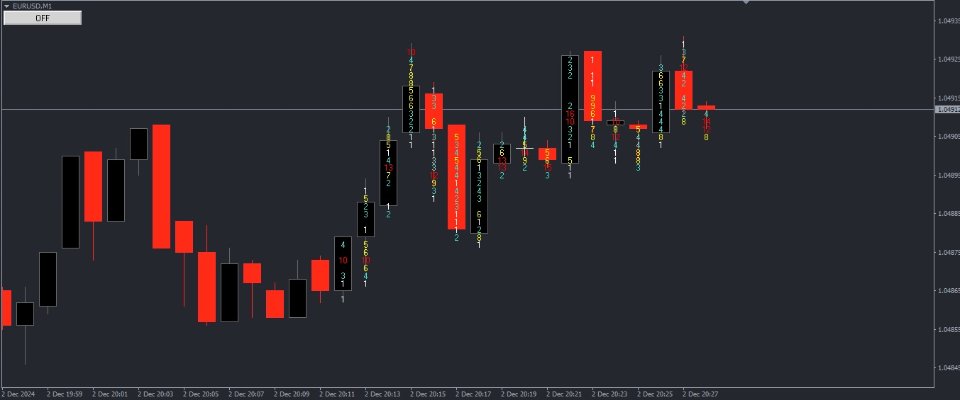
The Volume Cluster Indicator is a solution that maps the trading volume within each candlestick, segmenting it into clusters to reveal where buyers and sellers are concentrating their activity. These clusters are graphically represented, highlighting:
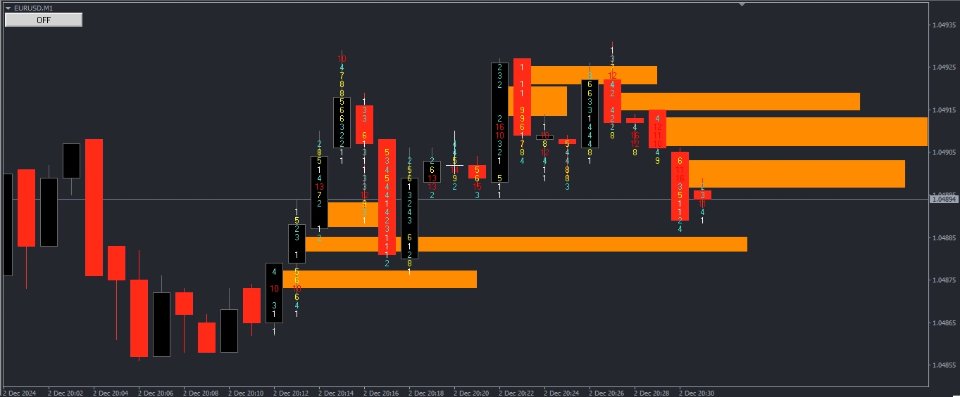
- Overpriced Volume Zones: Areas where the traded volume is exceptionally high, indicating potential exhaustion of price movement or zones of institutional interest.
- Volume Weakness Zones: Areas with low volume, often signaling a lack of interest or the market's inability to sustain certain price levels.
Key Features
-
Detailed Candlestick Analysis
- The indicator breaks down each candlestick's total volume and distributes the data into horizontal levels, showing where the volume is most concentrated.
- Displays metrics such as:
- Total volume;
- Breakdown of buying and selling volumes;
- Volume-weighted average price.
-
Support and Resistance Identification
- Uses volume clusters to determine optimal levels of support and resistance.
- High-volume zones often act as significant barriers for price, while low-volume zones facilitate rapid price movements.
-
Mapping of Key Interest Zones
- Automatically highlights levels where the traded volume was extreme (overpriced) or insufficient (weak), allowing traders to focus on critical areas.
-
Clear Visual Representation
- Information is presented intuitively on the chart with colors and formats for quick comprehension.
- Buying volume clusters are shown in green, while selling volume clusters are displayed in red, providing clear visual differentiation.
-
Customizable Settings
- Users can adjust indicator parameters, such as:
- Cluster size;
- Thresholds for identifying extreme or weak volumes;
- Display of additional data, such as volume standard deviations.
- Users can adjust indicator parameters, such as:
How Does the Indicator Aid in Trading?
1. Identification of Dynamic Support and Resistance
Support and resistance levels are fundamental to many trading strategies. The Volume Cluster Indicator not only pinpoints these levels with precision but also provides contextual information to help traders understand their relevance.
- Support: Levels with strong buying volume concentration. These zones often act as a "floor" for price due to significant buying interest.
- Resistance: Levels with significant selling volume, acting as a "ceiling" for price.
Integrating this information enables traders to anticipate reversals or breakouts with greater confidence.
2. Detection of Market Traps
One of the biggest pitfalls for traders is entering positions at levels where volume is overpriced. The indicator alerts users to these zones, which may signal movement exhaustion or manipulation by large players.
3. Evaluation of Market Strength and Weakness
Volume is a critical indicator of market strength. The Volume Cluster Indicator allows traders to clearly see whether a price movement is supported by strong volume (a sign of conviction) or weak volume (an indication of potential reversal).
4. Detailed Information for Decision-Making
Within each candlestick, the indicator displays:
- Where the highest volume concentration occurred;
- The relative behavior of buyers and sellers;
- Price regions with the highest institutional interest.
These insights help traders determine:
- Whether a trend is sustainable;
- Whether a breakout is valid or false;
- The optimal time to enter or exit the market.
Practical Example
Imagine the price approaching a resistance level identified by the indicator. Upon analyzing the volume clusters, the trader notices a significant concentration of selling volume near this level, suggesting that sellers are defending this area. This increases the likelihood of a reversal.
Conversely, if buying volume consistently surpasses selling volume at this resistance, it may indicate an imminent breakout, offering an opportunity to position oneself in favor of the trend.
Why Choose This Indicator?
The financial markets are highly competitive, and relying solely on price observation is insufficient to gain a significant edge. The Volume Cluster Indicator offers a detailed view of what is happening "behind the scenes," enabling traders to:
- Anticipate Movements: Identify where the market shows clear signs of strength or weakness.
- Avoid Traps: Recognize overpriced volume zones where reversals are more likely.
- Be Precise: Determine exact support and resistance levels based on objective data.
Competitive Advantages
- Easy Integration: Designed to work seamlessly on MetaTrader 4, the indicator is simple to install and use without requiring additional tools.
- Real-Time Analysis: Updates information in real time, ensuring traders have the latest data.
- Flexibility: Suitable for short-term traders, such as scalpers and day traders, as well as long-term traders looking to identify accumulation or distribution zones.
Who Should Use This Indicator?
- Scalpers and Day Traders: Needing quick decisions based on precise volume data.
- Swing Traders: Seeking to identify support and resistance zones to position their trades.
- Technical Analysts: Looking for an additional tool to validate market hypotheses.
- Institutional Traders: Wanting a granular view of the market to identify other players' interests.
Conclusion
The Volume Cluster Indicator for MetaTrader 4 is an essential tool for any trader serious about market analysis. It not only reveals support and resistance levels based on volume clusters but also provides a comprehensive analysis of each candlestick, highlighting where the market is showing strength or weakness.
With this indicator, users gain a significant competitive edge, enabling them to identify high-probability trading opportunities and avoid common traps. Its intuitive interface, combined with detailed and customizable information, makes it an indispensable choice for traders aiming for consistency and precision in their operations.
Whether you are a beginner looking for a reliable tool or an experienced professional seeking an advantage, the Volume Cluster Indicator for MetaTrader 4 will transform how you interpret the market.
