Wa Candle Timer Percentage
- Indicateurs
- Wachinou Lionnel Pyrrhus Sovi Guidi
- Version: 1.0
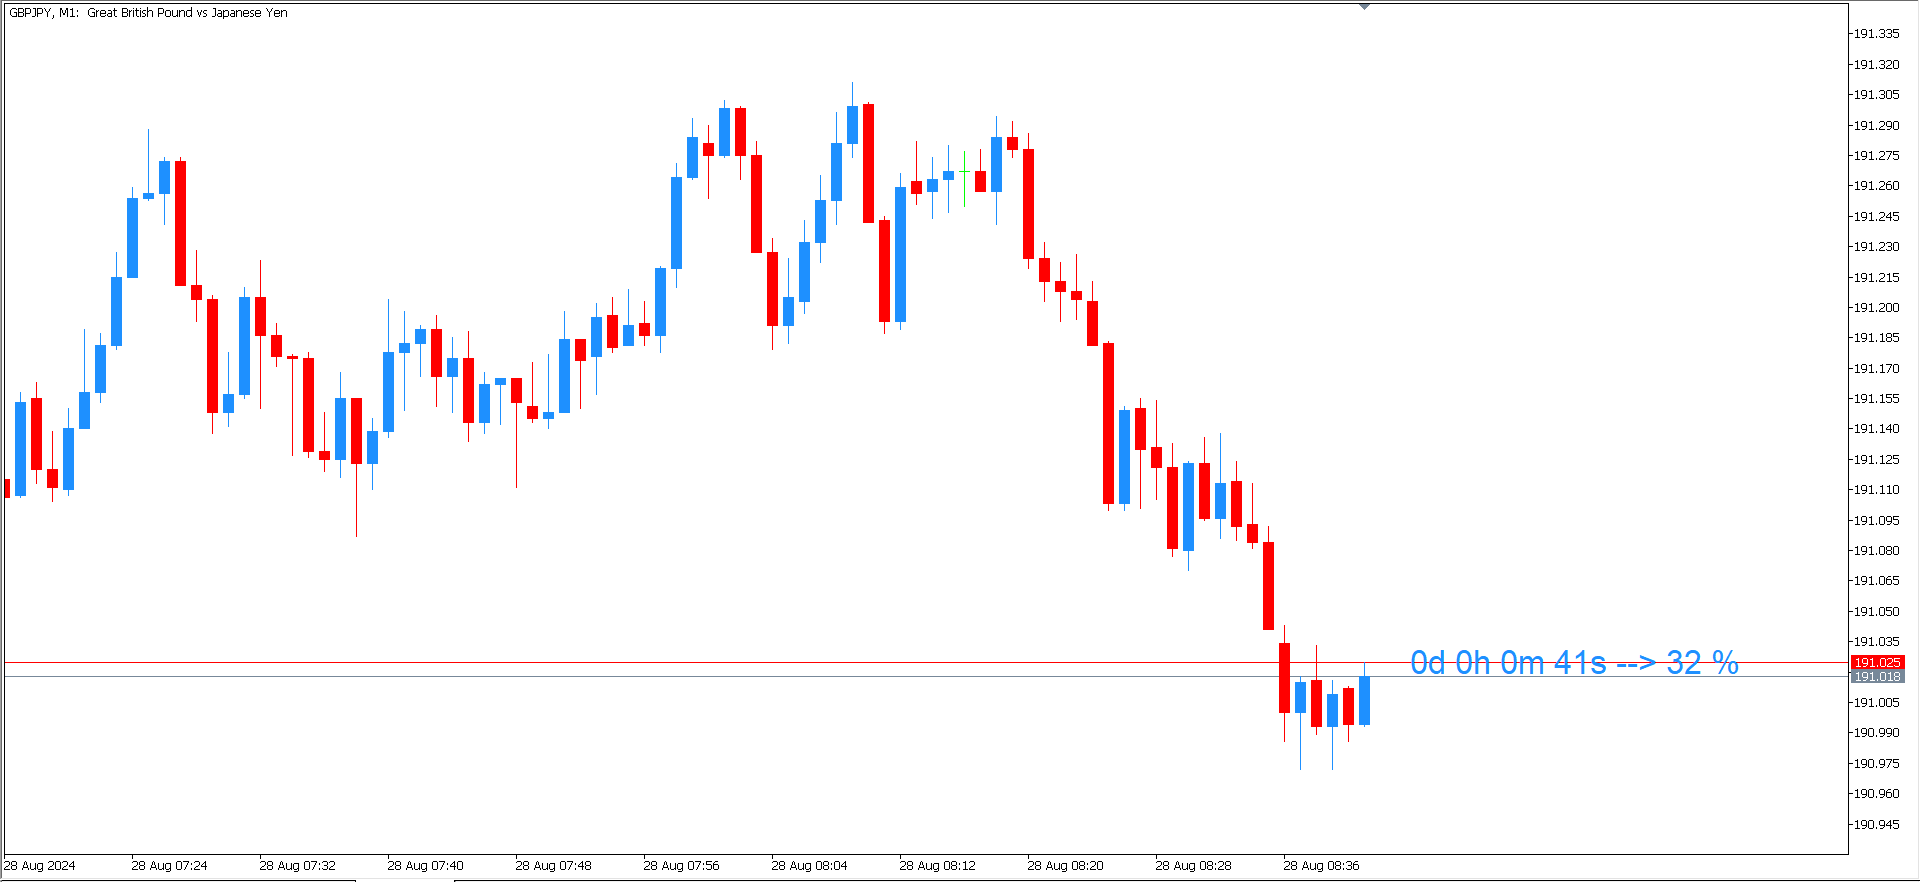
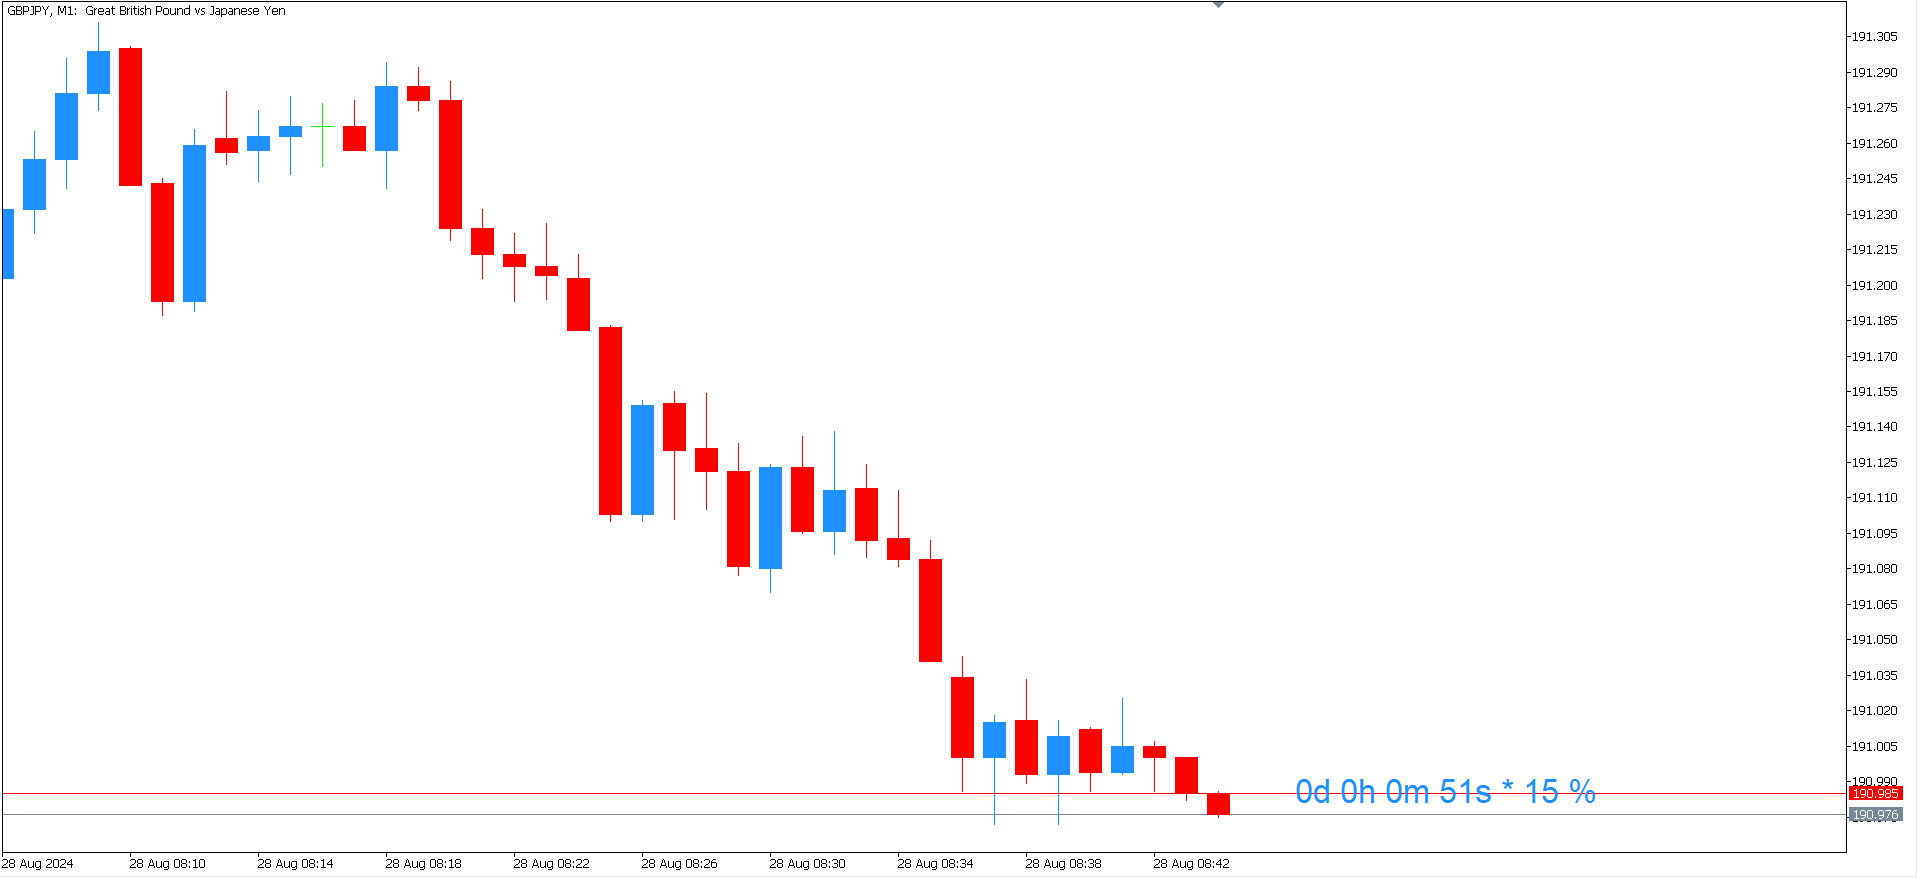
Wa Candle Timer Percentage MT4 est un indicateur qui montre à l'utilisateur combien de temps il reste avant l'ouverture de la prochaine bougie.
Le pourcentage d'évolution de la bougie actuelle est aussi montré sur l'écran.
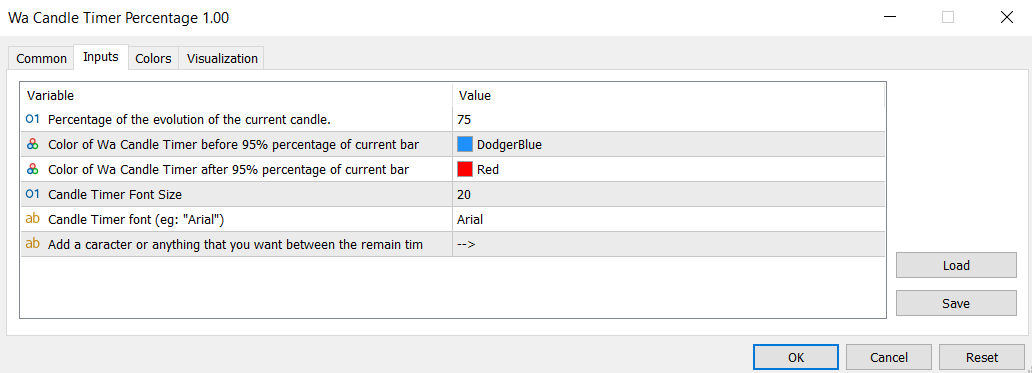
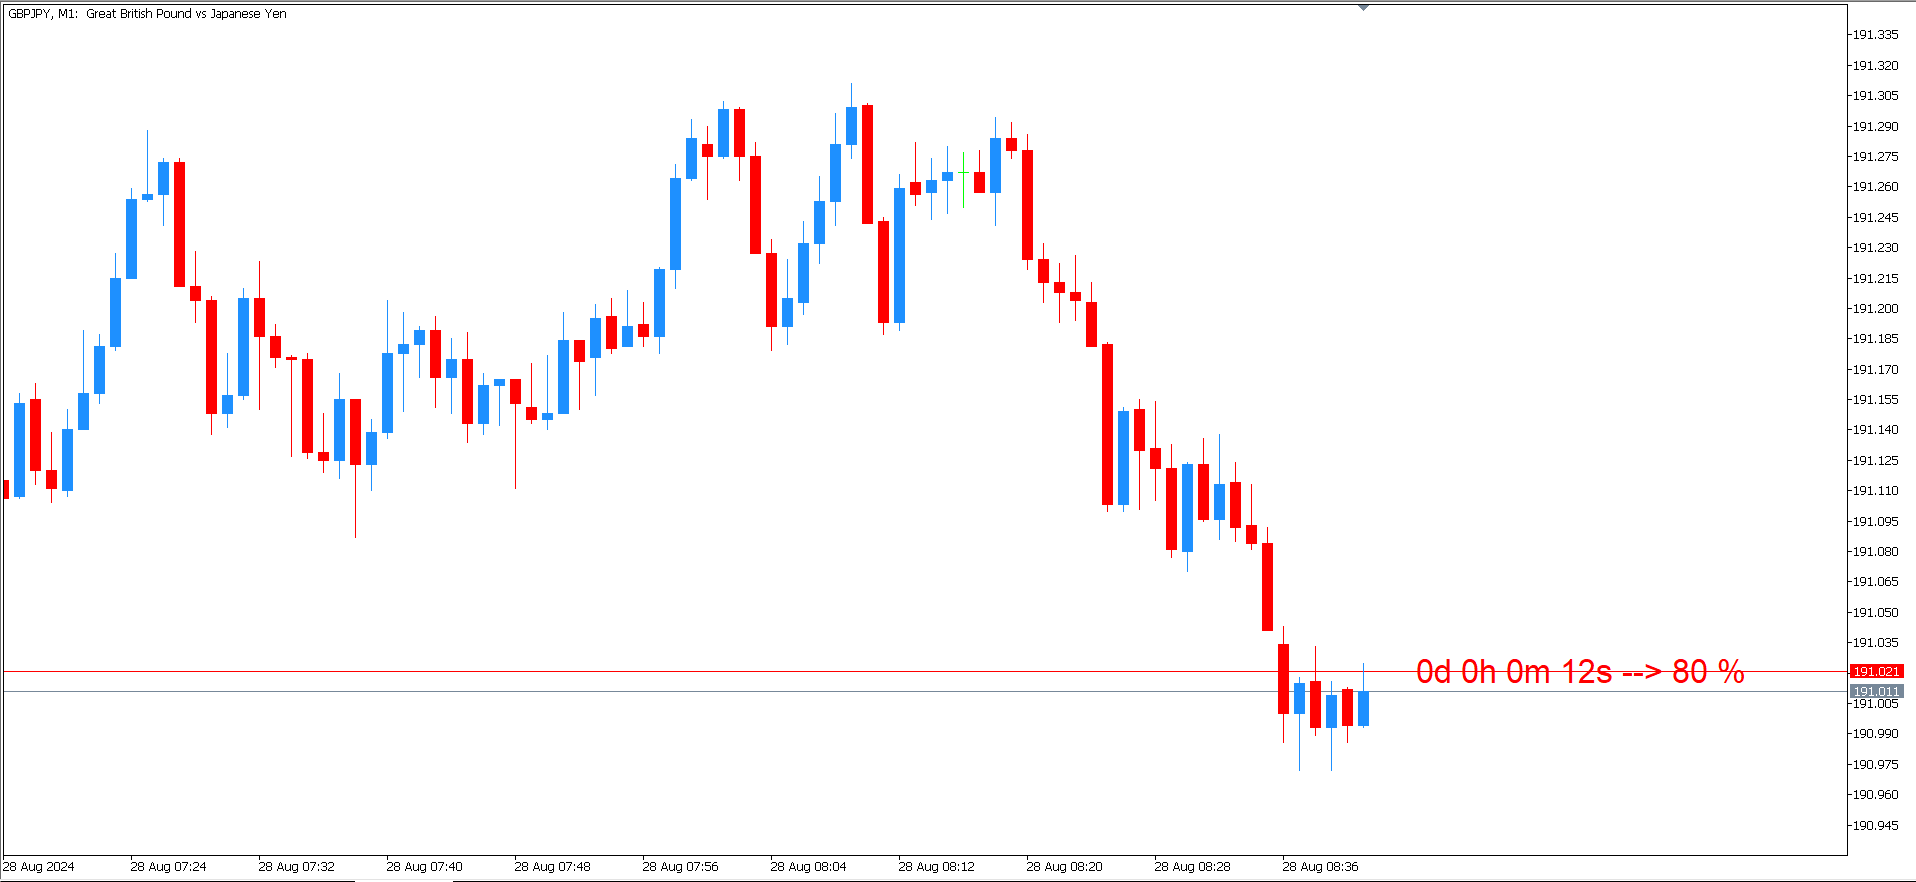
L'utilisateur peut configurer le pourcentage auquel le candle timer changera de couleur.
Voici les paramètres:
1 - Le pourcentage auquel le candle timer changera de couleur.
2 - couleur de la minuterie de la bougie, quand le pourcentage d'évolution de la bougie actuelle est EN DESSOU du pourcentage configuré par l'utilisateur;
3 - couleur de la minuterie de la bougie, quand le pourcentage d'évolution de la bougie actuelle est AU DESSU du pourcentage configuré par l'utilisateur;
4 - taille de la police;
5 - police (par exemple: "Arial");
6 - l'utilisateur peut ajouter son propre caractère entre la minuterie de la bougie et le pourcentage d'évolution de cette dernière.