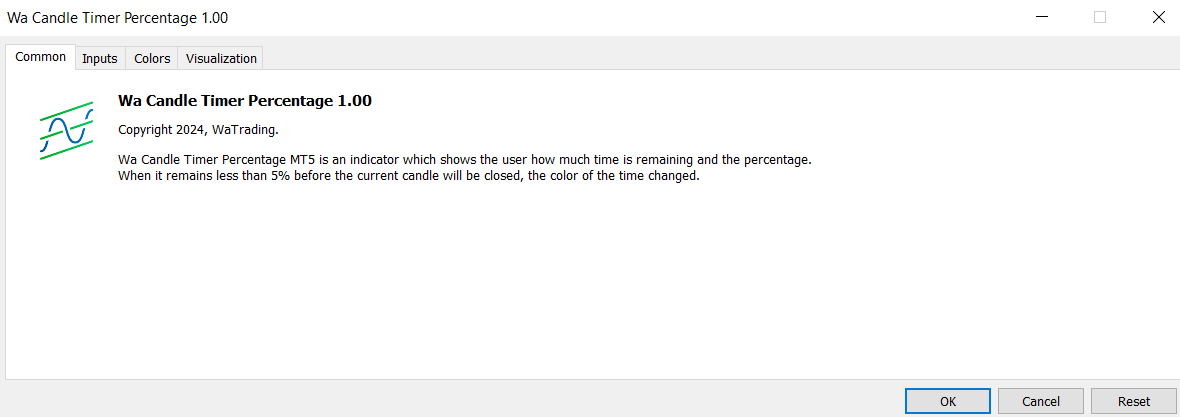
Wa Candle Timer Percentage
- Indicadores
- Wachinou Lionnel Pyrrhus Sovi Guidi
- Versão: 1.0
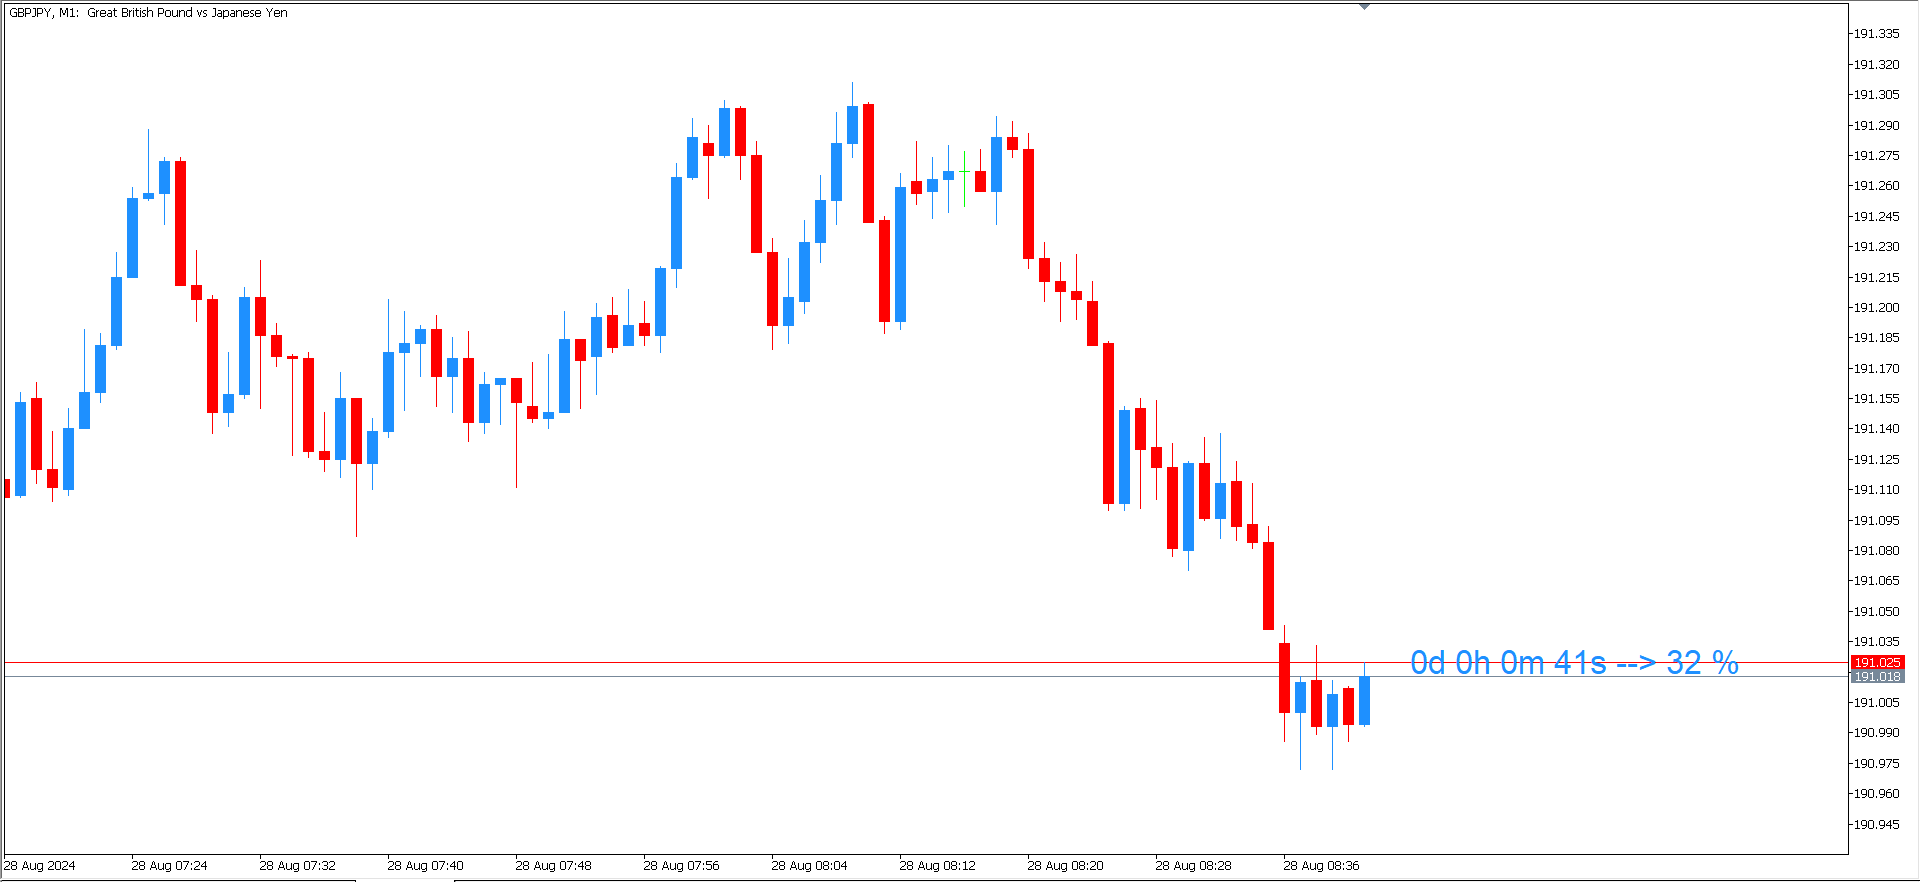
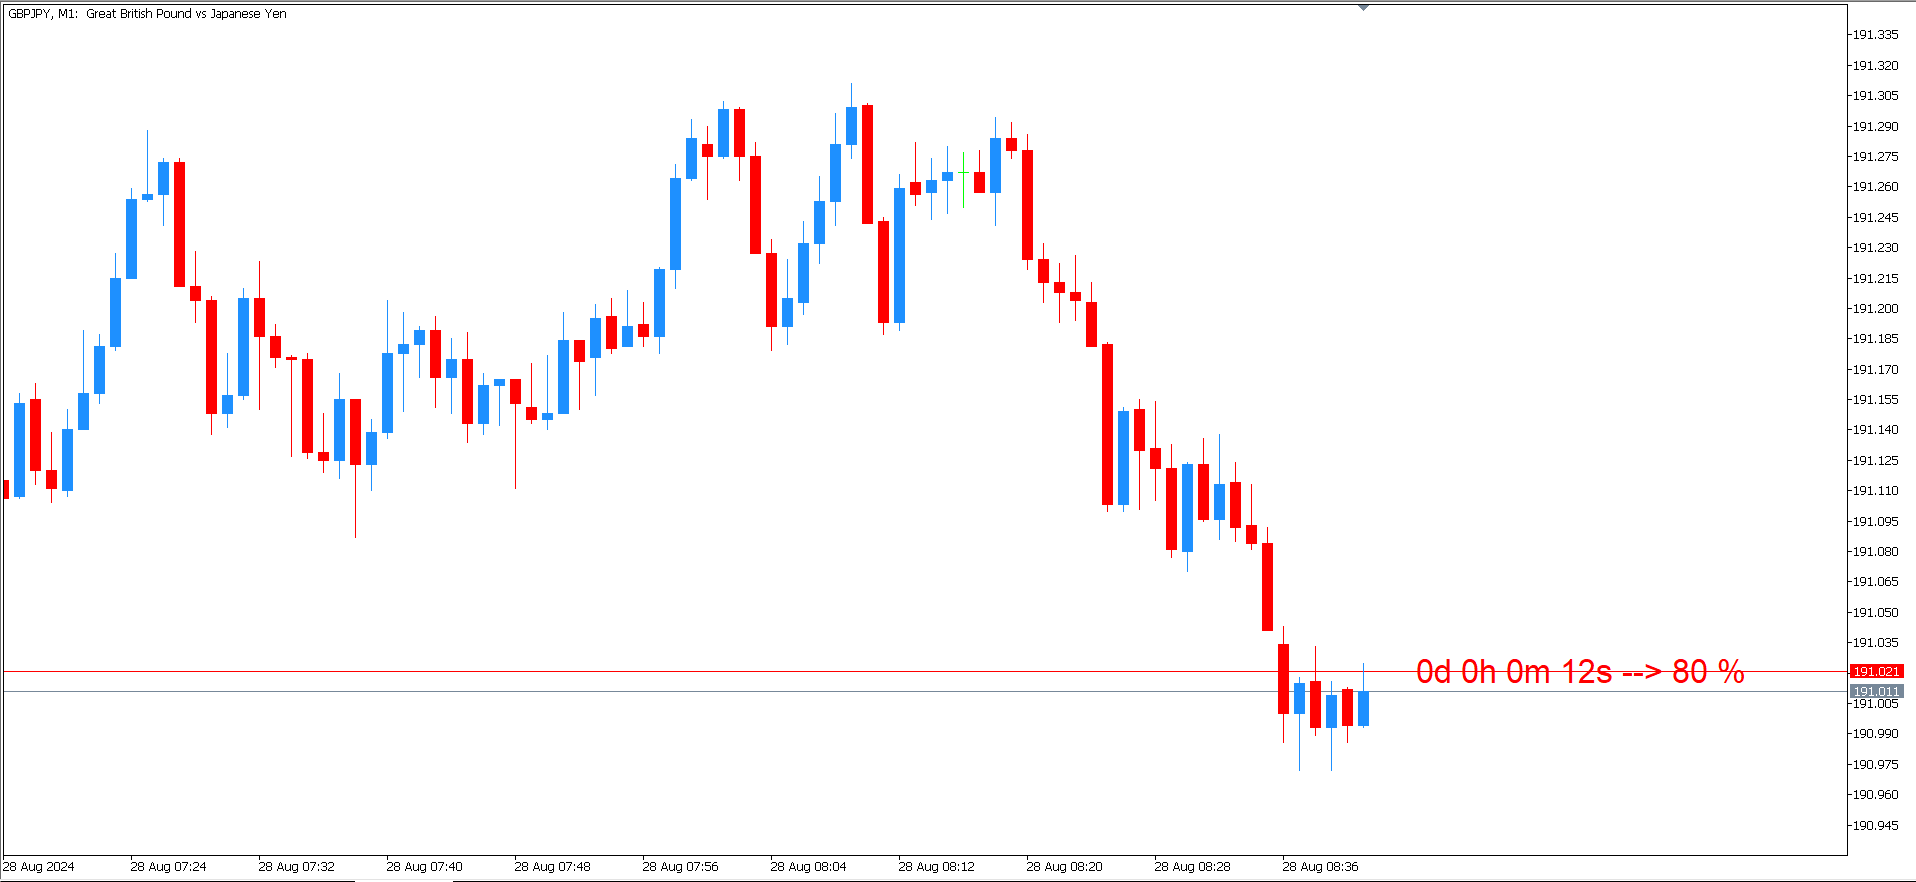
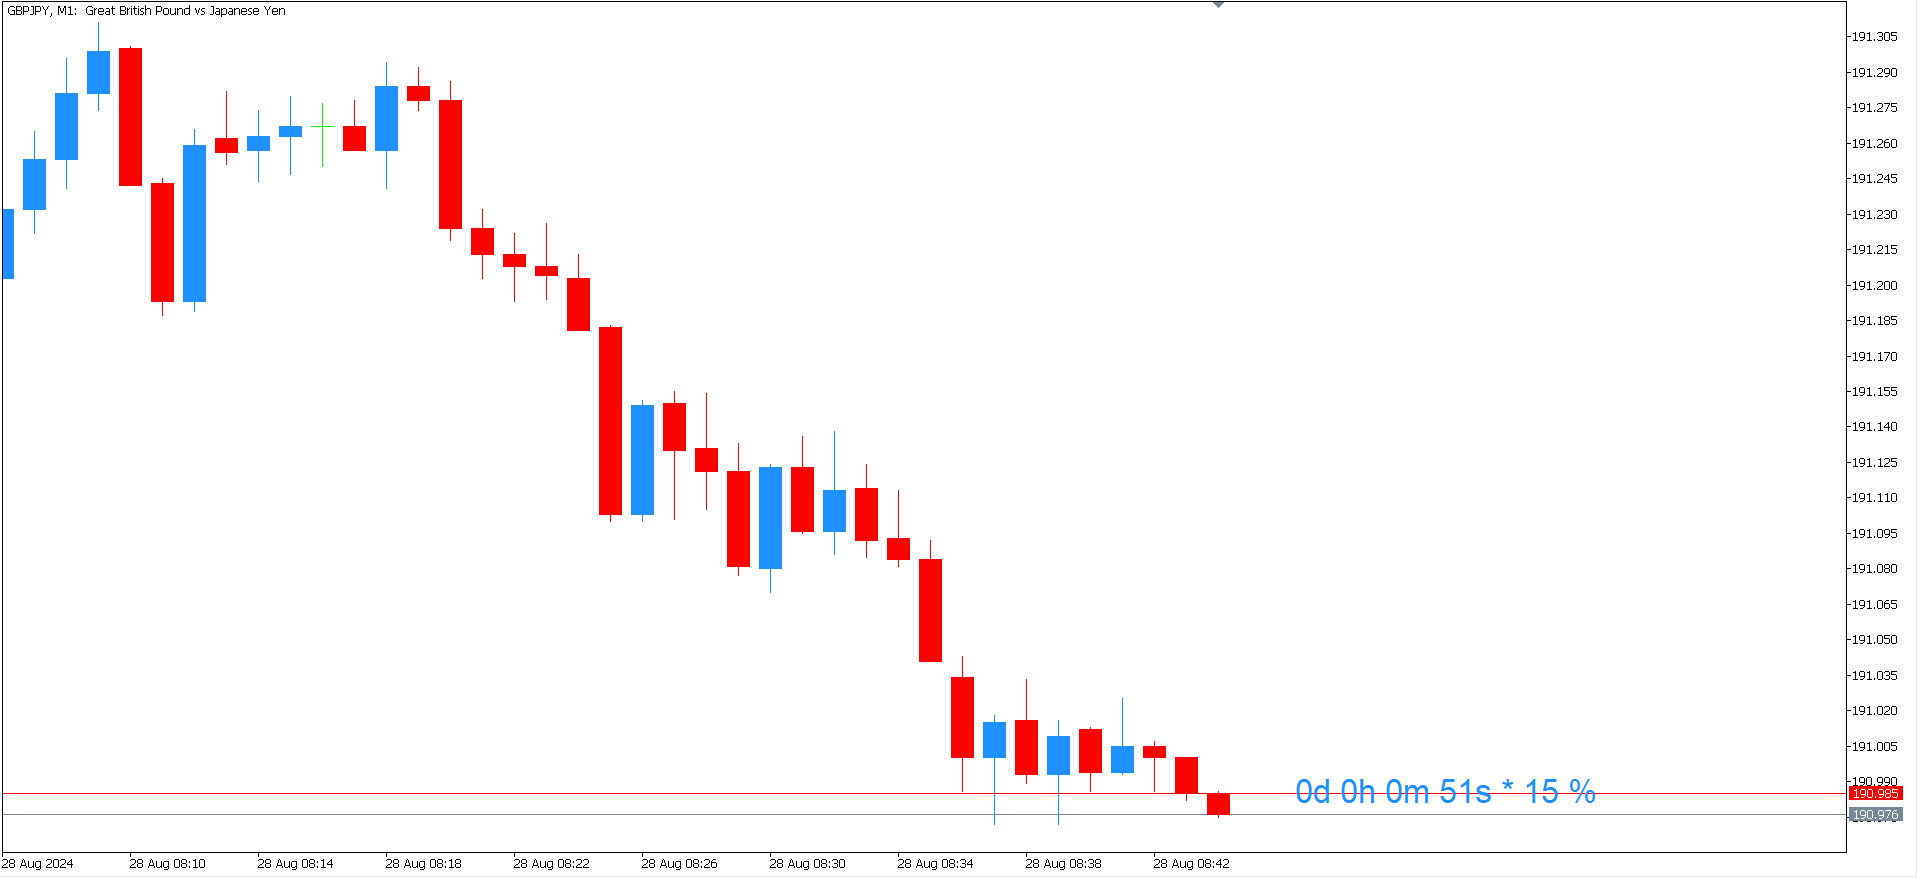
Wa Candle Timer Percentage MT4 is an indicator which shows the user how much time is remaining until the next candle will form.
The percentage of the evolution of the current candle is also displayed.
The user can set the percentage that the candle timer will change the color.
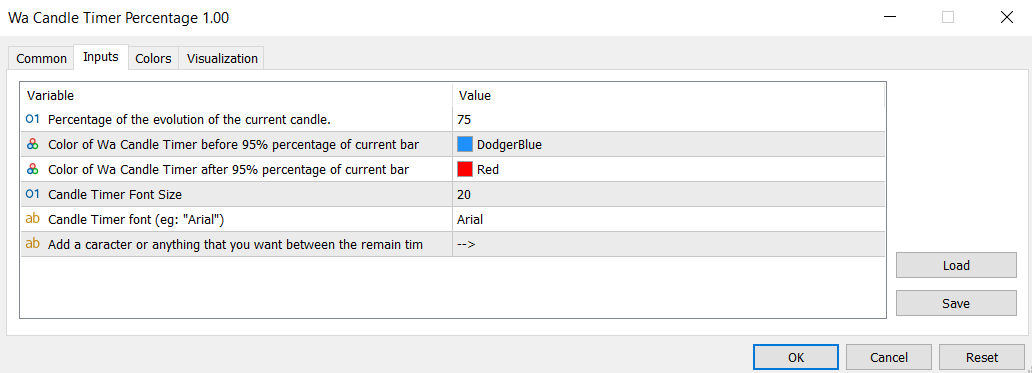
These are the settings:
1- The percentage that the candle timer will change the color.
2- Color of Candle Timer when it's BELOW the percentage set by the user.
3- Color of Candle Timer when it's ABOVE the percentage set by the user.
4- Candle Timer Font Size.
5- Candle Timer font (e.g.: "Arial").
6- The user can add his/her own character between the candle timer and the percentage.