• Aperçu
  • Avis
  • Commentaires

Better Volume for MT5

Améliorez Votre Performance de Trading avec l'Indicateur "Better Volume"

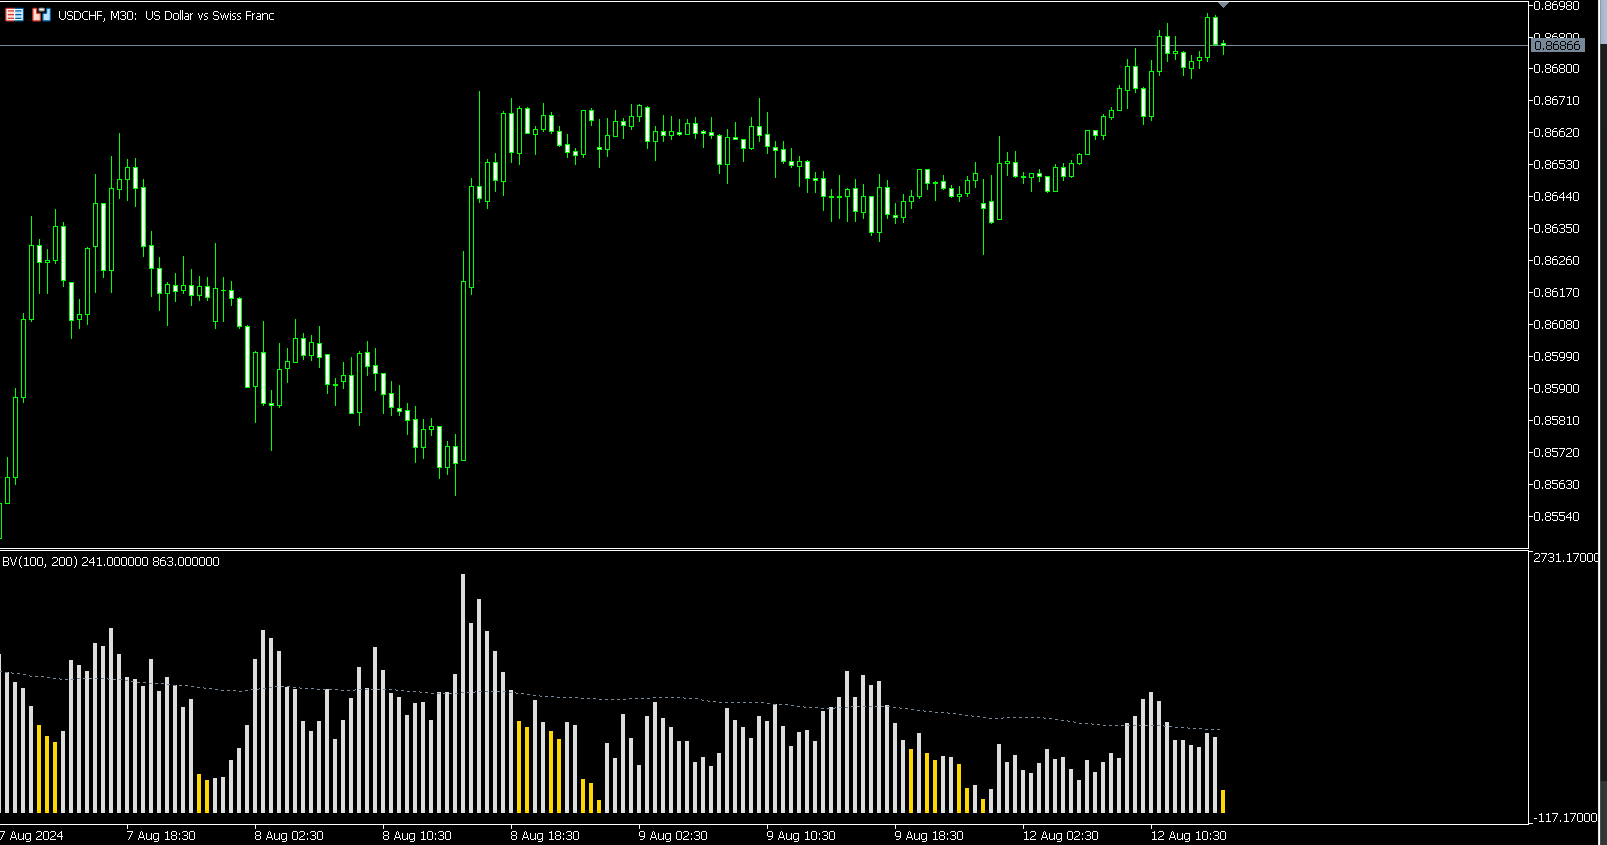
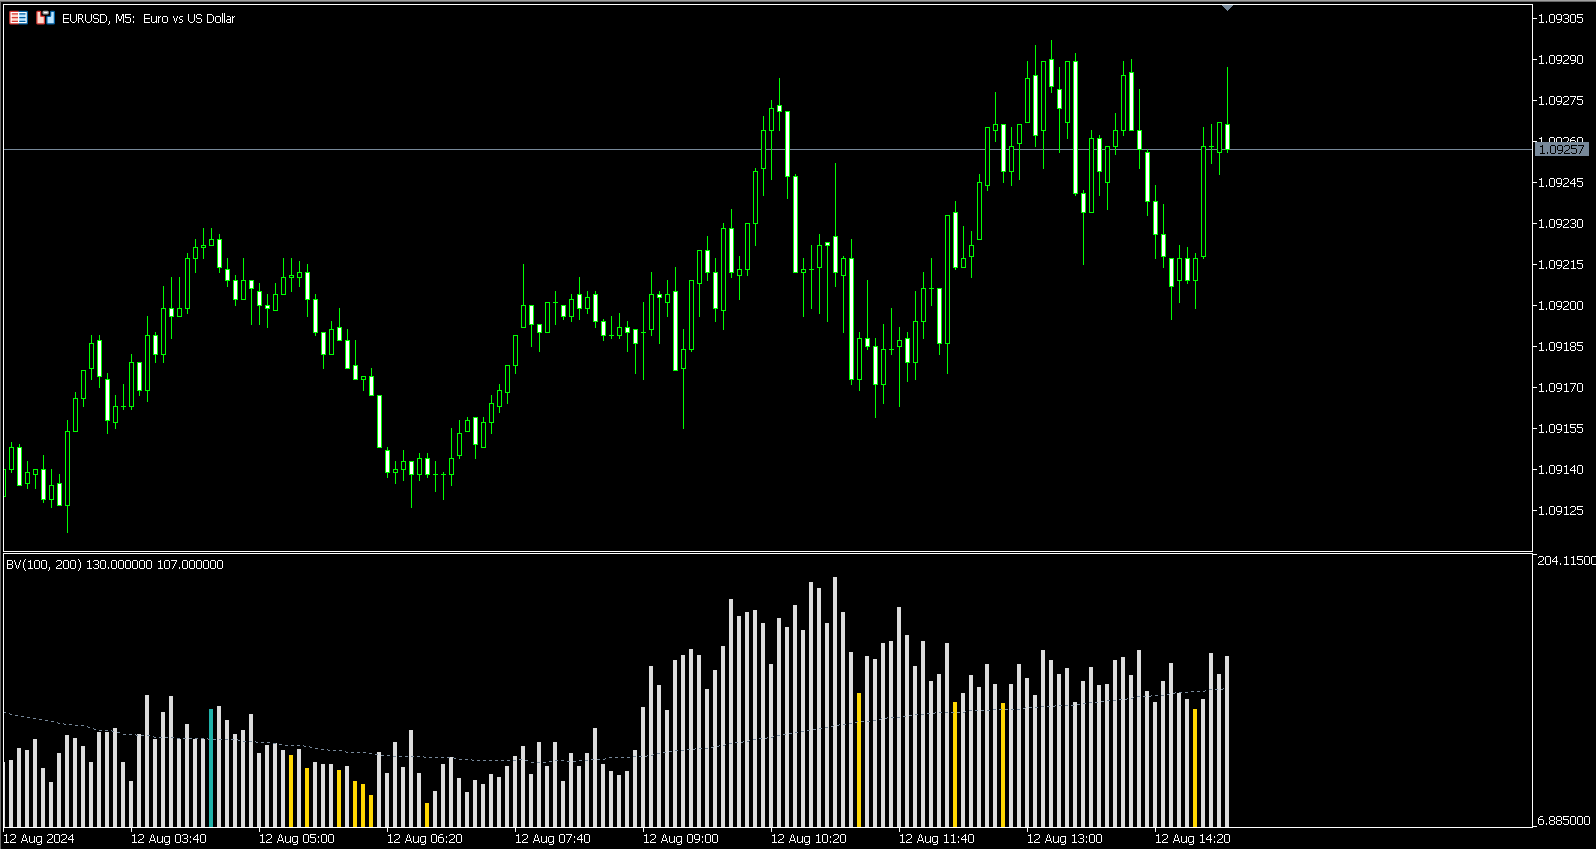
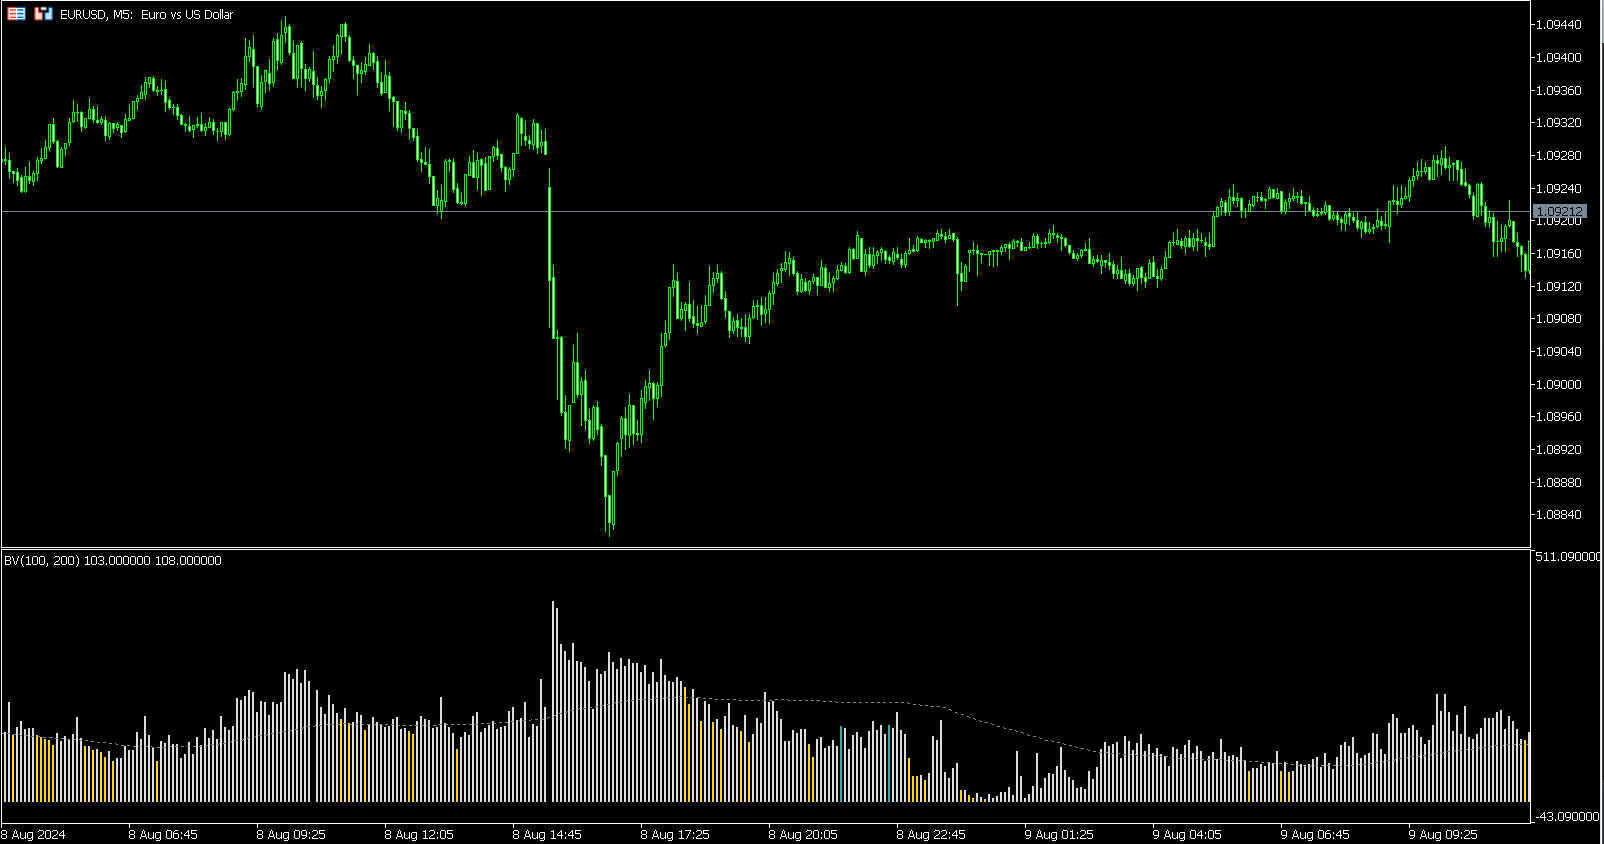
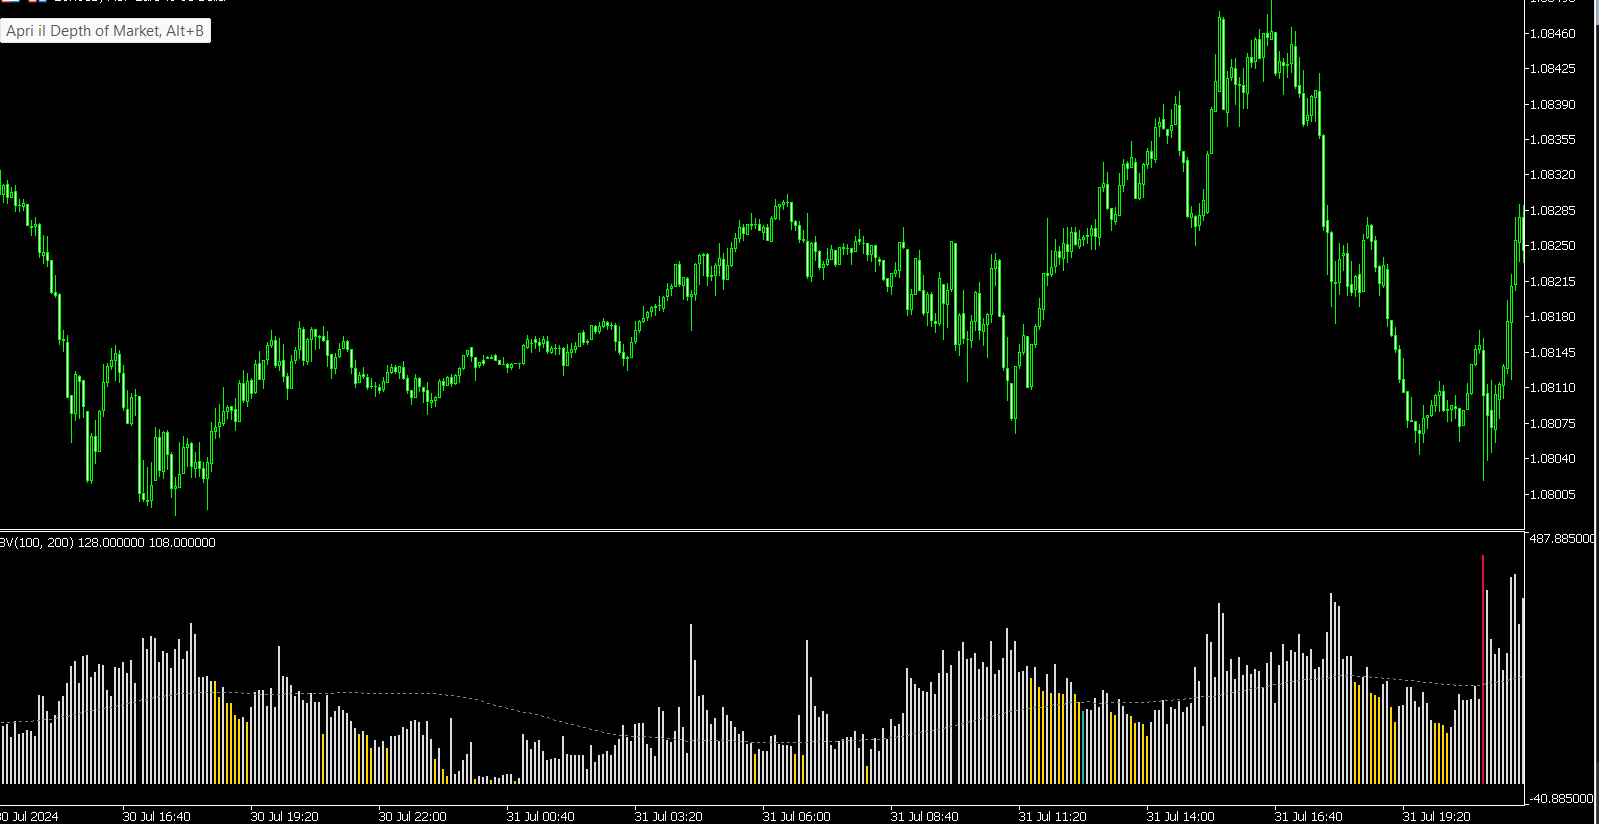
Découvrez l'Indicateur "Better Volume": Le "Better Volume" est l'outil essentiel d'analyse du volume du marché pour les traders souhaitant se démarquer. Il analyse les volumes de ticks avec une précision inégalée, grâce à sa fonction avancée de moyenne mobile (PERIOD_MA) et à des alertes d'achat et de vente personnalisables.

Caractéristiques Principales:

  • Analyse Avancée du Volume: Reconnaissez les pics de volume signalant des mouvements de prix cruciaux.
  • Alertes d'Achat et de Vente Intuitives: Restez toujours une longueur d'avance avec des notifications signalant les meilleures opportunités de trading.
  • Personnalisation Facile: Adaptez l'indicateur à vos besoins avec des entrées simples et intuitives.

Pourquoi "Better Volume"? Avec "Better Volume," vous pouvez :

  • Identifier précisément les meilleurs moments pour entrer et sortir du marché.
  • Augmenter votre efficacité de trading avec des signaux basés sur des volumes réels.
  • Vous adapter à toute stratégie de trading grâce à la flexibilité des entrées configurables.

Agissez Maintenant ! Ne manquez pas l'opportunité d'améliorer votre trading. Visitez notre page sur MQL5 et téléchargez dès aujourd'hui l'indicateur "Better Volume" pour commencer à trader avec la connaissance et la confiance que vous méritez !


Produits recommandés
MACD pondéré en fonction du volume La MACD pondérée en volume (VW-MACD) a été créée par Buff Dormeier et décrite dans son livre Investing With Volume Analysis. Il représente la convergence et la divergence des tendances des prix pondérés en fonction des volumes. L'inclusion du volume permet au VW-MACD d'être généralement plus réactif et fiable que le MACD traditionnel.   Qu'est-ce que la MACD (Moving Average Convergence Divergence) ? Moyenne mobile Convergence Divergence a été créé par
One of the Best Volume Indicators, with the addition of a Moving Average for weighting volume over time average. If the "Current Candle" Volume is X% greater than the Moving Average value, we will have a sign of increasing volume. It can be a sign of Beginning, Continuity, Reversal or Exhaustion of the Movement. Fully configurable and all options open, you can color and set ALL values as you see fit. The 'Volume Break' shows volume bars in the same color as the candlestick, in addition
WAPV Weis Wave Chart Forex
Eduardo Da Costa Custodio Santos
Le Weis Wave Chart Forex pour MT5 est un indicateur de prix et de volume. La lecture du prix et du volume a été largement diffusée par Richard Demille Wyckoff sur la base des trois lois qu'il a créées : l'offre et la demande, la cause et l'effet et l'effort contre le résultat. En 1900 R.Wyckoff utilisait déjà le wave chart dans ses analyses. De nombreuses années plus tard, vers 1990, David Weis a automatisé le diagramme d'onde de R. Wyckoff et aujourd'hui nous vous apportons l'évolution du diagr
Description The indicator uses market profile theory to show the most relevant trading zones, on a daily basis. The zones to be shown are LVN (low volume nodes) and POC (point of control). An LVN zone is one which represents price areas with the least time or volume throughout the day. Typically, these areas indicate a supply or demand initiative, and in the future, they can turn into important breakout or retracement zones. A POC zone is one which represents price areas with the most time or vo
The Volume+ and VSA Signals indicator for MT5 is based on the Volume Spread Analysis (VSA) methodology to provide the signals. The signals are displayed at closing of bars on the main window or subwindow in the form of symbols. The symbols are not repainting.  The indicator produces a signal on an individual bar and this signal is not buy or sell signal. When a minor trend goes in the opposite direction of a major trend, there are sequences of major trend-following signals that give a higher pro
Normalized Volume99% of indicators are based on price analysis. This indicator is based on volume. Volume is overlooked piece of information in most trading systems. And this is a big mistake since volume gives important information about market participants. Normalized Volume is an indicator that can be used to confirm reversal points. The indicator code volume with colors indicating high, normal and low volume. You could enhance dramatically your trading system using volume analysis. 
MACD Intraday Trend PRO est un indicateur développé grâce à une adaptation du MACD original créé par Gerald Appel dans les années 1960. Au fil des années de négociation, il a été observé qu'en modifiant les paramètres du MACD avec les proportions de Fibonacci, nous obtenons une meilleure présentation de la continuité des mouvements de tendance, ce qui permet de détecter plus efficacement le début et la fin d'une tendance de prix. En raison de son efficacité à détecter les tendances de prix,
The Volume Spread Analysis indicator is based on the original Volume Spread Analysis method. It was designed for quick and easy recognition of VSA patterns. Even though this indicator looks very simple, it is the most sophisticated tool we've ever made. It is a really powerful analytical tool that generates very reliable trading signals. Because it is very user-friendly and understandable, it is suitable for every type of trader, regardless of his experience. What is VSA? VSA - Volume Spread
Mean Volume indicator for MT5
Renaud Herve Francois Candel
Mean Volume Most indicators are based on price analysis. This indicator is based on volume. Volume is overlooked piece of information in most trading systems. And this is a big mistake since volume gives important information about market participants. Mean Volume is an indicator that can be used to spot when volume is above average. It usually means that institutional traders are active. Peak in volume can be used to confirm an entry since increased volume can sustain the move in one or
Wapv Price and volume
Eduardo Da Costa Custodio Santos
L'indicateur de prix et de volume WAPV pour MT5 fait partie de l'ensemble d'outils (Wyckoff Academy Wave Market) et (Wyckoff Academy Price and Volume). L'indicateur de prix et de volume WAPV pour MT5 a été créé pour faciliter la visualisation intuitive du mouvement du volume sur le graphique. Avec lui, vous pouvez observer les moments de pic de volume et les moments où le marché n'a aucun intérêt professionnel Identifiez les moments où le marché évolue par inertie et non par mouvement de "smart
Market Marker MT5
Evgeny Shevtsov
3.8 (5)
The indicator displays peak levels of activity formed by the maximum volume, tracks the correlation of the candles on all timeframes (from the highest to the lowest one). Each volume level is a kind of key trading activity. The most important cluster is inside a month, week, day, hour, etc. Indicator operation features A volume level receives Demand status if the nearest volume level located to the left and above has been broken upwards. A volume level receives Supply status if the nearest vol
Chaikin Money Flow
Jose Miguel Soriano
This indicator incorporates the volume to inform the market trend. A warning system (chart, SMS and e-mail) is incorporated for warning when a certain level is exceeded. Developed by Marc Chaikin, Chaikin Money Flow (CMF) measures the amount of Money Flow Volume (MFV) over a specific period. Money Flow Volume forms the basis for the Accumulation Distribution Line. Instead of a cumulative total of Money Flow Volume, Chaikin Money Flow simply sums Money Flow Volume for a specific look-back period.
PTS Demand Index MT5
PrecisionTradingSystems
Code PTS Demand Index par Precision Trading Systems Le Demand Index a été créé par James Sibbet et utilise un code complexe pour faciliter l'interprétation du volume et du prix en tant que combinaison. Comprendre les volumes n'est jamais une tâche facile, mais ce magnifique morceau de programmation simplifie certainement les choses. Il existe plusieurs façons dont cet indicateur peut bénéficier aux traders et aux investisseurs. Divergences (en tant qu'indicateur de premier plan) Apr
VolaMetrics VSA
Thalles Nascimento De Carvalho
VolaMetrics VSA est un indicateur technique avancé qui combine la méthodologie Volume Spread Analysis (VSA) avec une analyse détaillée du volume des transactions. Cet indicateur a été développé pour identifier et suivre les mouvements de prix significatifs sur le marché en utilisant l'interaction entre le volume et la variation des prix. Fondements de la Volume Spread Analysis (VSA) La VSA est une méthodologie qui analyse la relation entre le volume des transactions, la variation des prix (sprea
When looking at the volume information that moves the market, a question arises: is it a strong or weak movement? Should it be compared with previous days? These data should be normalized to always have a reference. This indicator reports the market volume normalized between 0-100 values. It has a line that smoothes the main signal (EMA). The normalization of values occurs within an interval defined by user (21 bars on default). User can also define any relative maximum, timeframe and number of
Reverse side scalper is the manual trading system, that works on choppy(anti-trend) market. As a rule markets are on 80% choppy and only 20% is trend phase. System is based on custom step Moving and RSI and reverse pattern. System defines up movement, down movement, trend / choppy phases. Indicator plots Buy signal arrow when current direction is down and phase is trend, Sell signal arrow is plotted when currently is up movement and phase is trend. As a rule it allows to "catch" local maximum/mi
A countdown timer for the  Volume bar chart generator  and  Tick chart generator  products, which are available for download from the MQL5 Market: Tick chart generator: https://www.mql5.com/en/market/product/29215 Volume bar chart generator: https://www.mql5.com/en/market/product/47197 The counter conveniently displays the number of ticks or transactions (depending on the chart) that need to pass for a new bar to start printing. The user can set the following indicator inputs. Volume type
FREE
Normalized OBV
Jose Miguel Soriano
When looking at the information of On Balance Volume indicator, a question arises: is it a strong or weak movement? Should it be compared with previous days? These data should be normalized to always have a reference. This indicator presents the followings parameters: Normalization period (Max-Mins absolute) Smoothing period (-1 off) Tick/Real Volume Maximum number of bars to calculate (-1 off) Upper value normalization Lower value normalization Calculation: normOBV = (value - absMin) * (relMa
Segmented Volume MT5
Eduardo Da Costa Custodio Santos
L'indicateur de volume segmenté MT5 a été créé pour faciliter ceux qui négocient en utilisant l'analyse des prix et des volumes, VSA, VPA, la méthode Wyckoff et le système Smart Money. Le volume segmenté fonctionne sur n'importe quel marché (Crypto, CFD, Forex, Futures, Actions...) et fonctionne à n'importe quel moment du graphique. Voyez à quel point votre interprétation est facile : #Vert : Volume bien supérieur à la moyenne du marché #Rose foncé : Volume supérieur à la moyenne #Bleu : Volume
Market Momentum PRO
Flavio Javier Jarabeck
The Market Momentum indicator is based on the Volume Zone Oscillator (VZO), presented by Waleed Aly Khalil in the 2009 edition of the International Federation of Technical Analysts journal, and presents a fresh view of this market valuable data that is oftenly misunderstood and neglected: VOLUME. With this new approach of "seeing" Volume data, traders can infer more properly market behavior and increase their odds in a winning trade. "The VZO is a leading volume oscillator; its basic usefulnes
Waves PRO
Flavio Javier Jarabeck
For those who appreciate Richard Wyckoff approach for reading the markets, we at Minions Labs designed a tool derived - yes, derived, we put our own vision and sauce into this indicator - which we called Waves PRO . This indicator provides a ZigZag controlled by the market volatility (ATR) to build its legs, AND on each ZigZag leg, we present the vital data statistics about it. Simple and objective. This indicator is also derived from the great book called " The Secret Science of Price and Volum
Do you use volume in your reading of the market? Certainly many traders use it, and do not imagine operating without it. The Color Histogram Volume Set indicator allows the user to choose the value that he considers interesting to monitor. When you pass this you will have visual confirmation and if you want you will also have the audible alert that is given by the indicator. Of course, there are other ways to try to find a high volume, such as assessing whether the volume
KT Renko Patterns MT5
KEENBASE SOFTWARE SOLUTIONS
KT Renko Patterns scans the Renko chart brick by brick to find some famous chart patterns that are frequently used by traders across the various financial markets. Compared to the time-based charts, patterns based trading is easier and more evident on Renko charts due to their uncluttered appearance. KT Renko Patterns features multiple Renko patterns, and many of these patterns are extensively explained in the book titled Profitable Trading with Renko Charts by Prashant Shah. A 100% automate
Hello Traders I have created this indicator to Catch SPIKES on Crash1000, Crash500 and Crash300. Follow the below mention instruction for better Result 1. When Red arrow pop up on the Chart, Take a Sell entry 2. Stay in trade until price break below from entry 3. Do not hold trades after all trades went in Blue 4. Keep adding position until spike cross below from intial entry See Example for more assistance
Top level indicator of exact buy and sell prices. Suitable for all symbols, you just have to choose a convenient trading activity. The indicator shows price rebound levels with the targets for entering and exiting a position. The commentary at each level states: what to do at the level (BUY/SELL); entry price; target exit price. In the parameters you need to select your trading activity: Long term investor Medium term investor Medium-term investor active Short term investor Short-term investor a
Wolfe Wave Scanner MT5
Reza Aghajanpour
5 (4)
**  All Symbols  x  All Timeframes  scan just by pressing scanner button ** *** Contact me after the purchase to send you instructions and add you in "Wolfe Wave Scanner group" for sharing or seeing experiences with other users. Introduction: A Wolfe Wave is created with five-wave patterns in price. It shows supply and demand and a fight towards a balance price. T hese waves of price actions can help traders identify the boundaries of   the trend . Also  It helps forecast how the price will mo
Volumes Direction MT5
William Oswaldo Mayorga Urduy
VOLUMES DIRECTION MT5 Normalement, l'indicateur de volume a un changement de couleur par défaut lorsque le volume actuel est plus élevé que le précédent, c'est important mais pas très utile. Pour cette raison, cet indicateur a été créé pour qu'en plus du volume normal, lorsque la bougie est haussière ou baissière, il les peint d'une couleur différente, par défaut bleu pour haussier et rouge pour baissier, mais ces couleurs peuvent être personnalisées selon le Le goût du commerçant. N'
White Weis Volume Ticks
Ricardo Almeida Branco
5 (3)
White Weis Volume This indicator shows the sum of the volume in each wave, bulish or bearish, as idealized by David Weis , but it brings an important addition , which is the marking of the bar with the highest volume of the wave (White Bar)! In coding the indicator, it was sought to optimize the code to require minimal processing during use and not to overload mt5. The indicator can be used for pre-trading analysis and study, where the trader analyzes possible points of support and resi
Introduction to Chart Pattern MT Chart Pattern MT is a chart pattern scanner to detect the triangle pattern, falling wedge pattern, rising wedge pattern, channel pattern and so on. Chart Pattern MT uses highly sophisticated chart pattern detection algorithm. However, we have designed it in the easy to use with intuitive user interface. Chart Pattern MT will show all the patterns in your chart in the most efficient format for your trading. You do not have to do tedious manual pattern detection an
This simple, yet powerful indicator is very good way to determine actual S/R levels. It's main purpose is making your overview on markets much better.It has built-in arrow signal system, which should be used along with MT indicators for best results.Just try it. Recommended MT indicators to use along: Bollinger Bands (default) RSI (period 3, levels 10/90)
Les acheteurs de ce produit ont également acheté
Atomic Analyst MT5
Issam Kassas
4.78 (18)
Tout d'abord, il convient de souligner que cet indicateur de trading n'est ni repainting, ni redrawing et ne présente aucun délai, ce qui le rend idéal à la fois pour le trading manuel et automatisé. Manuel de l'utilisateur : réglages, entrées et stratégie. L'Analyste Atomique est un indicateur d'action sur les prix PA qui utilise la force et le momentum du prix pour trouver un meilleur avantage sur le marché. Équipé de filtres avancés qui aident à éliminer les bruits et les faux signaux, et à
Tout d'abord, il convient de souligner que ce système de trading est un indicateur non repeint, non redessiné et non retardé, ce qui le rend idéal pour le trading manuel et automatisé. Cours en ligne, manuel et téléchargement de préréglages. Le "Système de Trading Smart Trend MT5" est une solution de trading complète conçue pour les traders débutants et expérimentés. Il combine plus de 10 indicateurs premium et propose plus de 7 stratégies de trading robustes, ce qui en fait un choix polyvalent
Gold Stuff mt5
Vasiliy Strukov
4.9 (182)
Gold Stuff mt5 est un indicateur de tendance conçu spécifiquement pour l'or et peut également être utilisé sur n'importe quel instrument financier. L'indicateur ne se redessine pas et ne traîne pas. Délai recommandé H1. Contactez-moi immédiatement après l'achat pour obtenir les réglages et un bonus personnel !   Vous pouvez obtenir une copie gratuite de notre indicateur Strong Support et Trend Scanner, veuillez envoyer un message privé. moi!   RÉGLAGES Dessiner la flèche - on off. dessine
Quantum Trend Sniper
Bogdan Ion Puscasu
4.92 (48)
Présentation       Quantum Trend Sniper Indicator   , l'indicateur révolutionnaire MQL5 qui transforme la façon dont vous identifiez et négociez les inversions de tendance ! Développé par une équipe de traders expérimentés avec une expérience commerciale de plus de 13 ans,       Indicateur Quantum Trend Sniper       est conçu pour propulser votre parcours de trading vers de nouveaux sommets grâce à sa manière innovante d'identifier les inversions de tendance avec une précision extrêmement élevée
TPSproTREND PrO MT5
Roman Podpora
4.89 (9)
TPSpro TREND PRO  - is a trend indicator that automatically analyzes the market and provides information about the trend and each of its changes, as well as giving signals for entering trades without redrawing! The indicator uses each candle, analyzing them separately. referring to different impulses - up or down impulse. Exact entry points into transactions for currencies, crypto, metals, stocks, indices!  Version MT4               DETAILED DESCRIPTION               R ecommended to use with an
TPSpro RFI Levels MT5
Roman Podpora
4.67 (9)
Reversal First Impulse levels (RFI)      INSTRUCTIONS        RUS       -       ENG              R ecommended to use with an indicator   -   TPSpro  TREND PRO -  Version MT4                 A key element in trading is zones or levels from which decisions to buy or sell a trading instrument are made. Despite attempts by major players to conceal their presence in the market, they inevitably leave traces. Our task was to learn how to identify these traces and interpret them correctly. Main functi
Trend Screener Pro MT5
STE S.S.COMPANY
4.88 (67)
Indicateur de tendance, solution unique révolutionnaire pour le trading et le filtrage des tendances avec toutes les fonctionnalités de tendance importantes intégrées dans un seul outil ! Il s'agit d'un indicateur multi-période et multi-devises 100 % non repeint qui peut être utilisé sur tous les symboles/instruments : forex, matières premières, crypto-monnaies, indices et actions. Trend Screener est un indicateur de suivi de tendance efficace qui fournit des signaux de tendance fléchés avec des
Tout d'abord, il convient de souligner que cet outil de trading est un indicateur non repeint, non redessiné et non retardé, ce qui le rend idéal pour le trading professionnel. Cours en ligne, manuel utilisateur et démonstration. L'indicateur Smart Price Action Concepts est un outil très puissant à la fois pour les nouveaux et les traders expérimentés. Il regroupe plus de 20 indicateurs utiles en un seul, combinant des idées de trading avancées telles que l'analyse du trader Inner Circle et
Ce tableau de bord affiche les derniers   modèles harmoniques   disponibles pour les symboles sélectionnés, ce qui vous permettra de gagner du temps et d'être plus efficace /   version MT4 . Indicateur gratuit:   Basic Harmonic Pattern Colonnes de l'indicateur Symbol :   les symboles sélectionnés apparaissent Trend   :   haussière ou baissière Pattern :   type de motif (gartley, papillon, chauve-souris, crabe, requin, cypher ou ABCD) Entry:   prix d'entrée SL:   prix du stop loss TP1:   1
FX Power MT5 NG
Daniel Stein
5 (6)
Obtenez votre mise à jour quotidienne du marché avec des détails et des captures d'écran via notre Morning Briefing ici sur mql5 et sur Telegram ! FX Power MT5 NG est la nouvelle génération de notre très populaire indicateur de force des devises, FX Power. Et qu'est-ce que ce compteur de force de nouvelle génération offre ? Tout ce que vous avez aimé de l'original FX Power PLUS Analyse de la force de l'OR/XAU Des résultats de calcul encore plus précis Périodes d'analyse configurables individuel
IX Power MT5
Daniel Stein
4.17 (6)
IX Power   apporte enfin la précision imbattable de FX Power aux symboles non-Forex. Il détermine avec précision l'intensité des tendances à court, moyen et long terme de vos indices, actions, matières premières, ETF et même crypto-monnaies préférés. Vous pouvez   analyser tout ce que   votre terminal a à offrir. Essayez-le et découvrez comment   votre timing s'améliore considérablement   lors de vos transactions. Caractéristiques principales d'IX Power Résultats de calcul précis à 100 %,
XQ Indicator MetaTrader 5
Marzena Maria Szmit
5 (1)
Step into the realm of Forex trading with confidence and precision using XQ, a cutting-edge Forex indicator designed to elevate your trading game to unprecedented heights. Whether you're a seasoned trader or just stepping into the world of currency exchange, XQ Forex Indicator empowers you with the insights and signals needed to make informed trading decisions. The signal conditions are a combination of three indicators, and XQ Forex Indicator only display  medium and long-term trends . The ind
AW Trend Predictor MT5
AW Trading Software Limited
4.78 (58)
La combinaison des niveaux de tendance et de panne dans un seul système. Un algorithme d'indicateur avancé filtre le bruit du marché, détermine la tendance, les points d'entrée, ainsi que les niveaux de sortie possibles. Les signaux indicateurs sont enregistrés dans un module statistique, qui vous permet de sélectionner les outils les plus appropriés, montrant l'efficacité de l'historique des signaux. L'indicateur calcule les marques Take Profit et Stop Loss. Manuel et instruction ->   ICI   / v
Gartley Hunter Multi
Siarhei Vashchylka
5 (8)
Gartley Hunter Multi - An indicator for searching for harmonic patterns simultaneously on dozens of trading instruments and on all possible timeframes. Manual (Be sure to read before purchasing) | Version for MT4 Advantages 1. Patterns: Gartley, Butterfly, Shark, Crab. Bat, Alternate Bat, Deep Crab, Cypher 2. Simultaneous search for patterns on dozens of trading instruments and on all possible timeframes 3. Search for patterns of all possible sizes. From the smallest to the largest 4. A
Top indicator for MT5   providing accurate signals to enter a trade without repainting! It can be applied to any financial assets:   forex, cryptocurrencies, metals, stocks, indices .  Watch  the video  (6:22) with an example of processing only one signal that paid off the indicator! MT4 version is here It will provide pretty accurate trading signals and tell you when it's best to open a trade and close it. Most traders improve their trading results during the first trading week with the help of
PZ Swing Trading MT5
PZ TRADING SLU
5 (4)
Protect against whipsaws: revolutionize your swing trading approach Special Offer: Purchase now to receive free bonuses worth $159! (Read more for details) Swing Trading is the first indicator designed to detect swings in the direction of the trend and possible reversal swings. It uses the baseline swing trading approach, widely described in trading literature. The indicator studies several price and time vectors to track the aggregate trend direction and detects situations in which the market i
Bill Williams Advanced
Siarhei Vashchylka
5 (7)
Bill Williams Advanced is designed for automatic chart analysis using Bill Williams' "Profitunity" system. The indicator analyzes four timeframes at once. Manual (Be sure to read before purchasing) Advantages 1. Automatically analyzes the chart using the "Profitunity" system of Bill Williams. The found signals are placed in a table in the corner of the screen. 2. Equipped with a trend filter based on the Alligator indicator. Most of the system signals are recommended to be used only accordi
ICT, SMC, SMART MONEY CONCEPTS, SMART MONEY, Smart Money Concept, Support and Resistance, Trend Analysis, Price Action, Market Structure, Order Blocks, BOS/CHoCH,   Breaker Blocks ,  Momentum Shift,   Supply&Demand Zone/Order Blocks , Strong Imbalance,   HH/LL/HL/LH,    Fair Value Gap, FVG,  Premium  &   Discount   Zones, Fibonacci Retracement, OTE, Buy Side Liquidity, Sell Side Liquidity, BSL/SSL Taken, Equal Highs & Lows, MTF Dashboard, Multiple Time Frame, BigBar, HTF OB, HTF Market Structure
Blahtech Supply Demand MT5
Blahtech Limited
4.54 (13)
Was: $299  Now: $99   Supply Demand uses previous price action to identify potential imbalances between buyers and sellers. The key is to identify the better odds zones, not just the untouched ones. Blahtech Supply Demand indicator delivers functionality previously unavailable on any trading platform. This 4-in-1 indicator not only highlights the higher probability zones using a multi-criteria strength engine, but also combines it with multi-timeframe trend analysis, previously confirmed swings
Trend Forecaster
Alexey Minkov
5 (6)
The Trend Forecaster indicator utilizes a unique proprietary algorithm to determine entry points for a breakout trading strategy. The indicator identifies price clusters, analyzes price movement near levels, and provides a signal when the price breaks through a level. The Trend Forecaster indicator is suitable for all financial assets, including currencies (Forex), metals, stocks, indices, and cryptocurrencies. You can also adjust the indicator to work on any time frames, although it is recommen
AT Forex Indicator MT5
Marzena Maria Szmit
5 (4)
The AT Forex Indicator MT5 is a sophisticated trading tool designed to provide traders with a comprehensive analysis of multiple currency pairs. This powerful indicator simplifies the complex nature of the forex market, making it accessible for both novice and experienced traders. AT Forex Indicator uses advanced algorithms to detect trends, patterns and is an essential tool for traders aiming to enhance their forex trading performance. With its robust features, ease of use, and reliable signal
Advanced Supply Demand MT5
Bernhard Schweigert
4.53 (15)
La meilleure solution pour tout commerçant débutant ou expert ! Cet indicateur est un outil de trading unique, de haute qualité et abordable car nous avons intégré un certain nombre de fonctionnalités propriétaires et une nouvelle formule. Avec cette mise à jour, vous pourrez afficher des zones à double horaire. Vous pourrez non seulement afficher un TF plus élevé, mais afficher les deux, le graphique TF, PLUS le TF supérieur : AFFICHAGE DES ZONES NICHÉES. Tous les traders Supply Demand vont ado
Easy By Sell is a market indicator for opening and closing positions. It becomes easy to track market entries with alerts. It indicates trend reversal points when a price reaches extreme values ​​and the most favorable time to enter the market. it is as effective as a Fibonacci to find a level but it uses different tools such as an algorithm based on ATR indicators and Stochastic Oscillator. You can modify these two parameters as you wish to adapt the settings to the desired period. My othe
L'indicateur indique les points d'entrée et de sortie les plus appropriés. Il affiche également des données statistiques sur tous les signaux pour une meilleure analyse du trading. Grâce à cet indicateur, vous pourrez mieux comprendre le marché. Dès que la puissance de la tendance commence à s'affaiblir (ce qui sera indiqué sur le panneau), la ligne de tendance gravitera vers la position horizontale - c'est le signal pour sortir du trade. Vous pouvez également sortir lorsque le niveau de pro
Le profit de la structure du marché change à mesure que le prix s'inverse et recule. L'indicateur d'alerte d'inversion de la structure du marché identifie le moment où une tendance ou un mouvement de prix approche de l'épuisement et est prêt à s'inverser. Il vous avertit des changements dans la structure du marché qui se produisent généralement lorsqu'un renversement ou un recul majeur est sur le point de se produire. L'indicateur identifie initialement les cassures et la dynamique des prix,
FX Volume MT5
Daniel Stein
4.94 (17)
Obtenez votre mise à jour quotidienne du marché avec des détails et des captures d'écran via notre Morning Briefing ici sur mql5 et sur Telegram ! FX Volume est le PREMIER et SEUL indicateur de volume qui fournit un VRAI aperçu du sentiment du marché du point de vue d'un courtier. Il fournit des informations impressionnantes sur la façon dont les acteurs institutionnels du marché, comme les courtiers, sont positionnés sur le marché des changes, bien plus rapidement que les rapports COT. Voir c
IVISTscalp5
Vadym Zhukovskyi
5 (5)
Nous vous présentons l'indicateur iVISTscalp5, qui est non seulement unique, mais également efficace dans les opérations de trading. Cet indicateur est basé sur des données temporelles et est le résultat de nombreuses années d'expérience et d'analyse approfondie des marchés financiers. L'indicateur iVISTscalp5 est un excellent outil pour le trading manuel. La commodité, la simplicité et la visualisation - toute la complexité est cachée à l'intérieur. Nous avons simplifié au maximum les paramètre
Legacy of Gann for MT5
Pavel Zamoshnikov
5 (6)
The indicator very accurately determines the levels of the possible end of the trend and profit fixing. The method of determining levels is based on the ideas of W.D.Gann, using an algorithm developed by his follower Kirill Borovsky. Extremely high reliability of reaching levels (according to K. Borovsky  - 80-90%) Indispensable for any trading strategy – every trader needs to determine the exit point from the market! Precisely determines targets on any timeframes and any instruments (forex, met
Présentation       Quantum Breakout PRO   , l'indicateur révolutionnaire MQL5 qui transforme la façon dont vous négociez les zones d'évasion ! Développé par une équipe de traders expérimentés avec une expérience commerciale de plus de 13 ans,       Évasion quantique PRO       est conçu pour propulser votre parcours commercial vers de nouveaux sommets grâce à sa stratégie de zone de discussion innovante et dynamique. Quantum Breakout Indicator vous donnera des flèches de signalisation sur le
Volatility Trend System - est un système commercial qui fournit des signaux pour les entrées. Le système de volatilité donne des signaux linéaires et ponctuels dans le sens de la tendance, ainsi que des signaux pour en sortir, sans redessin ni délai. L'indicateur de tendance surveille la direction de la tendance à moyen terme, montre la direction et son changement. L'indicateur de signal est basé sur les changements de volatilité et montre les entrées sur le marché. L'indicateur est équipé
Plus de l'auteur
Améliorez Vos Stratégies de Trading avec l'Indicateur "Order Block" pour MT4 Découvrez l'Indicateur "Order Block": L'Indicateur "Order Block" pour MT4 est conçu pour vous aider à identifier précisément les blocs d'ordres sur le marché, en marquant les sommets et les creux des bougies de blocs d'ordres. Cet outil puissant vous permet de comprendre où les grandes institutions placent leurs ordres, améliorant ainsi votre capacité à prévoir les mouvements du marché. Caractéristiques Principales: Dét
IMPORTANT: The indicator will remain at the price of $34.90 until the release of the update scheduled for July 16, 2024. The New Price will be $49.90 (taxes excluded) FVG indicator. If you are an SMC trader this indicator will be very useful to you, it automatically identifies the FVGs on the graph distinguishing them into 2 types: bearish FVGs and bullish FVGs (see the photos to understand better). This indicator works on any Timeframe and on any market you want to use it. If you are interested
FREE Spread indicator for MetaTrader 4 this indicator includes: -average spread -current spread -minimum spread -maximum spread If you are interested in my products I recommend you visit my page where you can find: Experts Advisors:  https://www.mql5.com/it/market/product/119456?source=Site+Profile indicators:  https://www.mql5.com/it/market/product/120038?source=Site+Profile I hope the spread indicator will be useful to you. https://www.mql5.com/it/users/kappa05
FREE
Indicateur Profil de Volume pour MT4 Obtenez un avantage en trading avec l'indicateur "Profil de Volume" pour MetaTrader 4 (MT4). Cet outil avancé d'analyse technique vous permet d'identifier avec précision les niveaux clés de support et de résistance basés sur le volume des transactions. Visualisez facilement les zones d'intérêt du marché, où les volumes d'échange sont les plus élevés, et utilisez ces informations pour prendre des décisions de trading plus éclairées. Caractéristiques principale
Présentation de l'"Indicateur de Plage de Couleur" L'"Indicateur de Plage de Couleur" est un outil puissant d'analyse technique conçu pour la plateforme MT4, parfait pour les traders qui souhaitent avoir une vue claire et immédiate des tendances du marché. Cet indicateur trace une ligne colorée en fonction de la tendance actuelle, facilitant l'interprétation des mouvements de prix. Description de l'indicateur : Ligne verte : Indique une tendance haussière. Utilisez ce signal pour envisager des o
Indicateur de bloc de commande, hauts et bas ; l'indicateur se concentre principalement sur les OB, sur le graphique, ils sont représentés par une ligne horizontale sur le minimum et le maximum de cette candle. Alors que pour les maximums et les minimums une seule ligne est marquée (voir les images pour mieux comprendre). L'indicateur est pour MT5, il fonctionne sur tous les TimeFrame, sur tous le paire Forex, sur toud les indice et sur les marchés de crypto (Pour toute les  information sur l'in
Expert Advisor for scalping; This EA was built for monthly profitability. Works on any asset: Forex, Indices, Crypto and Stocks. Perfectly usable in MT5 tester and usable on any TimeFrame. The EA has various inputs available to customize operations: -Lots -Risk% (0 = Fix) -OrderDist (the distance between one order and another, the distance is calculated in points not pips) -TP (in points) -Sl (in points) -TrailingStopTrigger(the trailing stop trigger point in points) -TrailingStop(distance from
Highs, Lows and Bos Indicator for MT5; The indicator works on any type of market and on all TimeFrames. It also works on the MetaTrader5 Tester. the main function of the indicator is to identify the highs and lows by marking them with a point above/below the candle, then with a horizontal line it marks the Bos. It is very simple and intuitive, there are only 2 inputs: -the color of the maximums -the color of the minima For any other information do not hesitate to contact me.
Panel Info Trade For MT5; The indicator has 2 main objects: -An icon chart that you can change Timeframe, zoom, Forex Pair, crypto....the position of the graph can be modified via the (x;y) inputs. The chart is perfectly usable in the MT5 tester. If the graph isn't for you and doesn't help you with anything, you can press the button on the top right to make it smaller. -the second object is a dynamic control panel where you can change plots, place sl and tp, BE, close partial... (if you watch th
Indicateur de Force de la Monnaie (Currency Strength Index - CSI) AVANT D'ACTIVER L'INDICATEUR, RAPPELEZ-VOUS DE METTRE "TRUE" POUR AFFICHER LES PAIRES L'indicateur de Force de la Monnaie (Currency Strength Index - CSI) est un outil puissant utilisé dans le trading forex pour mesurer la force relative des principales devises. Cet indicateur aide les traders à identifier les devises les plus fortes et les plus faibles à un moment donné, leur permettant de prendre des décisions de trading plus in
Dans le monde du trading, la clé du succès réside dans la possession des bons outils au bon moment. Notre indicateur de profil de volume innovant a été développé avec un seul objectif en tête : offrir aux traders un accès sans précédent aux informations essentielles sur l'activité du marché. Cet outil de pointe vous permet de voir non seulement où et quand les volumes sont échangés, mais aussi de comprendre la profondeur du marché avec une clarté jamais vue auparavant. Caractéristiques Principal
Maximisez Vos Opportunités de Trading avec l'Indicateur "Auto Trendlines" Découvrez l'Indicateur "Auto Trendlines": "Auto Trendlines" est l'outil essentiel pour tout trader technique. Cet indicateur trace automatiquement les lignes de tendance, identifiant les niveaux de soutien et de résistance avec une précision chirurgicale. Il est idéal pour ceux qui cherchent à capitaliser sur les breakouts et les renversements du marché. Caractéristiques Principales: Traçage Automatique des Lignes de Tenda
Optimisez Vos Décisions de Trading avec l'Indicateur "autoFibo" Découvrez l'Indicateur "autoFibo": "autoFibo" est l'outil d'analyse essentiel pour les traders souhaitant exploiter pleinement les niveaux de Fibonacci sans avoir à les tracer manuellement. Cet indicateur automatise le processus de retracement de Fibonacci, offrant un accès visuel instantané aux zones clés de support et de résistance. Caractéristiques Principales: Retracement Automatique de Fibonacci: Trace automatiquement les nivea
Filtrer:
Aucun avis
Répondre à l'avis