• Übersicht
  • Bewertungen
  • Diskussion

Better Volume for MT5

Verbessere deine Trading-Leistung mit dem "Better Volume" Indikator

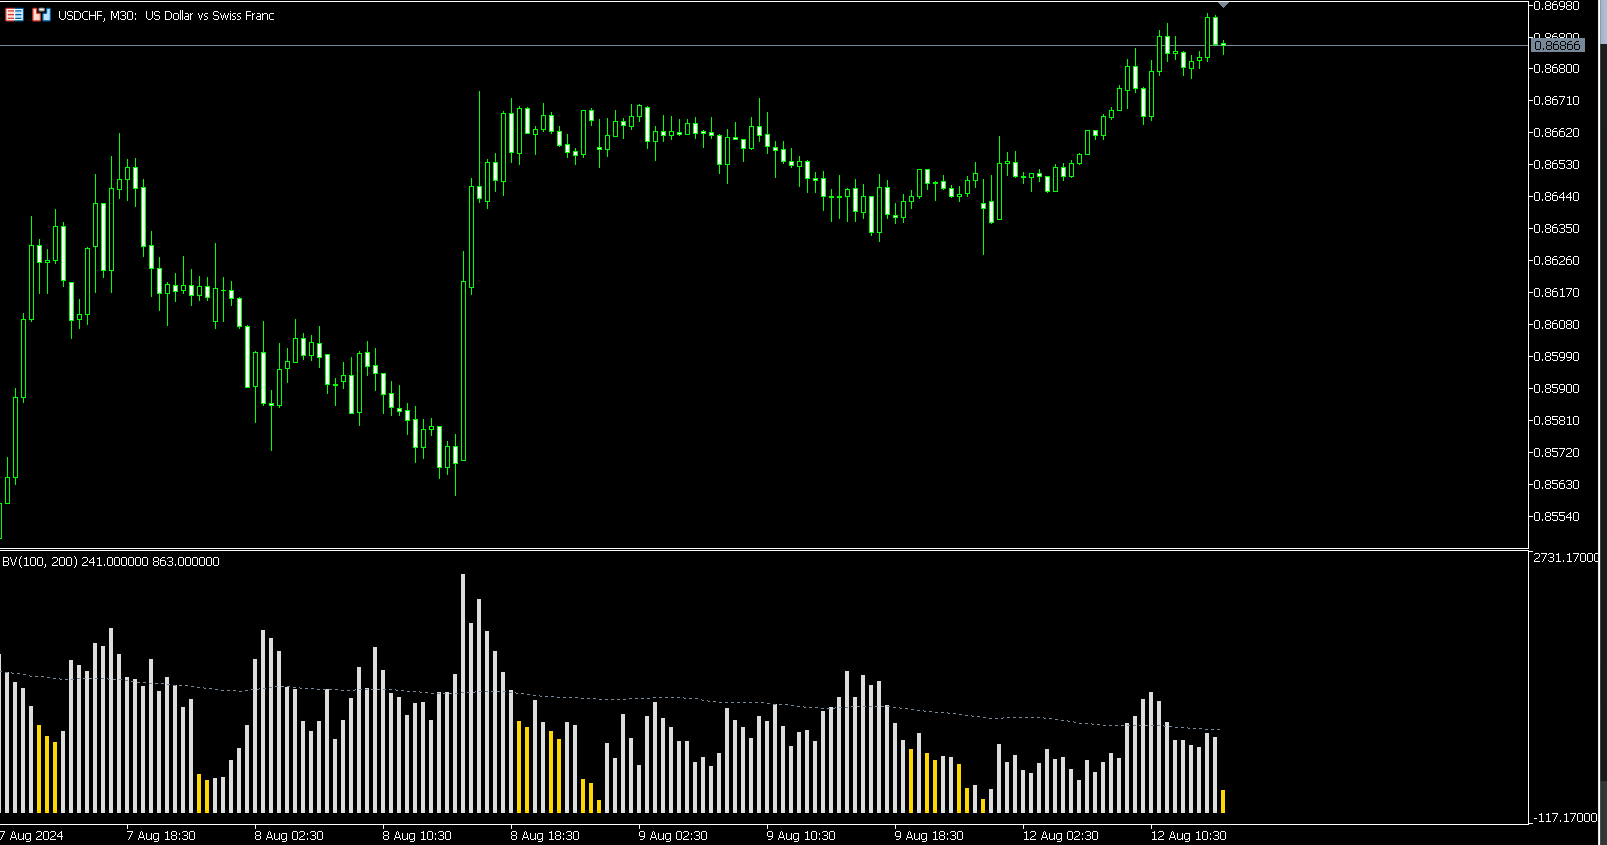
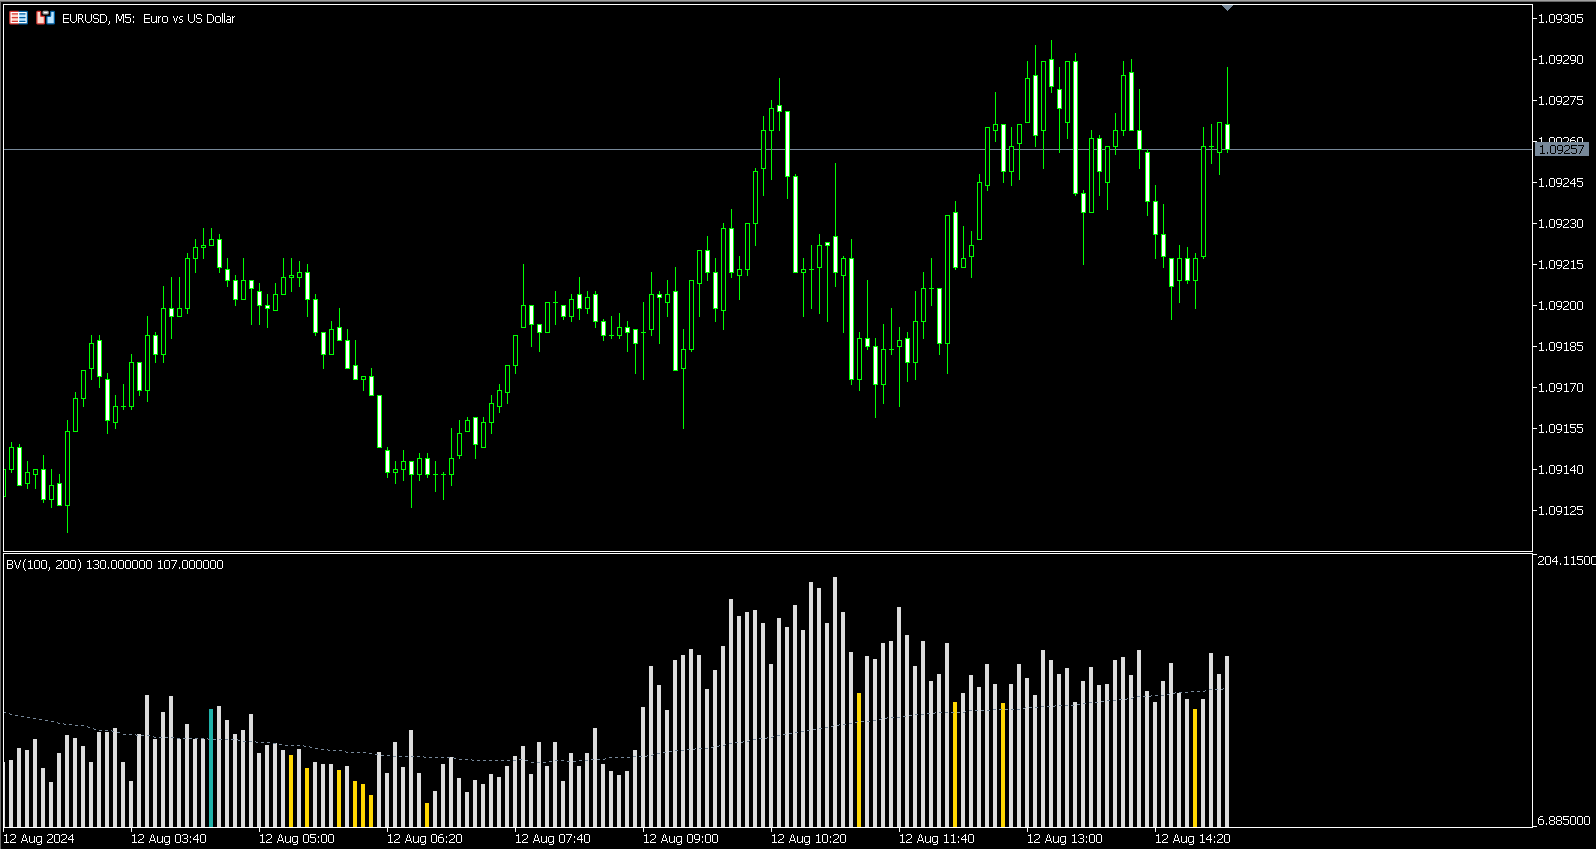
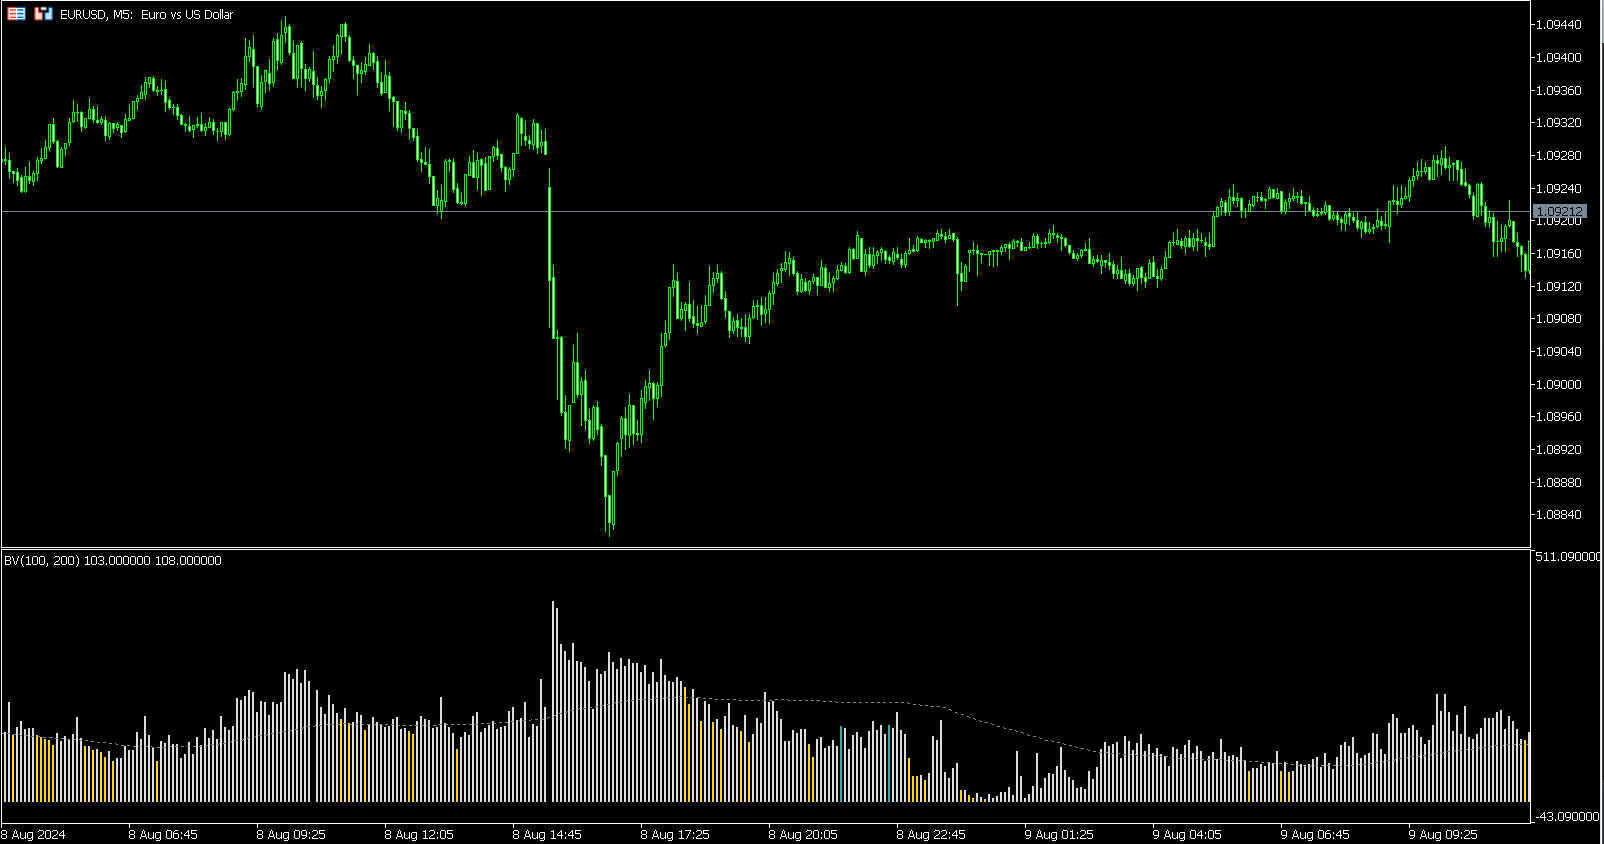
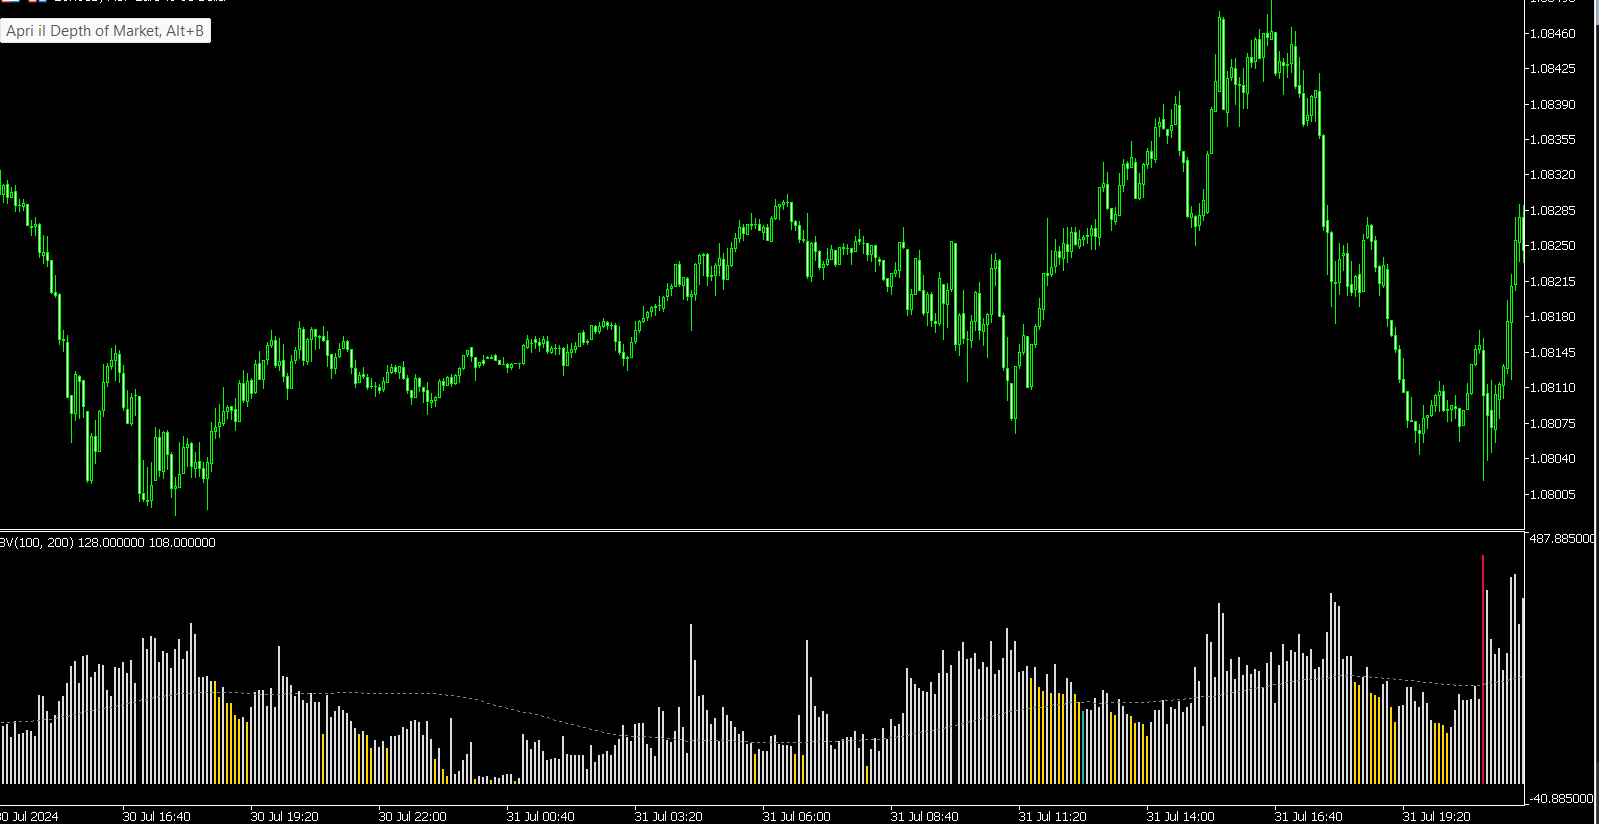
Entdecke den "Better Volume" Indikator: Der "Better Volume" ist das essenzielle Werkzeug zur Analyse des Marktvolumens für Trader, die sich abheben möchten. Es analysiert Tick-Volumen mit beispielloser Genauigkeit und bietet eine fortgeschrittene Gleitende-Durchschnitt-Funktion (PERIOD_MA) sowie anpassbare Kauf- und Verkaufsalarme.

Hauptmerkmale:

  • Fortgeschrittene Volumenanalyse: Erkenne Volumenspitzen, die wichtige Preisbewegungen signalisieren.
  • Intuitive Kauf- und Verkaufsalarme: Bleibe immer einen Schritt voraus mit Benachrichtigungen, die die besten Handelsmöglichkeiten signalisieren.
  • Einfache Anpassung: Passe den Indikator mit einfachen und intuitiven Eingaben an deine Bedürfnisse an.

Warum "Better Volume"? Mit "Better Volume" kannst du:

  • Genau die besten Momente zum Ein- und Aussteigen in den Markt identifizieren.
  • Deine Handelseffektivität mit Signalen, die auf echten Volumen basieren, verbessern.
  • Dich an jede Handelsstrategie anpassen, dank der flexiblen Konfigurierbarkeit der Eingaben.

Handle Jetzt! Verpasse nicht die Chance, dein Trading zu verbessern. Besuche unsere Seite auf MQL5 und lade heute noch den "Better Volume" Indikator herunter, um mit dem Wissen und Vertrauen zu handeln, das du verdienst!


Empfohlene Produkte
Volumengewichteter MACD Der volumengewichtete MACD (VW-MACD) wurde von Buff Dormeier erstellt und in seinem Buch Investieren mit Volumenanalyse beschrieben. Er repräsentiert die Konvergenz und Divergenz volumengewichteter Preistrends. Durch die Einbeziehung des Volumens ist der VW-MACD im Allgemeinen reaktionsschneller und zuverlässiger als der traditionelle MACD.   Was ist MACD (Moving Average Convergence Divergence)? Moving Average Convergence Divergence wurde 1979 von Gerald Appel en
One of the Best Volume Indicators, with the addition of a Moving Average for weighting volume over time average. If the "Current Candle" Volume is X% greater than the Moving Average value, we will have a sign of increasing volume. It can be a sign of Beginning, Continuity, Reversal or Exhaustion of the Movement. Fully configurable and all options open, you can color and set ALL values as you see fit. The 'Volume Break' shows volume bars in the same color as the candlestick, in addition
WAPV Weis Wave Chart Forex
Eduardo Da Costa Custodio Santos
Der Weis Wave Chart Forex für MT5 ist ein Preis- und Volumenindikator. Die Lesart von Preis und Volumen wurde durch Richard Demille Wyckoff auf der Grundlage der drei von ihm geschaffenen Gesetze verbreitet: Angebot und Nachfrage, Ursache und Wirkung und Aufwand vs. Ergebnis. Bereits 1900 verwendete R.Wyckoff das Wellendiagramm in seinen Analysen. Viele Jahre später, um 1990, automatisierte David Weis das Wellendiagramm von R. Wyckoff, und heute bringen wir Ihnen die Entwicklung des Wellendiagra
Description The indicator uses market profile theory to show the most relevant trading zones, on a daily basis. The zones to be shown are LVN (low volume nodes) and POC (point of control). An LVN zone is one which represents price areas with the least time or volume throughout the day. Typically, these areas indicate a supply or demand initiative, and in the future, they can turn into important breakout or retracement zones. A POC zone is one which represents price areas with the most time or vo
The Volume+ and VSA Signals indicator for MT5 is based on the Volume Spread Analysis (VSA) methodology to provide the signals. The signals are displayed at closing of bars on the main window or subwindow in the form of symbols. The symbols are not repainting.  The indicator produces a signal on an individual bar and this signal is not buy or sell signal. When a minor trend goes in the opposite direction of a major trend, there are sequences of major trend-following signals that give a higher pro
Normalized Volume99% of indicators are based on price analysis. This indicator is based on volume. Volume is overlooked piece of information in most trading systems. And this is a big mistake since volume gives important information about market participants. Normalized Volume is an indicator that can be used to confirm reversal points. The indicator code volume with colors indicating high, normal and low volume. You could enhance dramatically your trading system using volume analysis. 
MACD Intraday Trend PRO ist ein Indikator, der durch eine Adaption des ursprünglichen MACD von Gerald Appel in den 1960er Jahren entwickelt wurde. Im Laufe der Jahre des Handels wurde beobachtet, dass wir durch die Änderung der Parameter des MACD mit Fibonacci-Proportionen eine bessere Darstellung der Kontinuität der Trendbewegungen erreichen, wodurch es möglich ist, den Beginn und das Ende eines Preistrends effizienter zu erkennen. Aufgrund seiner Effizienz bei der Erkennung von Kurstrends
The Volume Spread Analysis indicator is based on the original Volume Spread Analysis method. It was designed for quick and easy recognition of VSA patterns. Even though this indicator looks very simple, it is the most sophisticated tool we've ever made. It is a really powerful analytical tool that generates very reliable trading signals. Because it is very user-friendly and understandable, it is suitable for every type of trader, regardless of his experience. What is VSA? VSA - Volume Spread
Mean Volume indicator for MT5
Renaud Herve Francois Candel
Mean Volume Most indicators are based on price analysis. This indicator is based on volume. Volume is overlooked piece of information in most trading systems. And this is a big mistake since volume gives important information about market participants. Mean Volume is an indicator that can be used to spot when volume is above average. It usually means that institutional traders are active. Peak in volume can be used to confirm an entry since increased volume can sustain the move in one or
Wapv Price and volume
Eduardo Da Costa Custodio Santos
Der WAPV Price and Volume Indicator for MT5 ist Teil des Toolsets (Wyckoff Academy Wave Market) und (Wyckoff Academy Price and Volume). Der WAPV-Preis- und Volumenindikator für MT5 wurde entwickelt, um die Volumenbewegung auf dem Chart auf intuitive Weise einfach zu visualisieren. Damit können Sie die Momente des Spitzenvolumens und Momente beobachten, in denen der Markt kein professionelles Interesse hat Identifizieren Sie Momente, in denen sich der Markt durch Trägheit bewegt und nicht durch d
Market Marker MT5
Evgeny Shevtsov
3.8 (5)
The indicator displays peak levels of activity formed by the maximum volume, tracks the correlation of the candles on all timeframes (from the highest to the lowest one). Each volume level is a kind of key trading activity. The most important cluster is inside a month, week, day, hour, etc. Indicator operation features A volume level receives Demand status if the nearest volume level located to the left and above has been broken upwards. A volume level receives Supply status if the nearest vol
Chaikin Money Flow
Jose Miguel Soriano
This indicator incorporates the volume to inform the market trend. A warning system (chart, SMS and e-mail) is incorporated for warning when a certain level is exceeded. Developed by Marc Chaikin, Chaikin Money Flow (CMF) measures the amount of Money Flow Volume (MFV) over a specific period. Money Flow Volume forms the basis for the Accumulation Distribution Line. Instead of a cumulative total of Money Flow Volume, Chaikin Money Flow simply sums Money Flow Volume for a specific look-back period.
PTS Demand Index MT5
PrecisionTradingSystems
PTS Demand Index-Code von Precision Trading Systems Der Demand Index wurde von James Sibbet entwickelt und verwendet komplexe Programmierung, um die Interpretation von Volumen und Preis als Kombination zu erleichtern. Das Verständnis von Volumen ist nie eine einfache Aufgabe, aber dieses wunderschöne Stück Programmierung macht es sicherlich viel einfacher. Es gibt mehrere Möglichkeiten, wie dieser Indikator sowohl Händlern als auch Investoren nutzen kann. Divergenzen (Als führender
VolaMetrics VSA
Thalles Nascimento De Carvalho
VolaMetrics VSA ist ein fortschrittlicher technischer Indikator, der die Volume Spread Analysis (VSA) Methodik mit einer detaillierten Analyse des Handelsvolumens kombiniert. Dieser Indikator wurde entwickelt, um bedeutende Preisbewegungen auf dem Markt zu identifizieren und zu verfolgen, indem die Interaktion zwischen Volumen und Preisänderung genutzt wird. Grundlagen der Volume Spread Analysis (VSA) VSA ist eine Methodik, die das Verhältnis zwischen Handelsvolumen, Preisänderung (Spread) und d
When looking at the volume information that moves the market, a question arises: is it a strong or weak movement? Should it be compared with previous days? These data should be normalized to always have a reference. This indicator reports the market volume normalized between 0-100 values. It has a line that smoothes the main signal (EMA). The normalization of values occurs within an interval defined by user (21 bars on default). User can also define any relative maximum, timeframe and number of
Reverse side scalper is the manual trading system, that works on choppy(anti-trend) market. As a rule markets are on 80% choppy and only 20% is trend phase. System is based on custom step Moving and RSI and reverse pattern. System defines up movement, down movement, trend / choppy phases. Indicator plots Buy signal arrow when current direction is down and phase is trend, Sell signal arrow is plotted when currently is up movement and phase is trend. As a rule it allows to "catch" local maximum/mi
A countdown timer for the  Volume bar chart generator  and  Tick chart generator  products, which are available for download from the MQL5 Market: Tick chart generator: https://www.mql5.com/en/market/product/29215 Volume bar chart generator: https://www.mql5.com/en/market/product/47197 The counter conveniently displays the number of ticks or transactions (depending on the chart) that need to pass for a new bar to start printing. The user can set the following indicator inputs. Volume type
FREE
Normalized OBV
Jose Miguel Soriano
When looking at the information of On Balance Volume indicator, a question arises: is it a strong or weak movement? Should it be compared with previous days? These data should be normalized to always have a reference. This indicator presents the followings parameters: Normalization period (Max-Mins absolute) Smoothing period (-1 off) Tick/Real Volume Maximum number of bars to calculate (-1 off) Upper value normalization Lower value normalization Calculation: normOBV = (value - absMin) * (relMa
Segmented Volume MT5
Eduardo Da Costa Custodio Santos
Der MT5 Segmented Volume Indikator wurde entwickelt, um den Handel mit Preis- und Volumenanalyse, VSA, VPA, Wyckoff-Methode und Smart Money System zu erleichtern. Segmentiertes Volumen funktioniert auf jedem Markt (Krypto, CFD, Forex, Futures, Aktien...) und funktioniert zu jeder Chart-Zeit. Sehen Sie, wie einfach Ihre Interpretation ist: #Grün: Volumen viel höher als der Marktdurchschnitt #Dunkelrosa: Überdurchschnittliches Volumen #Blau: Positive Normallautstärke #Rot: Negative Normallautstärk
Market Momentum PRO
Flavio Javier Jarabeck
The Market Momentum indicator is based on the Volume Zone Oscillator (VZO), presented by Waleed Aly Khalil in the 2009 edition of the International Federation of Technical Analysts journal, and presents a fresh view of this market valuable data that is oftenly misunderstood and neglected: VOLUME. With this new approach of "seeing" Volume data, traders can infer more properly market behavior and increase their odds in a winning trade. "The VZO is a leading volume oscillator; its basic usefulnes
Waves PRO
Flavio Javier Jarabeck
For those who appreciate Richard Wyckoff approach for reading the markets, we at Minions Labs designed a tool derived - yes, derived, we put our own vision and sauce into this indicator - which we called Waves PRO . This indicator provides a ZigZag controlled by the market volatility (ATR) to build its legs, AND on each ZigZag leg, we present the vital data statistics about it. Simple and objective. This indicator is also derived from the great book called " The Secret Science of Price and Volum
Do you use volume in your reading of the market? Certainly many traders use it, and do not imagine operating without it. The Color Histogram Volume Set indicator allows the user to choose the value that he considers interesting to monitor. When you pass this you will have visual confirmation and if you want you will also have the audible alert that is given by the indicator. Of course, there are other ways to try to find a high volume, such as assessing whether the volume
KT Renko Patterns MT5
KEENBASE SOFTWARE SOLUTIONS
KT Renko Patterns scans the Renko chart brick by brick to find some famous chart patterns that are frequently used by traders across the various financial markets. Compared to the time-based charts, patterns based trading is easier and more evident on Renko charts due to their uncluttered appearance. KT Renko Patterns features multiple Renko patterns, and many of these patterns are extensively explained in the book titled Profitable Trading with Renko Charts by Prashant Shah. A 100% automate
Hello Traders I have created this indicator to Catch SPIKES on Crash1000, Crash500 and Crash300. Follow the below mention instruction for better Result 1. When Red arrow pop up on the Chart, Take a Sell entry 2. Stay in trade until price break below from entry 3. Do not hold trades after all trades went in Blue 4. Keep adding position until spike cross below from intial entry See Example for more assistance
Top level indicator of exact buy and sell prices. Suitable for all symbols, you just have to choose a convenient trading activity. The indicator shows price rebound levels with the targets for entering and exiting a position. The commentary at each level states: what to do at the level (BUY/SELL); entry price; target exit price. In the parameters you need to select your trading activity: Long term investor Medium term investor Medium-term investor active Short term investor Short-term investor a
Wolfe Wave Scanner MT5
Reza Aghajanpour
5 (4)
**  All Symbols  x  All Timeframes  scan just by pressing scanner button ** *** Contact me after the purchase to send you instructions and add you in "Wolfe Wave Scanner group" for sharing or seeing experiences with other users. Introduction: A Wolfe Wave is created with five-wave patterns in price. It shows supply and demand and a fight towards a balance price. T hese waves of price actions can help traders identify the boundaries of   the trend . Also  It helps forecast how the price will mo
Volumes Direction MT5
William Oswaldo Mayorga Urduy
LAUTSTÄRKE RICHTUNG MT5 Normalerweise ändert sich die Farbe der Lautstärkeanzeige, wenn die aktuelle Lautstärke höher als die vorherige ist. Dies ist wichtig, aber nicht sehr nützlich. Aus diesem Grund wurde dieser Indikator erstellt, der zusätzlich zum normalen Volumen, wenn die Kerze bullisch oder bärisch ist, sie in einer anderen Farbe anmalt, standardmäßig blau für bullisch und rot für bärisch, aber diese Farben können angepasst werden Geschmack des Händlers. Vergessen Sie nicht,
White Weis Volume Ticks
Ricardo Almeida Branco
5 (3)
White Weis Volume This indicator shows the sum of the volume in each wave, bulish or bearish, as idealized by David Weis , but it brings an important addition , which is the marking of the bar with the highest volume of the wave (White Bar)! In coding the indicator, it was sought to optimize the code to require minimal processing during use and not to overload mt5. The indicator can be used for pre-trading analysis and study, where the trader analyzes possible points of support and resi
Introduction to Chart Pattern MT Chart Pattern MT is a chart pattern scanner to detect the triangle pattern, falling wedge pattern, rising wedge pattern, channel pattern and so on. Chart Pattern MT uses highly sophisticated chart pattern detection algorithm. However, we have designed it in the easy to use with intuitive user interface. Chart Pattern MT will show all the patterns in your chart in the most efficient format for your trading. You do not have to do tedious manual pattern detection an
This simple, yet powerful indicator is very good way to determine actual S/R levels. It's main purpose is making your overview on markets much better.It has built-in arrow signal system, which should be used along with MT indicators for best results.Just try it. Recommended MT indicators to use along: Bollinger Bands (default) RSI (period 3, levels 10/90)
Käufer dieses Produkts erwarben auch
Atomic Analyst MT5
Issam Kassas
4.78 (18)
Zunächst einmal ist es erwähnenswert, dass dieser Handelsindikator nicht neu malt, nicht neu zeichnet und keine Verzögerung aufweist, was ihn sowohl für manuellen als auch für Roboterhandel ideal macht. Benutzerhandbuch: Einstellungen, Eingaben und Strategie. Der Atom-Analyst ist ein PA-Preisaktionsindikator, der die Stärke und das Momentum des Preises nutzt, um einen besseren Vorteil auf dem Markt zu finden. Ausgestattet mit fortschrittlichen Filtern, die helfen, Rauschen und falsche Signale z
Zunächst einmal ist es wichtig zu betonen, dass dieses Handelssystem ein Nicht-Repainting-, Nicht-Redrawing- und Nicht-Verzögerungsindikator ist, was es sowohl für manuelles als auch für automatisches Trading ideal macht. Online-Kurs, Handbuch und Vorlagen herunterladen. Das "Smart Trend Trading System MT5" ist eine umfassende Handelslösung, die für neue und erfahrene Trader maßgeschneidert ist. Es kombiniert über 10 Premium-Indikatoren und bietet mehr als 7 robuste Handelsstrategien, was es zu
Gold Stuff mt5
Vasiliy Strukov
4.9 (182)
Gold Stuff mt5-Ein Trendindikator, der speziell für Gold entwickelt wurde, kann auch auf allen Finanzinstrumenten verwendet werden. Der Indikator wird nicht neu gezeichnet und verzögert sich nicht. Empfohlener Zeitrahmen H1. WICHTIG! Kontaktieren Sie mich sofort nach dem Kauf, um Anweisungen und Bonus zu erhalten!     Sie können eine kostenlose Kopie unseres Strong Support- und Trendscanner-Indikators erhalten, bitte senden Sie uns eine persönliche Nachricht. Mich! DATEN Draw Arrow - in
Quantum Trend Sniper
Bogdan Ion Puscasu
4.92 (48)
Wir stellen vor       Quantum Trend Sniper Indicator   , der bahnbrechende MQL5-Indikator, der die Art und Weise, wie Sie Trendumkehrungen erkennen und handeln, verändert! Entwickelt von einem Team erfahrener Händler mit über 13 Jahren Handelserfahrung,       Quantum Trend Sniper-Indikator       wurde entwickelt, um Ihre Trading-Reise mit seiner innovativen Methode zur Identifizierung von Trendumkehrungen mit extrem hoher Genauigkeit auf ein neues Niveau zu heben. ***Kaufe Quantum Trend Snipe
TPSproTREND PrO MT5
Roman Podpora
4.89 (9)
TPSpro TREND PRO  - is a trend indicator that automatically analyzes the market and provides information about the trend and each of its changes, as well as giving signals for entering trades without redrawing! The indicator uses each candle, analyzing them separately. referring to different impulses - up or down impulse. Exact entry points into transactions for currencies, crypto, metals, stocks, indices!  Version MT4               DETAILED DESCRIPTION               R ecommended to use with an
TPSpro RFI Levels MT5
Roman Podpora
4.67 (9)
Reversal First Impulse levels (RFI)      INSTRUCTIONS        RUS       -       ENG              R ecommended to use with an indicator   -   TPSpro  TREND PRO -  Version MT4                 A key element in trading is zones or levels from which decisions to buy or sell a trading instrument are made. Despite attempts by major players to conceal their presence in the market, they inevitably leave traces. Our task was to learn how to identify these traces and interpret them correctly. Main functi
Trend Screener Pro MT5
STE S.S.COMPANY
4.88 (67)
Nutzen Sie die Macht des Trendhandels mit Trend Screener Indicator: Ihrer ultimativen Trendhandelslösung, die auf Fuzzy-Logik und einem System mit mehreren Währungen basiert! Steigern Sie Ihren Trendhandel mit Trend Screener, dem revolutionären Trendindikator mit Fuzzy-Logik. Es handelt sich um einen leistungsstarken Trendfolgeindikator, der über 13 Premium-Tools und -Funktionen sowie 3 Handelsstrategien kombiniert und ihn zu einer vielseitigen Wahl macht, um Ihren Metatrader in einen Trendanaly
Zunächst einmal ist es wichtig zu betonen, dass dieses Handelstool ein Nicht-Repaint-, Nicht-Redraw- und Nicht-Verzögerungsindikator ist, was es ideal für professionelles Trading macht. Online-Kurs, Benutzerhandbuch und Demo. Der Smart Price Action Concepts Indikator ist ein sehr leistungsstarkes Werkzeug sowohl für neue als auch erfahrene Händler. Er vereint mehr als 20 nützliche Indikatoren in einem und kombiniert fortgeschrittene Handelsideen wie die Analyse des Inner Circle Traders und S
Dieses Dashboard zeigt die   neuesten verfügbaren harmonischen   Muster für die ausgewählten Symbole, so dass Sie Zeit sparen und effizienter sein werden /   MT4-Version . Kostenloser Indikator:   Basic Harmonic Pattern Spalten des Indikators Symbol:   die ausgewählten Symbole werden angezeigt Trend:   bullish oder bearish Pattern :   Art des Musters (Gartley, Schmetterling, Fledermaus, Krabbe, Hai, Cypher oder ABCD) Entry :   Einstiegskurs SL:   Stop-Loss-Kurs TP1:   1. Take-Profit-Kurs
FX Power MT5 NG
Daniel Stein
5 (6)
Erhalten Sie Ihr tägliches Marktupdate mit Details und Screenshots über unser Morning Briefing hier auf mql5 und auf Telegram ! FX Power MT5 NG ist die nächste Generation unseres langjährig sehr beliebten Währungsstärkemessers FX Power. Und was bietet dieser Stärkezähler der nächsten Generation? Alles, was Sie am ursprünglichen FX Power geliebt haben PLUS GOLD/XAU-Stärkeanalyse Noch präzisere Berechnungsergebnisse Individuell konfigurierbare Analysezeiträume Anpassbares Berechnungslimit für noc
IX Power MT5
Daniel Stein
4.17 (6)
IX Power   bringt die unschlagbare Präzision von FX Power endlich auch zu Nicht-Forex-Symbolen. Es bestimmt präzise die Intensität von kurz-, mittel- und langfristigen Trends in Ihren Lieblingsindizes, Aktien, Rohstoffen, ETFs und sogar Kryptowährungen. Sie können   alles analysieren, was   Ihr Terminal zu bieten hat. Probieren Sie es aus und erleben Sie, wie   sich Ihr Timing   beim Handel   deutlich verbessert . IX Power Hauptmerkmale 100% präzise, nicht nachpinselnde Berechnungsergebni
XQ Indicator MetaTrader 5
Marzena Maria Szmit
5 (1)
Step into the realm of Forex trading with confidence and precision using XQ, a cutting-edge Forex indicator designed to elevate your trading game to unprecedented heights. Whether you're a seasoned trader or just stepping into the world of currency exchange, XQ Forex Indicator empowers you with the insights and signals needed to make informed trading decisions. The signal conditions are a combination of three indicators, and XQ Forex Indicator only display  medium and long-term trends . The ind
AW Trend Predictor MT5
AW Trading Software Limited
4.78 (58)
Die Kombination von Trend- und Aufschlüsselungsebenen in einem System. Ein fortschrittlicher Indikatoralgorithmus filtert Marktrauschen, bestimmt den Trend, Einstiegspunkte sowie mögliche Ausstiegsniveaus. Indikatorsignale werden in einem Statistikmodul aufgezeichnet, das es Ihnen ermöglicht, die am besten geeigneten Tools auszuwählen, die die Wirksamkeit der Signalhistorie zeigen. Der Indikator berechnet Take-Profit- und Stop-Loss-Marken. Handbuch und Anleitung ->   HIER   / MT4-Version ->   H
Gartley Hunter Multi
Siarhei Vashchylka
5 (8)
Gartley Hunter Multi - An indicator for searching for harmonic patterns simultaneously on dozens of trading instruments and on all possible timeframes. Manual (Be sure to read before purchasing) | Version for MT4 Advantages 1. Patterns: Gartley, Butterfly, Shark, Crab. Bat, Alternate Bat, Deep Crab, Cypher 2. Simultaneous search for patterns on dozens of trading instruments and on all possible timeframes 3. Search for patterns of all possible sizes. From the smallest to the largest 4. A
Dies ist ein Indikator für MT5, der genaue Signale für den Einstieg in einen Handel ohne Repainting (Neuzeichnen) liefert. Er kann auf alle Finanzwerte angewendet werden: Forex, Kryptowährungen, Metalle, Aktien, Indizes. Er liefert ziemlich genaue Schätzungen und sagt Ihnen, wann es am besten ist, eine Position zu eröffnen und zu schließen. Sehen Sie sich das Video (6:22) mit einem Beispiel für die Verarbeitung nur eines Signals an, das sich für den Indikator gelohnt hat! Die meisten Händler ver
PZ Swing Trading MT5
PZ TRADING SLU
5 (4)
Swing Trading ist der erste Indikator, der Schwankungen in Trendrichtung und mögliche Umkehrschwankungen erkennt. Es wird der in der Handelsliteratur weit verbreitete Baseline-Swing-Trading-Ansatz verwendet. Der Indikator untersucht mehrere Preis- und Zeitvektoren, um die aggregierte Trendrichtung zu verfolgen und erkennt Situationen, in denen der Markt überverkauft oder überkauft ist und zur Korrektur bereit ist. [ Installationsanleitung | Update-Anleitung | Fehlerbehebung | FAQ | Alle Produkte
Bill Williams Advanced
Siarhei Vashchylka
5 (7)
Bill Williams Advanced is designed for automatic chart analysis using Bill Williams' "Profitunity" system. The indicator analyzes four timeframes at once. Manual (Be sure to read before purchasing) Advantages 1. Automatically analyzes the chart using the "Profitunity" system of Bill Williams. The found signals are placed in a table in the corner of the screen. 2. Equipped with a trend filter based on the Alligator indicator. Most of the system signals are recommended to be used only accordi
ICT, SMC, SMART MONEY CONCEPTS, SMART MONEY, Smart Money Concept, Support and Resistance, Trend Analysis, Price Action, Market Structure, Order Blocks, BOS/CHoCH,   Breaker Blocks ,  Momentum Shift,   Supply&Demand Zone/Order Blocks , Strong Imbalance,   HH/LL/HL/LH,    Fair Value Gap, FVG,  Premium  &   Discount   Zones, Fibonacci Retracement, OTE, Buy Side Liquidity, Sell Side Liquidity, BSL/SSL Taken, Equal Highs & Lows, MTF Dashboard, Multiple Time Frame, BigBar, HTF OB, HTF Market Structure
Blahtech Supply Demand MT5
Blahtech Limited
4.54 (13)
Was: $299  Now: $99   Supply Demand uses previous price action to identify potential imbalances between buyers and sellers. The key is to identify the better odds zones, not just the untouched ones. Blahtech Supply Demand indicator delivers functionality previously unavailable on any trading platform. This 4-in-1 indicator not only highlights the higher probability zones using a multi-criteria strength engine, but also combines it with multi-timeframe trend analysis, previously confirmed swings
Trend Forecaster
Alexey Minkov
5 (6)
The Trend Forecaster indicator utilizes a unique proprietary algorithm to determine entry points for a breakout trading strategy. The indicator identifies price clusters, analyzes price movement near levels, and provides a signal when the price breaks through a level. The Trend Forecaster indicator is suitable for all financial assets, including currencies (Forex), metals, stocks, indices, and cryptocurrencies. You can also adjust the indicator to work on any time frames, although it is recommen
AT Forex Indicator MT5
Marzena Maria Szmit
5 (4)
The AT Forex Indicator MT5 is a sophisticated trading tool designed to provide traders with a comprehensive analysis of multiple currency pairs. This powerful indicator simplifies the complex nature of the forex market, making it accessible for both novice and experienced traders. AT Forex Indicator uses advanced algorithms to detect trends, patterns and is an essential tool for traders aiming to enhance their forex trading performance. With its robust features, ease of use, and reliable signal
Advanced Supply Demand MT5
Bernhard Schweigert
4.53 (15)
Derzeit 33% Rabatt! Die beste Lösung für jeden Anfänger oder erfahrenen Händler! Dieser Indikator ist ein einzigartiges, qualitativ hochwertiges und erschwingliches Trading-Tool, da wir eine Reihe von proprietären Funktionen und eine neue Formel integriert haben. Mit diesem Update werden Sie in der Lage sein, doppelte Zeitrahmenzonen anzuzeigen. Sie können nicht nur einen höheren TF (Zeitrahmen) anzeigen, sondern sowohl den Chart-TF als auch den höheren TF: SHOWING NESTED ZONES. Alle Supply Dema
Easy By Sell is a market indicator for opening and closing positions. It becomes easy to track market entries with alerts. It indicates trend reversal points when a price reaches extreme values ​​and the most favorable time to enter the market. it is as effective as a Fibonacci to find a level but it uses different tools such as an algorithm based on ATR indicators and Stochastic Oscillator. You can modify these two parameters as you wish to adapt the settings to the desired period. My othe
Der Indikator zeigt die am besten geeigneten Einstiegs- und Ausstiegspunkte an. Er zeigt auch statistische Daten zu allen Signalen an, um den Handel besser analysieren zu können. Mit Hilfe dieses Indikators werden Sie den Markt besser verstehen können. Sobald sich die Kraft des Trends abzuschwächen beginnt (dies wird auf dem Panel angezeigt), bewegt sich die Trendlinie in die Horizontale - dies ist das Signal zum Ausstieg aus dem Handel. Oder Sie können aussteigen, wenn das durchschnittliche
Werden Sie Breaker Trader und profitieren Sie von Änderungen der Marktstruktur, wenn sich der Preis umkehrt. Der Order Block Breaker Indikator zeigt an, wann sich eine Trend- oder Preisbewegung der Erschöpfung nähert und bereit ist, sich umzukehren. Es weist Sie auf Änderungen in der Marktstruktur hin, die normalerweise auftreten, wenn eine Umkehrung oder ein größerer Rückzug bevorsteht. Der Indikator verwendet eine proprietäre Berechnung, die Ausbrüche und Preisdynamik identifiziert. Jedes
FX Volume MT5
Daniel Stein
4.94 (17)
Erhalten Sie Ihr tägliches Marktupdate mit Details und Screenshots über unser Morning Briefing hier auf mql5 und auf Telegram ! FX Volume ist der ERSTE und EINZIGE Volumenindikator, der einen ECHTEN Einblick in die Marktstimmung aus Sicht eines Brokers bietet. Es bietet fantastische Einblicke in die Positionierung von institutionellen Marktteilnehmern, wie z.B. Brokern, auf dem Forex-Markt, viel schneller als COT-Berichte. Diese Informationen direkt auf Ihrem Chart zu sehen, ist der wahre Game
IVISTscalp5
Vadym Zhukovskyi
5 (5)
Wir stellen Ihnen den iVISTscalp5-Indikator vor, der nicht nur einzigartig, sondern auch effektiv im Handel ist. Dieser Indikator basiert auf Zeitdaten und ist das Ergebnis jahrelanger Erfahrung und eingehender Analyse der Finanzmärkte. Der iVISTscalp5-Indikator ist ein ausgezeichnetes Werkzeug für manuellen Handel. Bequemlichkeit, Einfachheit und Visualisierung - die gesamte Komplexität ist verborgen. Wir haben die Einstellungen und Verwendung des iVISTscalp5-Indikators auf das Maximum vereinfa
Legacy of Gann for MT5
Pavel Zamoshnikov
5 (6)
The indicator very accurately determines the levels of the possible end of the trend and profit fixing. The method of determining levels is based on the ideas of W.D.Gann, using an algorithm developed by his follower Kirill Borovsky. Extremely high reliability of reaching levels (according to K. Borovsky  - 80-90%) Indispensable for any trading strategy – every trader needs to determine the exit point from the market! Precisely determines targets on any timeframes and any instruments (forex, met
Wir stellen vor       Quantum Breakout PRO   , der bahnbrechende MQL5-Indikator, der die Art und Weise, wie Sie mit Breakout-Zonen handeln, verändert! Entwickelt von einem Team erfahrener Händler mit über 13 Jahren Handelserfahrung,       Quantum Breakout PRO       ist darauf ausgelegt, Ihre Handelsreise mit seiner innovativen und dynamischen Breakout-Zone-Strategie auf ein neues Niveau zu heben. Der Quantum Breakout Indicator zeigt Ihnen Signalpfeile auf Breakout-Zonen mit 5 Gewinnzielzone
Das Volatility Trend System ist ein Handelssystem, das Signale für Einstiege liefert. Das Volatilitätssystem liefert lineare und punktuelle Signale in Richtung des Trends sowie Signale zum Verlassen des Trends, ohne Neuzeichnung oder Verzögerungen. Der Trendindikator überwacht die Richtung des mittelfristigen Trends, zeigt die Richtung und deren Änderung an. Der Signalindikator basiert auf Änderungen der Volatilität und zeigt Markteintritte an. Der Indikator ist mit mehreren Arten von Warn
Weitere Produkte dieses Autors
Verbessere Deine Handelsstrategien mit dem "Order Block" Indikator für MT4 Entdecke den "Order Block" Indikator: Der "Order Block" Indikator für MT4 ist darauf ausgelegt, Orderblöcke im Markt präzise zu identifizieren, indem er die Hochs und Tiefs der Orderblock-Kerzen markiert. Dieses leistungsstarke Tool ermöglicht es dir, zu verstehen, wo große Institutionen ihre Aufträge platzieren und so deine Fähigkeit zur Vorhersage von Marktbewegungen zu verbessern. Hauptmerkmale: Präzise Orderblock-Erke
IMPORTANT: The indicator will remain at the price of $34.90 until the release of the update scheduled for July 16, 2024. The New Price will be $49.90 (taxes excluded) FVG indicator. If you are an SMC trader this indicator will be very useful to you, it automatically identifies the FVGs on the graph distinguishing them into 2 types: bearish FVGs and bullish FVGs (see the photos to understand better). This indicator works on any Timeframe and on any market you want to use it. If you are interested
FREE Spread indicator for MetaTrader 4 this indicator includes: -average spread -current spread -minimum spread -maximum spread If you are interested in my products I recommend you visit my page where you can find: Experts Advisors:  https://www.mql5.com/it/market/product/119456?source=Site+Profile indicators:  https://www.mql5.com/it/market/product/120038?source=Site+Profile I hope the spread indicator will be useful to you. https://www.mql5.com/it/users/kappa05
FREE
Volumenprofil-Indikator für MT4 Erhalten Sie einen Trading-Vorteil mit dem "Volumenprofil"-Indikator für MetaTrader 4 (MT4). Dieses fortschrittliche technische Analysetool ermöglicht es Ihnen, Schlüsselunterstützungs- und Widerstandsniveaus basierend auf dem Handelsvolumen präzise zu identifizieren. Visualisieren Sie mühelos Marktbereiche mit hohem Interesse, in denen das Handelsvolumen am höchsten ist, und nutzen Sie diese Informationen, um fundiertere Handelsentscheidungen zu treffen. Hauptmer
Präsentation des "Color Range Indicator" Der "Color Range Indicator" ist ein leistungsstarkes technisches Analysetool, das für die MT4-Plattform entwickelt wurde, ideal für Händler, die einen klaren und unmittelbaren Überblick über die Markttrends wünschen. Dieser Indikator zeichnet eine farbige Linie basierend auf dem aktuellen Trend, was die Interpretation der Preisbewegungen erleichtert. Beschreibung des Indikators: Grüne Linie : Zeigt einen Aufwärtstrend an. Verwenden Sie dieses Signal, um K
Order Block indicator, highs and lows; the indicator focuses mainly on OBs, on the chart they are represented with a horizontal line on the minimum and maximum of that candle. While for the maximums and minimums only one line is marked (see the images to understand better). The indicator is for MT5, it works on all Timeframes, on any Forex Pair, on any index and on crypto markets. (For any information on the indicator do not hesitate to contact me). Limited time discount (50%) 74.90$ -> 38.60$
Expert Advisor for scalping; This EA was built for monthly profitability. Works on any asset: Forex, Indices, Crypto and Stocks. Perfectly usable in MT5 tester and usable on any TimeFrame. The EA has various inputs available to customize operations: -Lots -Risk% (0 = Fix) -OrderDist (the distance between one order and another, the distance is calculated in points not pips) -TP (in points) -Sl (in points) -TrailingStopTrigger(the trailing stop trigger point in points) -TrailingStop(distance from
Highs, Lows and Bos Indicator for MT5; The indicator works on any type of market and on all TimeFrames. It also works on the MetaTrader5 Tester. the main function of the indicator is to identify the highs and lows by marking them with a point above/below the candle, then with a horizontal line it marks the Bos. It is very simple and intuitive, there are only 2 inputs: -the color of the maximums -the color of the minima For any other information do not hesitate to contact me.
Panel Info Trade For MT5; The indicator has 2 main objects: -An icon chart that you can change Timeframe, zoom, Forex Pair, crypto....the position of the graph can be modified via the (x;y) inputs. The chart is perfectly usable in the MT5 tester. If the graph isn't for you and doesn't help you with anything, you can press the button on the top right to make it smaller. -the second object is a dynamic control panel where you can change plots, place sl and tp, BE, close partial... (if you watch th
Währungsstärke-Index (Currency Strength Index - CSI) Indikator BEVOR SIE DEN INDIKATOR AKTIVIEREN, DENKEN SIE DARAN, "TRUE" EINZUSTELLEN, UM DIE PAARE ANZUZEIGEN Der Währungsstärke-Index (Currency Strength Index - CSI) Indikator ist ein leistungsstarkes Werkzeug, das im Forex-Handel verwendet wird, um die relative Stärke der wichtigsten Währungen zu messen. Dieser Indikator hilft Tradern, die stärksten und schwächsten Währungen zu identifizieren, was es ihnen ermöglicht, fundiertere Handelsents
Im Trading-Bereich ist der Schlüssel zum Erfolg, die richtigen Werkzeuge zur richtigen Zeit zu haben. Unser innovativer Volumenprofil-Indikator wurde mit einem einzigen Ziel entwickelt: Tradern einen beispiellosen Zugang zu wichtigen Marktaktivitätsinformationen zu bieten. Dieses hochmoderne Werkzeug ermöglicht es Ihnen nicht nur zu sehen, wo und wann Volumen gehandelt wird, sondern auch die Markttiefe mit einer nie dagewesenen Klarheit zu verstehen. Hauptmerkmale: Zeitliche Flexibilität: Stelle
Maximiere deine Trading-Chancen mit dem "Auto Trendlines" Indikator Entdecke den "Auto Trendlines" Indikator: "Auto Trendlines" ist das essentielle Werkzeug für jeden technischen Trader. Dieser Indikator zeichnet automatisch Trendlinien und identifiziert Unterstützungs- und Widerstandsniveaus mit chirurgischer Präzision. Ideal für diejenigen, die Marktausbrüche und Umkehrungen nutzen möchten. Hauptmerkmale: Automatisches Zeichnen von Trendlinien: Identifiziert und zeichnet wichtige Trendlinien o
Optimiere deine Handelsentscheidungen mit dem "autoFibo" Indikator Entdecke den "autoFibo" Indikator: "autoFibo" ist das essenzielle Analysewerkzeug für Trader, die Fibonacci-Niveaus voll ausnutzen möchten, ohne manuell zeichnen zu müssen. Dieser Indikator automatisiert den Fibonacci-Retracement-Prozess und bietet sofortigen visuellen Zugang zu wichtigen Unterstützungs- und Widerstandszonen. Hauptmerkmale: Automatisches Fibonacci-Retracement: Zeichnet automatisch Fibonacci-Niveaus, was die Ident
Auswahl:
Keine Bewertungen
Antwort auf eine Rezension