• Aperçu
  • Avis
  • Commentaires

GO Trend MultiTimeFrame

Indicateur GoTrend Multi-Timeframe

L'indicateur "GoTrend Multi-Timeframe" est un outil essentiel pour les traders à la recherche d'un moyen rapide et efficace d'évaluer les tendances générales et spécifiques d'une paire de devises sur différentes périodes.

Cet indicateur permet aux traders d'obtenir une vue claire et complète de la direction du marché en un coup d'œil, optimisant ainsi la prise de décision et améliorant l'efficacité de leurs stratégies de trading.

Caractéristiques Principales:

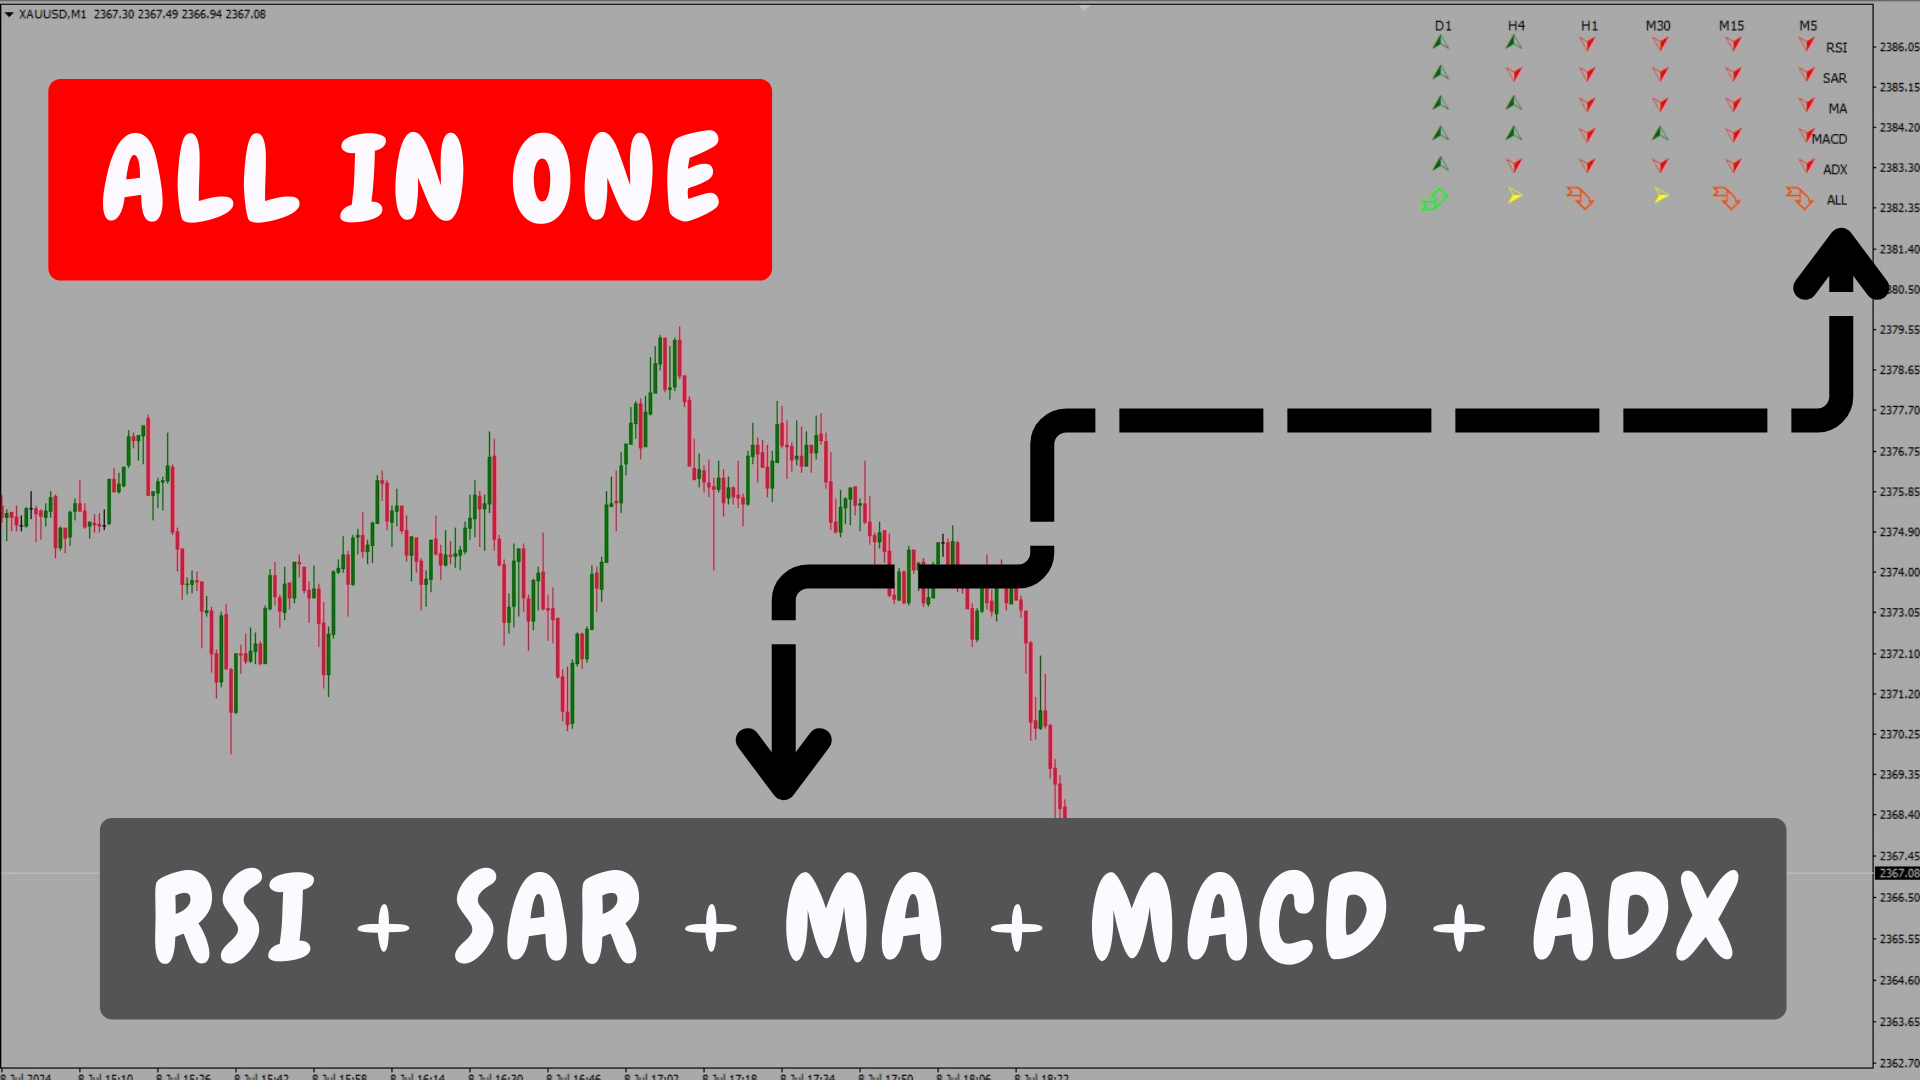
  • Analyse Multi-Timeframe: Cet indicateur fournit une analyse exhaustive de six périodes différentes: M5, M15, M30, H1, H4 et D1, permettant aux traders de comprendre la tendance de chacune de ces périodes.
  • Indicateurs Techniques Intégrés: L'indicateur utilise cinq indicateurs techniques robustes: RSI, SAR, MA, MACD et ADX pour déterminer la direction de la tendance dans chaque période.
  • Visualisation Claire et Intuitive: Les signaux sont affichés dans le coin de votre choix sur le graphique principal avec des symboles et des couleurs intuitifs. Cela permet aux traders d'évaluer la situation du marché en un coup d'œil.
  • Signal Combiné: En plus des signaux individuels de chaque indicateur, le "GoTrend Multi-Timeframe" offre un signal combiné résumant la tendance générale du marché pour cette paire.

Avantages pour le Trading:

  • Vue Rapide et Claire de la Tendance: Avec cet indicateur, les traders peuvent obtenir une vue rapide et claire de la direction de la tendance sur plusieurs périodes, ce qui est crucial pour prendre des décisions éclairées et opportunes.
  • Optimisation des Points d'Entrée et de Sortie: Les signaux d'achat et de vente sur différentes périodes aident les traders à optimiser leurs points d'entrée et de sortie, augmentant ainsi la probabilité de succès de leurs transactions.
  • Réduction du Bruit du Marché: En se concentrant sur les signaux de tendance de plusieurs périodes, les traders peuvent filtrer le bruit du marché et éviter les entrées fausses, améliorant ainsi leur gestion des risques.
  • Facilité d'Utilisation: La configuration de l'indicateur est simple et les résultats sont affichés clairement, ce qui en facilite l'utilisation même pour les traders débutants.

Utilisation de l'Indicateur:

  • Évaluation de la Tendance: Avant de prendre une décision de trading, les traders peuvent vérifier la tendance sur les six périodes différentes. Si la majorité des périodes montrent un signal d'achat ou de vente, cela fournit une confirmation solide de la direction du marché.
  • Stratégie d'Entrée et de Sortie: Utilisez les signaux individuels pour identifier les points d'entrée et de sortie optimaux. Par exemple, un signal d'achat sur plusieurs périodes peut indiquer un bon moment pour entrer dans une position longue.
  • Gestion des Transactions: Le signal combiné "ALL" offre une vue générale de la tendance de cette paire, aidant les traders à maintenir leurs positions dans la direction correcte de la tendance ou à ouvrir de nouvelles transactions dans le même sens que la tendance générale.

Paramètres de l'Indicateur:

  • Position sur le Graphique: L'indicateur est affiché dans le coin du graphique principal avec des paramètres personnalisables pour l'espacement et la taille des symboles.
  • Couleurs Personnalisables: Les couleurs des signaux "achat," "vente" et "aucun signal" sont personnalisables pour s'adapter aux préférences visuelles du trader.

Limitation des Alarmes:

Cet indicateur n'a pas et ne peut pas avoir d'alarmes en raison de sa conception flexible qui s'adapte à tous les types de trading. Cela inclut le trading sur une seule période, sur des périodes croisées, ou en utilisant une période plus longue pour déterminer la tendance et ensuite rechercher des entrées sur des périodes plus courtes. Les alarmes fixes ne seraient pas adaptées à la nature polyvalente et adaptative du "GoTrend Multi-Timeframe."

Le "GoTrend Multi-Timeframe" est l'allié parfait pour tout trader souhaitant faciliter sa prise de décision et optimiser ses transactions. Avec une visualisation claire et une analyse approfondie de la tendance sur plusieurs périodes, cet indicateur fournit les informations nécessaires pour une compréhension plus rapide de la situation de la paire traitée et donc des décisions de trading plus précises.

Description des Paramètres d'Entrée:

  • scaleX (Valeur: 60): Définit la distance horizontale entre les signaux affichés sur le graphique. Cette valeur ajuste l'espace entre les icônes pour une visualisation claire et organisée.
  • scaleY (Valeur: 25): Définit la distance verticale entre les signaux affichés sur le graphique. Cette valeur ajuste l'espace entre les icônes pour éviter les chevauchements et assurer une lecture facile.
  • offSetX (Valeur: 45): Définit la distance horizontale depuis le bord gauche du graphique jusqu'à la première icône de signal. Permet de positionner les signaux à l'endroit souhaité sur le graphique.
  • offSetY (Valeur: 20): Définit la distance verticale depuis le bord supérieur du graphique jusqu'à la première icône de signal. Permet de positionner les signaux à l'endroit souhaité sur le graphique.
  • fontSize (Valeur: 15): Taille de la police des icônes de signal. Cette valeur détermine la taille des icônes sur le graphique.
  • corner (Valeur: 2): Définit dans quel coin du graphique les signaux seront positionnés. Les valeurs peuvent être:
    • 0: Coin supérieur gauche
    • 1: Coin supérieur droit
    • 2: Coin inférieur gauche
    • 3: Coin inférieur droit
  • symbolCodeBuy (Valeur: 217): Code du symbole représentant un signal d'achat. Ce code correspond à un caractère spécifique dans la police "Wingdings".
  • symbolCodeSell (Valeur: 218): Code du symbole représentant un signal de vente. Ce code correspond à un caractère spécifique dans la police "Wingdings".
  • symbolCodeNoSignal (Valeur: 216): Code du symbole représentant l'absence de signal. Ce code correspond à un caractère spécifique dans la police "Wingdings".
  • allBuy (Valeur: 200): Code du symbole représentant un signal combiné d'achat. Ce code correspond à un caractère spécifique dans la police "Wingdings".
  • allSell (Valeur: 202): Code du symbole représentant un signal combiné de vente. Ce code correspond à un caractère spécifique dans la police "Wingdings".

Couleurs des Signaux:

  • signalBuyColor (Forte Hausse) - (Couleur: DarkGreen): Couleur du symbole indiquant un signal d'achat fort.
  • signalSellColor (Forte Baisse) - (Couleur: Red): Couleur du symbole indiquant un signal de vente fort.
  • noSignalColor (Aucun Signal) - (Couleur: Goldenrod): Couleur du symbole indiquant l'absence de signal.
  • allSellColor (Couleur: OrangeRed): Couleur du symbole indiquant un signal combiné de vente.
  • allBuyColor (Couleur: Lime): Couleur du symbole indiquant un signal combiné d'achat.
  • textColor (Couleur: Black): Couleur du texte décrivant les périodes (M5, M15, M30, H1, H4, D1) et les noms des indicateurs (RSI, SAR, MA, MACD, ADX, ALL).

Ces paramètres permettent de personnaliser l'apparence en fonction de la couleur du graphique que chaque trader préfère utiliser.


Produits recommandés
PDP indicator is used for: defining price probability distributions. This allows for a detailed representation of the channel and its borders and forecast the probability of a price appearing at each segment of its fluctuations; defining the channel change moment. Operation principles and features PDP analyzes a quote history on lower timeframes and calculates a price probability distribution on higher ones. Forecast algorithms allow the indicator to calculate probability distributions and m
Time Levels
Yurij Izyumov
4.27 (11)
The indicator is designed for displaying the following price levels on the chart: Previous day's high and low. Previous week's high and low. Previous month's high and low. Each of the level types is customizable. In the indicator settings, you set line style, line color, enable or disable separate levels. The version of the exact same indicator but only with sound alerts there - Time Levels with Alerts . Configurations ----Day------------------------------------------------- DayLevels - enable
FREE
Adaptive SSA
Jean Francois Le Bas
SSA stands for ' Singular Spectrum Analysis '. It combines elements of classical time series decomposition, statistics, multivariate geometry, dynamical systems and signal processing. SSA decomposes time series into a sum of components (ETs), with each component representing a lower smoothing, using several SVD ( Singular Value Decompositions ). It is a powerful filtering process used in many fields of research (climatology, biomedical, aerospace, etc), where high quality forecasting and smoo
Big Figure Indicator
Vonjinirina Alfred Randrianiaina
"BIG FIGURE INDICATOR" identifie et dessine automatiquement des lignes horizontales sur les graphiques de prix à des niveaux spécifiques, tels que des nombres entiers ou des demi-chiffres (par exemple, 1,0000 ou 1,5000 dans le commerce des devises). Ces niveaux sont considérés comme psychologiquement significatifs car ils représentent des chiffres ronds sur lesquels les grands traders et les investisseurs peuvent se concentrer, conduisant à des niveaux de support ou de résistance potentiels. Ce
FREE
Beautiful
Tatiana Savkevych
The Beautiful indicator shows potential market reversal points. The intelligent algorithm of the indicator detects the trend well, filters out market noise and generates input signals and exit levels. Uses just one parameter for settings. Simple, visual and efficient trend detection. The indicator does not redraw and does not lag. You can set up message alerts as sound or email. Works on all currency pairs and on all timeframes. Ready-made trading system.
MQLTrend
Mohammad Reza Aghaei
This tool helps you to control the situation at other times and include them in your trades when analyzing the market  This tool scans the market and reports the movement of the market at different times With the help of this tool, you can prevent many wrong analyzes With the help of this tool, you can have an overview of the market in the shortest time and save your time
FREE
OVERVIEW The Vector Candle Zones Render indicator automatically renders boxes for vector candle zones that are yet to be recovered. The indicator is an implementation of an existing PVA candles indicator. Combine it with PVSRA and MarketMakerMethod strategy. FEATURES Software: MetaTrader4 - MT4 - 600+ build Timeframes: Multi-Timeframe Markets: Forex/Cryptos/Energies/Bonds/Metals/Indices/Futures/Commodities Customizable style parameters: Change Color style Chan
MT Scanner
Niravkumar Maganbhai Patel
4 (3)
This indicator helps you to Scan symbols which are in the Market Watch Window  and filter out trends with alerts. It works based on the effective indicator "SUPERTREND" which is used by many traders for trading: When box color changes to " Green " or " Red " color, it indicates you for trend change for long and short entry. And also you will get alerted on screen. When it changes to " Green ", it indicates you that trend is going upwards, and you can take the long entry. If the color changes to
FREE
Trend Star
Ivan Simonika
5 (1)
The indicator ignores sharp fluctuations and market noise and tracks market trends with absolute reliability. It is suitable for trading on small timeframes and on large ones, it ignores sudden price spikes or price movement corrections due to the reduction of market noise around the average price value. For calculations, the indicator uses indicators: iLow, iHigh, iMA, iATR. Since the output signal relies on reliable indicators, it is also reliable. You can configure both a sound signal and se
Extremum Reverse Bar
Yurij Izyumov
3.55 (11)
This indicator has been created for finding the probable reversal points of the symbol price. A small candlestick reversal pattern is used it its operation in conjunction with a filter of extremums. The indicator is not redrawn! If the extremum filter is disabled, the indicator shows all points that have a pattern. If the extremum filter is enabled, the condition works – if the history Previous bars 1 candles back contains higher candles and they are farther than the Previous bars 2 candle, such
FREE
Unveil the Secret to Trading with Joker's TrendMaster!  Ready to outperform the markets with a proven and reliable strategy? Look no further! Introducing Joker's TrendMaster, the revolutionary indicator crafted by Yuri Congia! With Joker's TrendMaster, you'll gain access to a powerful combination of advanced technical analysis and unique strategic insights. Limited-time Special Opportunity: Seize the moment! Be among the first 10 (Purchasing 1/10) to seize this unique opportunity, and not
FREE
Lisek Stochastic
Darius Hans Lischka
3 (7)
Lisek Stochastic   oscillator indicator with Alarm, Push Notifications and e-mail  Notifications. The Stochastic indicator is a momentum indicator that shows you how strong or weak the current trend is. It helps you identify overbought and oversold market conditions within a trend. The Stochastic indicator is lagging indicator, which means it don't predict where price is going, it is only providing data on where price has been !!! How to trade with Stochastic indicator: Trend following: As lon
FREE
Real Channel
Vitalii Zakharuk
The key difference between the Real Channel indicator and other channel indicators (for example, from the same Bollinger) is that the Real Channel takes into account not simple moving averages, but twice smoothed ones, which, on the one hand, makes it possible to more clearly determine the market movement, and on the other hand makes the indicator less sensitive. Real Channel is a non-redrawing channel indicator based on moving averages.
Super trend is one of the best trend indicators in metatrader 4 (MT4). Triple SuperTrend indicator is an indicator that consist of three super trend indicator that can be aranged. This indicator is built by mql4 language and doesn't provided by MT4 platform. Highly recommended using EMA SuperTrend Strategy Indicator if you want to get better result in here: https://www.mql5.com/en/market/product/91664 This indicator is easy to use, power full and has many benefits, there are: Using three ind
FREE
TrendPlus
Sivakumar Subbaiya
4.21 (14)
Trend Plus   Trendplus  Indicator   Time Frame: Suitable for any time frame.  Purpose: Trend Prediction. Blue and red candle indicate the buy and sell call respectively. Buy: When the blue candle is formed buy call is initiated. close the buy trades when the next red candle will formed.   Sell: When the Red candle is formed Sell call is initiated. close the Sell trades when the next blue candle will formed.   Happy trade!!
FREE
Ska ZigZag BuySell
NKATEKO VUKOSI LEROY MASANGO
Ska ZigZag BuySell indicator determines the overbought and oversold regions within a trend. The indicator determines the overbought region by the candlestick high and the oversold region by the candlestick low. This indicator only gives signals with arrow and audible alerts each and every time when a new candlestick appear. To utilize the full strategy i recommend using "Ska ZigZag BuySell" together with "Ska ZigZag Line". The Ska ZigZag Line indicator is available for free. NOTE: Indicator is h
Elephant Candle
David Leander Tschacher
The Elephant Candle is an indicator for MT4. It draws arrows when strong bullish or bearish candles appear. Strong candles frequently initiate a new trend. The arrows can be used in expert advisors. This indicator can improve already existing trading strategies. The indicator is very fast and doesn't repaint. Inputs Period Candle Multiplier Candle Niceness [%] Arrow Size Enable Alert Enable Push Notification Enable Email
Doonchian
Andriy Sydoruk
The Doonchian channel consists of two channel displays. Channel lines are determined by a simple and reliable algorithm. The channel is preferably used for trading inside the channel. The indicator does not redraw and does not lag; simple algorithms are the basis of the work. It works on all currency pairs and on all timeframes. As always a warning, we must not forget that the approach must be comprehensive, the indicator signals require additional information to enter the market.
The indicator trades during horizontal channel breakthroughs. It searches for prices exceeding extreme points or bouncing back, monitors night flat and defines targets using customizable Fibo levels with a sound alert, which can be disabled if necessary. The indicator allows you to create a horizontal channel between the necessary extreme points in visual mode quickly and easily. It automatically applies your selected Fibo levels to these extreme points (if the appropriate option is enabled in t
Developed methods for trading collected in one indicator. In the form of arrows, it defines entries in the direction of the trend. It has 2 types of arrows - trend and signal guides, informing about the potential movement in the direction of the trend. Works without redrawing, ready for use on all symbols/tools. The most suitable time frames to use are M15, M30, H1, H4. How to use The indicator finds the direction of the trend in the form of a signal arrow, a graphic rectangle stretches
The Sentiment Ratio indicator gauges current Market Sentiment between -100% and 100%, where lower than -40% is considered Bearish and higher than 40% is Bullish. The channel between the two is considered Neutral. The indicator has been a very useful filter tool for signals within a trading system. Example call function:  int SentimentIndicator(double triggerLevel)//Return sentiment if trigger level is activated {   double sentimentRatio=iCustom(NULL,0,"Sentiment Ratio",0,0,0);   if(sentimentRa
FREE
Smart Channel is a non-redrawing channel indicator based on moving averages. The indicator is used to identify trends in financial markets and indicates the direction of price movement. Smart Channel, in fact, is a miniature trading strategy, since, regardless of the construction methods, it uses the tactics of rebounding from the boundaries of the built channel, and the boundaries themselves are used as guidelines for the correct placement of stop loss and take profit orders. The key diffe
Drawing Pack
John Louis Fernando Diamante
4 (1)
This indicator provides several drawing tools to assist in various methods of chart analysis. The drawings will keep their proportions (according to their handle trendline) across different chart scales, update in real time, and multiple drawings are supported. # Drawing Option Description  1 Grid box draggable boxed grid, user defines rows x colums, diagonal ray option  2 Grid partial or fullscreen grid, sized by handle line  3 Grid flex a diagonal grid, sized and sloped by handle line
This indicator will provide you with everything you need in order to overcome losses due to human emotions. The indicator determines the moments of a trend reversal and the direction of its movements. This development is equipped with the most modern, adaptable trading algorithms. The main secret of short-term trading is to have information on when to enter a deal. The indicator works great on all timeframes and informs the trader about the most successful moments of buying or selling a currency
Free automatic Fibonacci is an indicator that automatically plots a Fibonacci retracement based on the number of bars you select on the BarsToScan setting in the indicator. The Fibonacci is automatically updated in real time as new highest and lowest values appears amongst the selected bars. You can select which level values to be displayed in the indicator settings. You can also select the color of the levels thus enabling the trader to be able to attach the indicator several times with differe
FREE
The indicator is a set of parameters for setting three moving averages (fast, medium and slow), which can be used to analyze the market. This indicator provides the ability to analyze market trends and make trading decisions based on the intersections of various moving averages. It also supports audio alerts for timely notification of trading signals. LengthFaster: Sets the number of candles used to calculate the faster moving average. A value of 5 means using price data from the last 5 can
T3IndiFast
Ridwan Kureemun
Supporting file (2 of 2) for T3 Cloud MA Trend indicator derived from T3 moving averages. The cloud is bounded by a fast T3 and slow T3 lines. Buying/Selling opportunities above/below cloud. The fast and slow T3 MA lines can also be used as dynamic support/resistance for more aggressive entries. Use default values for best settings. The number of look back bars is user defined. This indicator can be used in combination with other strategies such as price action. Suitable for all time frames. P
FREE
T3IndiSlow
Ridwan Kureemun
Supporting file (1 of 2) for T3 Cloud MA Trend indicator derived from T3 moving averages. The cloud is bounded by a fast T3 and slow T3 lines. Buying/Selling opportunities above/below cloud. The fast and slow T3 MA lines can also be used as dynamic support/resistance for more aggressive entries. Use default values for best settings. The number of look back bars is user defined. This indicator can be used in combination with other strategies such as price action. Suitable for all time frames. P
FREE
SpectorChart
Sergii Krasnyi
5 (1)
Cet indicateur change continuellement la couleur des bords et des corps des chandeliers, ainsi que la couleur des volumes en temps réel. L'indicateur est facile à utiliser. La palette de couleurs est variée. Ce produit est une solution graphique, il est donc difficile de décrire ce qu'il fait par un texte, il est plus facile de le voir en le téléchargeant, de plus le produit est gratuit. L'indicateur convient aux blogueurs qui veulent créer une belle image d'un graphique pour l'édition vidéo ou
FREE
Advanced SSA
Jean Francois Le Bas
SSA stands for 'Singular Spectrum Analysis'. It combines elements of classical time series decomposition, statistics, multivariate geometry, dynamical systems and signal processing. SSA decomposes time series into a sum of components (ETs), with each component representing a lower smoothing, using several SVD (Singular Value Decompositions). It is a powerful filtering process used in many fields of research (climatology, biomedical, aerospace, etc), where high quality forecasting and smoothin
Les acheteurs de ce produit ont également acheté
TPSpro RFI Levels
Roman Podpora
4.86 (21)
Reversal First Impulse levels (RFI)    INSTRUCTIONS        RUS       -       ENG              R ecommended to use with an indicator   -   TREND PRO -  Version MT5 A key element in trading is zones or levels from which decisions to buy or sell a trading instrument are made. Despite attempts by major players to conceal their presence in the market, they inevitably leave traces. Our task was to learn how to identify these traces and interpret them correctly. Main functions: Displaying active zones
Actuellement 20% de réduction ! La meilleure solution pour tout débutant ou trader expert ! Ce logiciel de tableau de bord fonctionne sur 28 paires de devises. Il est basé sur 2 de nos principaux indicateurs (Advanced Currency Strength 28 et Advanced Currency Impulse). Il donne un excellent aperçu de l'ensemble du marché Forex. Il montre les valeurs de l'Advanced Currency Strength, la vitesse de mouvement des devises et les signaux pour 28 paires de devises dans tous les (9) délais. Imagine
Scalper Inside PRO
Alexey Minkov
4.75 (59)
An exclusive indicator that utilizes an innovative algorithm to swiftly and accurately determine the market trend. The indicator automatically calculates opening, closing, and profit levels, providing detailed trading statistics. With these features, you can choose the most appropriate trading instrument for the current market conditions. Additionally, you can easily integrate your own arrow indicators into Scalper Inside Pro to quickly evaluate their statistics and profitability. Scalper Inside
TPSproTREND PrO
Roman Podpora
4.78 (18)
TPSpro TRENDPRO  - is a trend indicator that automatically analyzes the market and provides information about the trend and each of its changes, as well as giving signals for entering trades without redrawing! The indicator uses each candle, analyzing them separately. referring to different impulses - up or down impulse. Exact entry points into transactions for currencies, crypto, metals, stocks, indices!  -  Version MT5               DETAILED DESCRIPTION                R ecommended to use with
TrendMaestro
Stefano Frisetti
5 (3)
note: this indicator is for METATRADER4, if you want the version for METATRADER5 this is the link:  https://www.mql5.com/it/market/product/108106 TRENDMAESTRO ver 2.4 TRENDMAESTRO recognizes a new TREND in the bud, he never makes mistakes. The certainty of identifying a new TREND is priceless. DESCRIPTION TRENDMAESTRO identifies a new TREND in the bud, this indicator examines the volatility, volumes and momentum to identify the moment in which there is an explosion of one or more of these data a
Atomic Analyst
Issam Kassas
5 (3)
Tout d'abord, il convient de souligner que cet indicateur de trading n'est ni repainting, ni redrawing et ne présente aucun délai, ce qui le rend idéal à la fois pour le trading manuel et automatisé. Manuel de l'utilisateur : réglages, entrées et stratégie. L'Analyste Atomique est un indicateur d'action sur les prix PA qui utilise la force et le momentum du prix pour trouver un meilleur avantage sur le marché. Équipé de filtres avancés qui aident à éliminer les bruits et les faux signaux, et à
The AT Forex Indicator MT4 is a sophisticated trading tool designed to provide traders with a comprehensive analysis of multiple currency pairs. This   powerful indicator   simplifies the complex nature of the forex market, making it accessible for both novice and experienced traders. AT Forex Indicator uses   advanced algorithms   to detect trends, patterns and is an essential tool for traders aiming to enhance their forex trading performance. With its robust features, ease of use, and reliabl
FX Volume
Daniel Stein
4.61 (36)
Obtenez votre mise à jour quotidienne du marché avec des détails et des captures d'écran via notre Morning Briefing ici sur mql5 et sur Telegram ! FX Volume est le PREMIER et SEUL indicateur de volume qui fournit un VRAI aperçu du sentiment du marché du point de vue d'un courtier. Il fournit des informations impressionnantes sur la façon dont les acteurs institutionnels du marché, comme les courtiers, sont positionnés sur le marché des changes, bien plus rapidement que les rapports COT. Voir c
Trend Screener
STE S.S.COMPANY
4.83 (89)
Indicateur de tendance, solution unique révolutionnaire pour le trading et le filtrage des tendances avec toutes les fonctionnalités de tendance importantes intégrées dans un seul outil ! Il s'agit d'un indicateur multi-période et multi-devises 100 % non repeint qui peut être utilisé sur tous les symboles/instruments : forex, matières premières, crypto-monnaies, indices et actions. Trend Screener est un indicateur de suivi de tendance efficace qui fournit des signaux de tendance fléchés avec des
Entry Points Pro
Yury Orlov
4.7 (226)
Indicateur supérieur pour MT4 fournissant des signaux précis pour entrer dans un trade sans repeindre ! Il peut être appliqué à tous les actifs financiers : forex, cryptocurrencies, métaux, actions, indices.  La version MT5 est ici Il fournira des signaux de trading assez précis et vous dira quand il est préférable d'ouvrir un trade et de le fermer. Regardez la vidéo (6:22) avec un exemple de traitement d'un seul signal qui a rapporté à l'indicateur ! La plupart des traders améliorent l
Indicator : RealValueIndicator Description : RealValueIndicator is a powerful tool designed specifically for trading on the EURUSD pair. This indicator analyzes all EUR and USD pairs, calculates their real currency strength values, and displays them as a single realistic value to give you a head start on price. This indicator will tell you moves before they happen if you use it right. RealValueIndicator allows you to get a quick and accurate overview of the EURUSD currency pair tops and bottoms,
Enigmera
Ivan Stefanov
5 (4)
ENIGMERA : Le cœur du marché https://www.enigmera.com Introduction Cet indicateur et ce système de trading constituent une approche remarquable des marchés financiers. ENIGMERA utilise les cycles fractals pour calculer avec précision les niveaux de support et de résistance. Il indique la phase d'accumulation authentique et donne une direction et des objectifs.  Un système qui fonctionne que nous soyons dans une tendance ou une correction.  Comment fonctionne-t-il ? ENIGMERA comprend trois l
NAM Order Blocks
NAM TECH GROUP, CORP.
5 (1)
MT4 Multi-timeframe Order Blocks detection indicator. Features - Fully customizable on chart control panel, provides complete interaction. - Hide and show control panel wherever you want. - Detect OBs on multiple timeframes. - Select OBs quantity to display. - Different OBs user interface. - Different filters on OBs. - OB proximity alert. - ADR High and Low lines. - Notification service (Screen alerts | Push notifications). Summary Order block is a market behavior that indicates order collection
All in One Trade
Alexey Minkov
4.48 (27)
The All-in-One Trade Indicator (AOTI) determines daily targets for EURUSD, EURJPY, GBPUSD, USDCHF, EURGBP, EURCAD, EURAUD, AUDJPY, GBPAUD, GBPCAD, GBPCHF, GBPJPY, AUDUSD, and USDJPY. All other modules work with any trading instruments. The indicator includes various features, such as Double Channel trend direction, Price channel, MA Bands, Fibo levels, Climax Bar detection, and others. The AOTI indicator is based on several trading strategies, and created to simplify market analysis. All-in-One
Shepherd Gann Squares
Abdullah Alrai
4.9 (10)
Cet indicateur est une méthode d'analyse de marché basée sur l'article "Formule mathématique pour les prédictions de marché" écrit par W.D. Gann en fonction du carré de neuf et du carré de 144 méthodes. Manuel de l'Utilisateur: Add Your review And contact us to get it Vous pouvez acheter la version complète MT5 à partir de : https://www.mql5.com/en/market/product/28669 Vous pouvez tester gratuitement sur MT4 : https://www.mql5.com/en/market/product/15320?source=Site +Profile+Seller#
Présentation       Quantum Trend Sniper Indicator   , l'indicateur révolutionnaire MQL5 qui transforme la façon dont vous identifiez et négociez les inversions de tendance ! Développé par une équipe de traders expérimentés avec une expérience commerciale de plus de 13 ans,       Indicateur Quantum Trend Sniper       est conçu pour propulser votre parcours de trading vers de nouveaux sommets grâce à sa manière innovante d'identifier les inversions de tendance avec une précision extrêmement élevée
System Trend Pro - This is the best trend trading indicator!!! The indicator no repaint!!!   The indicator has   MTF   mode, which adds confidence to trading on the trend (   no repaint   ). How to trade? Everything is very simple, we wait for the first signal (big arrow), then wait for the second signal (small arrow) and enter the market in the direction of the arrow. (See screens 1 and 2.) Exit on the opposite signal or take 20-30 pips, close half of it, and keep the rest until the oppo
Gold Channel is a volatility-based indicator, developed with a specific timing algorithm for the XAUUSD pair, which consists of finding possible corrections in the market. This indicator shows two outer lines, an inner line (retracement line) and an arrow sign, where the theory of the channel is to help identify overbought and oversold conditions in the market. The market price will generally fall between the boundaries of the channel. If prices touch or move outside the channel it is a tra
Cycle Sniper
Elmira Memish
4.41 (37)
NEW YEAR SALE PRICE FOR LIMITED TIME!!! Please contact us after your purchase and we will send you the complimentary indicators to complete the system Cycle Sniper is not a holy grail but when you use it in a system which is explained in the videos, you will feel the difference. If you are not willing to focus on the charts designed with Cycle Sniper and other free tools we provide, we recommend not buying this indicator. We recommend watching the videos about the indiactor and system before pu
norepaint buy sell indicator is norepaint indicator.and works all pairs and all timeframes. Indicator hold too long way to signals. So 5m chart and 15m chart more suitable. using is wery simple ,it puts arrow on price probably buy sell arrows. thise indicator is suitable for beginner and experienced traders. there is cnt numbers that show how many bars you see the signal back. increasing it possible but up to chart have the how many bars . minimum value of this 500.
GOLD Impulse with Alert
Bernhard Schweigert
4.56 (9)
Cet indicateur est une super combinaison de nos 2 produits Advanced Currency IMPULSE with ALERT  +   Currency Strength Exotics . Il fonctionne pour tous les cadres temporels et montre graphiquement l'impulsion de force ou de faiblesse pour les 8 principales devises plus un symbole ! Cet indicateur est spécialisé pour montrer l'accélération de la force des devises pour tout symbole comme l'or, les paires exotiques, les matières premières, les indices ou les contrats à terme. C'est le premi
Quantum Breakout Indicator PRO
Bogdan Ion Puscasu
4.96 (26)
Présentation       Quantum Breakout PRO   , l'indicateur révolutionnaire MQL5 qui transforme la façon dont vous négociez les zones d'évasion ! Développé par une équipe de traders expérimentés avec une expérience de trading de plus de 13 ans,   Quantum Breakout PRO   est conçu pour propulser votre parcours de trading vers de nouveaux sommets grâce à sa stratégie de zone de discussion innovante et dynamique. Quantum Breakout Indicator vous donnera des flèches de signalisation sur les zones d
ECM Channel MT4
Paulo Rocha
5 (1)
ECM Elite Channel is a volatility-based indicator, developed with a specific time algorithm, which consists of finding possible corrections in the market. This indicator shows two outer lines, an inner line (retracement line) and an arrow sign, where the channel theory is to help identify overbought and oversold conditions in the market. The market price will generally fall between the boundaries of the channel. If prices touch or move outside the channel, it's a trading opportunity. The
Currency Strength Exotics
Bernhard Schweigert
4.88 (33)
ACTUELLEMENT 20% DE RÉDUCTION ! La meilleure solution pour tout débutant ou trader expert ! Cet indicateur est spécialisé pour montrer la force de la devise pour tous les symboles comme les paires exotiques, les matières premières, les indices ou les contrats à terme. C'est le premier de son genre, n'importe quel symbole peut être ajouté à la 9ème ligne pour montrer la force réelle de la devise de l'or, l'argent, le pétrole, DAX, US30, MXN, TRY, CNH etc. Il s'agit d'un outil de trading uniq
Présentation de l'indicateur astronomique pour MT4 : Votre compagnon de trading céleste ultime Êtes-vous prêt à élever votre expérience de trading à des hauteurs célestes ? Ne cherchez pas plus loin que notre indicateur astronomique révolutionnaire pour MT4. Cet outil innovant transcende les indicateurs de trading traditionnels en exploitant des algorithmes complexes pour vous fournir des aperçus astronomiques inégalés et des calculs de précision. Un univers d'informations à portée de main : Con
REMINDER: Early buyers hot price discount: Price subject to rise after first 20 copies. Starting price $65 and final price will be $1275. Secure your discounted copy Now! Smart Money Analyser Indicator User Manual 1. Introduction Welcome to the   Smart Money Analyser Indicator This powerful tool provides traders with comprehensive market analysis by combining various technical indicators to generate actionable trading signals. Designed to be user-friendly, this indicator helps traders of a
Up down v6T
Guner Koca
5 (1)
Thise indicator is up down v6  comes with tradingwiev pinescript. purchased people, after installed on terminal ,contact me on mql5  to get BONUS  TradingView pinescript. up-down indicator is no repaint and works all pairs and lower than weekly time frames charts. it is suitable also 1 m charts for all pairs. and hold long way to signal. dont gives too many signals. when red histogram cross trigger line that is up signal.and price probably will down when blue histogram cross trigger line that
Please send me Direct message on MQL5 CHAT after purchasing the Indicator for Training and Installation Support There are some additional files that is important to use with the Indicator . So be sure to contact me after purchasing the Indicator So that I can add you for training and support . If you find any difficulty with installation then send me Direct message here So that I can connect with you via Anydesk or Teamview for the product installation. " Smart Order Block Indicator " to find
Price Action Entry Alerts
Stephen Sanjeeve Sahayam
5 (3)
Cet indicateur examine chaque barre pour la pression d'achat ou de vente et identifie 4 types de modèles de bougies avec le volume le plus élevé. Ces bougies sont ensuite filtrées à l'aide de plusieurs filtres linéaires pour afficher les signaux d'achat ou de vente. Les signaux fonctionnent mieux, en conjonction avec une direction temporelle plus élevée et lorsqu'ils sont négociés pendant les heures de volume élevé. Tous les filtres sont personnalisables et fonctionnent indépendamment. Peut aff
How to use Pair Trading Station Pair Trading Station is recommended for H1 time frame and you can use it for any currency pairs. To generate buy and sell signal, follow few steps below to apply Pair Trading Station to your MetaTrader terminal. When you load Pair Trading Station on your chart, Pair Trading station will assess available historical data in your MetaTrader platforms for each currency pair. On your chart, the amount of historical data available will be displayed for each currency pai
Plus de l'auteur
Aurum Apex Mt4 EA
Martin Alejandro Bamonte
Description de Aurum Apex EA Aurum Apex EA est un puissant outil de trading automatique à 100 % conçu pour la plateforme MT4. Il analyse le marché en temps réel et détecte diverses opportunités de trading. Adapté à tous les niveaux de traders, Aurum Apex EA propose trois modes de risque ajustables via le paramètre de Risque : Risque = 0.1 (Risque Faible) : Idéal pour les nouveaux traders peu familiers avec les mouvements de l'or. Ce paramètre minimise les surprises tout en renforçant la confian
BullsEye Signal NoRepaint
Martin Alejandro Bamonte
BullseyeSignal – NoRepaint est un signal qui, comme son nom l'indique, ne se repeint jamais en aucune circonstance. Le signal est émis sur la même bougie observée dans l'image. Il est idéal pour les marchés hautement volatils tels que le forex, les cryptomonnaies, les actions, les indices et les futures. Vous ne verrez qu'une flèche verte pour l'achat et une flèche rouge pour la vente, mais il y a de nombreux indicateurs qui travaillent ensemble en arrière-plan pour fournir une expérience de tra
Indicateur NextCandlePredictor NextCandlePredictor, un indicateur de signal avec alerte qui ne repeint pas, ne change pas de couleur, ne bouge pas, ne disparaît pas et n'a pas de retard. Il vous aidera à identifier la direction des prochaines bougies dans n'importe quelle période. Hautement recommandé pour les marchés à forte volatilité comme New York, Londres ou même le chevauchement des deux. Caractéristiques Principales: Polyvalence dans les Périodes de Temps: Fournit des signaux rapides et p
L'indicateur MTFMA (Moyennes Mobiles Multi-Temps) utilise plusieurs moyennes mobiles (MA) dans différentes unités de temps pour fournir des signaux d'achat et de vente (qui ne repeignent pas) dans une fenêtre séparée du graphique principal. Il est polyvalent et facile à interpréter, adapté à la fois au scalping sur des unités de temps plus petites et au trading à plus long terme sur des unités de temps plus grandes. Pourquoi est-il Multiframe ? Le terme multiframe fait référence à la capacité de
Scalping Signal NO Repaint NO Lag
Martin Alejandro Bamonte
5 (1)
"Scalping Signal No Repaint No Lag" est le seul indicateur sur le marché qui, lorsqu'il est glissé sur n'importe quel graphique, charge automatiquement tous les indicateurs nécessaires sans avoir besoin de charger un modèle ou d'autres indicateurs. Il configure automatiquement le graphique pour qu'il ressemble exactement à l'image fournie. Cet indicateur garantit des signaux sans redessiner ni retard, ce qui le rend idéal pour les stratégies de scalping sur toutes les paires de devises et toute
Clear Breakout
Martin Alejandro Bamonte
L'indicateur "Breakout Buy-Sell" est conçu pour identifier et mettre en évidence des opportunités d'achat et de vente potentielles basées sur les ruptures de prix pendant différentes sessions de marché (Tokyo, Londres et New York). Cet indicateur aide les traders à visualiser clairement les zones d'achat et de vente, ainsi que les niveaux de take-profit (TP) et de stop-loss (SL). Stratégie d'utilisation L'indicateur peut être utilisé comme suit : Configuration initiale : Sélectionnez la session
GbpUsd Pip Hunter EA
Martin Alejandro Bamonte
GBPUSD Pip Hunter EA Caractéristiques principales : Optimisé pour GBPUSD sur le timeframe M15 : Spécifiquement conçu et testé pour la paire GBPUSD sur un graphique de 15 minutes. Taille de compte minimum recommandée : Nécessite un solde de compte minimum de $1000 pour assurer de faibles tirages. Compatibilité des spreads : Mieux utilisé avec des comptes à faible spread ou ECN pour maximiser la rentabilité. Gestion des risques : Inclut une option pour désactiver la fonction de lot exponentiel en
L'indicateur "MultiSymbol & TF Chart Integrated" est conçu pour fournir rapidement une vue complète du marché, vous permettant de surveiller jusqu'à 60 paires de devises dans les délais de votre choix sur un seul graphique (mode multiple) ou de voir la paire que vous négociez sur tous les TF (mode simple). Avantages Principaux: Surveillance Complète: Permet la surveillance en temps réel de toutes les paires souhaitées sur un seul graphique en un coup d'œil. Gain de Temps: Évite la nécessité de
Pairs and TF Changer
Martin Alejandro Bamonte
Êtes-vous fatigué de passer d'un graphique à l'autre pour surveiller différentes paires de devises et périodes ? L'indicateur Pairs and TF Changer est là pour révolutionner votre expérience de trading ! Une fois que vous avez chargé tous les indicateurs pour votre stratégie, ajoutez Pairs and TF Changer au graphique. Si nécessaire, vous pouvez ensuite ajuster sa position, ses couleurs ou le nombre de colonnes qu'il affiche ! Caractéristiques clés : Intégration transparente : Intégrez cet indicat
Filtrer:
Aucun avis
Répondre à l'avis