• Genel bakış
  • İncelemeler
  • Yorumlar

GO Trend MultiTimeFrame

GoTrend Çok Zaman Dilimli Gösterge

"GoTrend Multi-Timeframe" göstergesi, farklı zaman dilimlerinde bir döviz çiftinin genel ve spesifik eğilimlerini hızlı ve verimli bir şekilde değerlendirmek isteyen tüccarlar için vazgeçilmez bir araçtır.

Bu gösterge, tüccarların piyasa yönünü bir bakışta net ve kapsamlı bir şekilde görmelerini sağlayarak karar alma süreçlerini optimize eder ve ticaret stratejilerinin etkinliğini artırır.

Ana Özellikler:

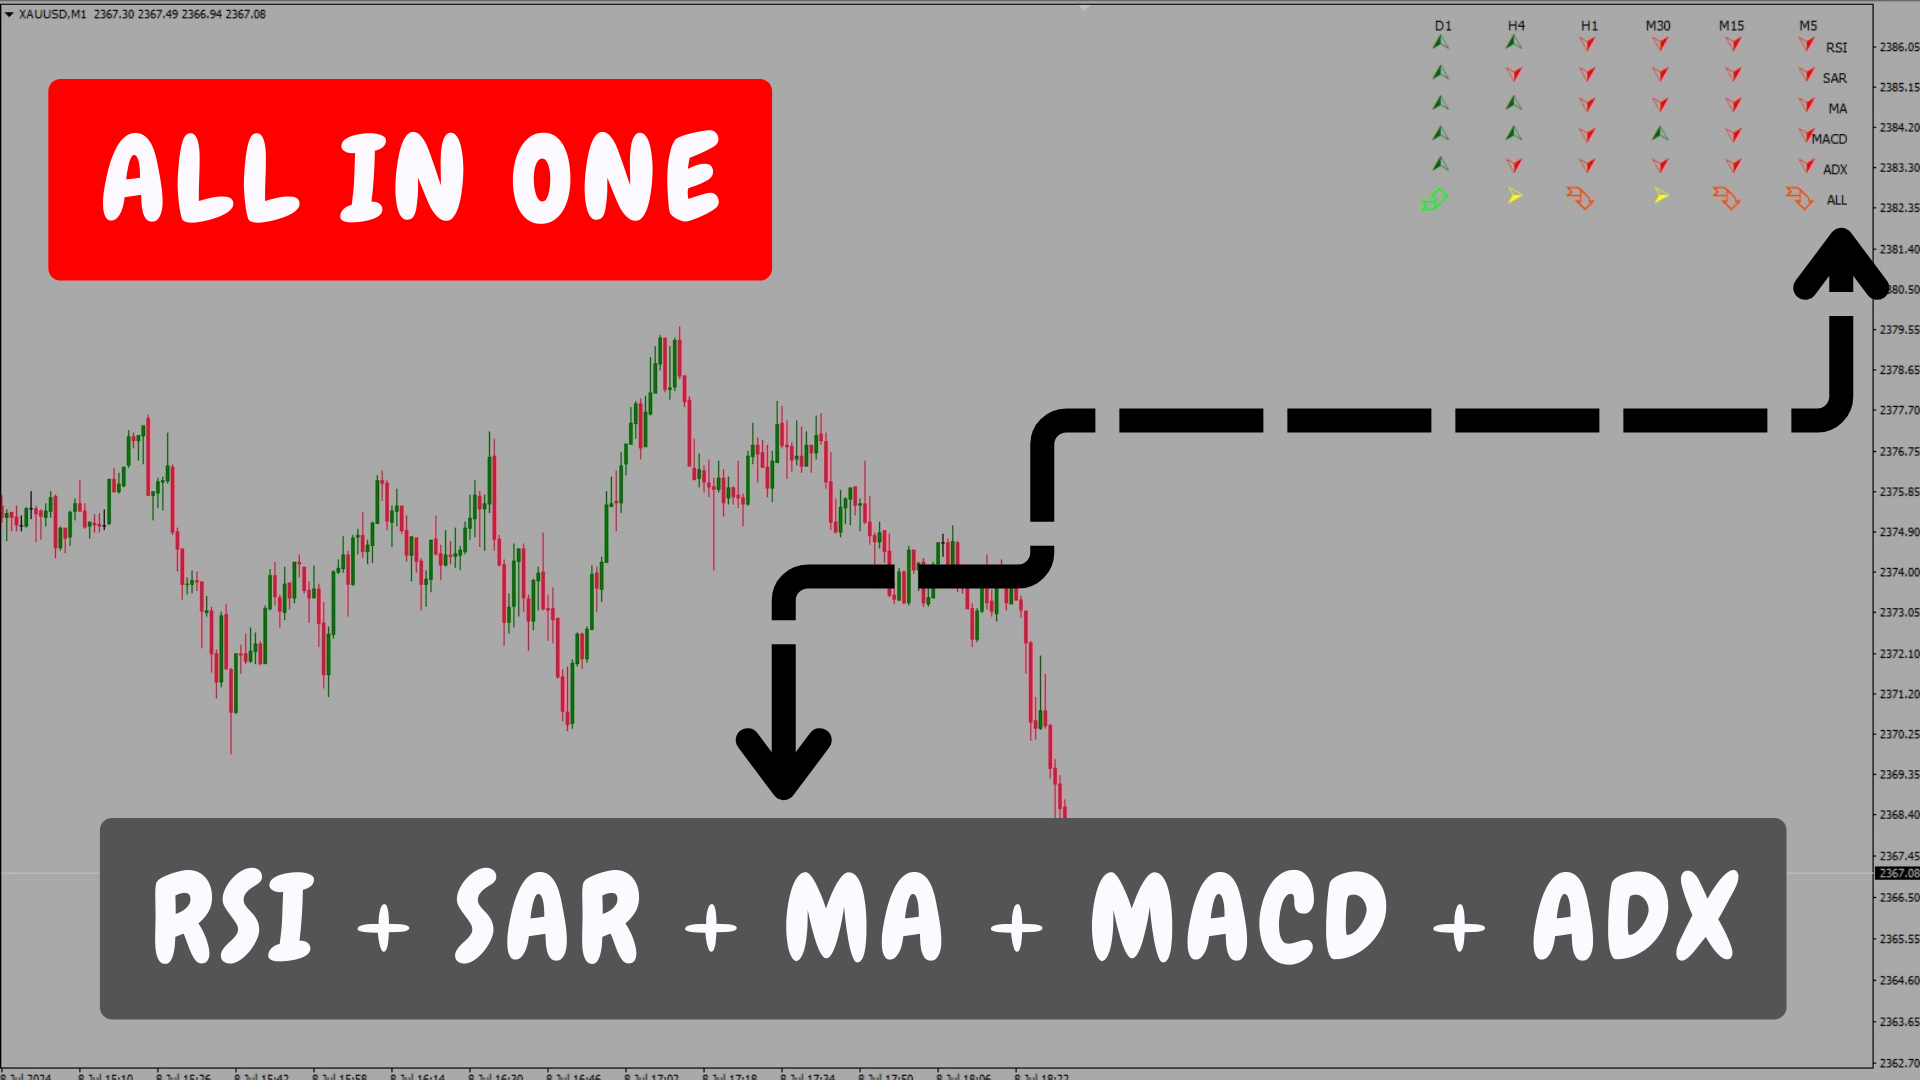
  • Çok Zaman Dilimli Analiz: Bu gösterge, M5, M15, M30, H1, H4 ve D1 olmak üzere altı farklı zaman diliminin kapsamlı bir analizini sağlar ve tüccarların her bir dönemin eğilimini anlamalarını sağlar.
  • Entegre Teknik Göstergeler: Gösterge, her zaman diliminde eğilim yönünü belirlemek için RSI, SAR, MA, MACD ve ADX olmak üzere beş sağlam teknik gösterge kullanır.
  • Net ve Sezgisel Görselleştirme: Sinyaller, ana grafiğin seçilen köşesinde sezgisel semboller ve renklerle gösterilir. Bu, tüccarların piyasa durumunu bir bakışta değerlendirmelerini sağlar.
  • Kombine Sinyal: Her bir göstergenin bireysel sinyallerine ek olarak, "GoTrend Multi-Timeframe" bu çift için genel piyasa eğilimini özetleyen bir kombine sinyal sunar.

Ticaret Faydaları:

  • Hızlı ve Net Eğilim Görünümü: Bu gösterge ile tüccarlar, bilgilendirilmiş ve zamanında kararlar almak için kritik olan birden fazla zaman dilimindeki eğilim yönünü hızlı ve net bir şekilde görebilirler.
  • Giriş ve Çıkışların Optimizasyonu: Farklı zaman dilimlerindeki alım ve satım sinyalleri, tüccarların giriş ve çıkış noktalarını optimize etmelerine yardımcı olarak işlemlerinde başarı olasılığını artırır.
  • Piyasa Gürültüsünün Azaltılması: Birden fazla zaman dilimindeki eğilim sinyallerine odaklanarak, tüccarlar piyasa gürültüsünü filtreleyebilir ve yanlış girişlerden kaçınarak risk yönetimlerini iyileştirebilirler.
  • Kullanım Kolaylığı: Gösterge kurulumu basittir ve sonuçlar net bir şekilde gösterilir, bu da yeni başlayan tüccarlar için bile kullanımını kolaylaştırır.

Gösterge Kullanımı:

  • Eğilim Değerlendirmesi: Ticaret kararı vermeden önce, tüccarlar altı farklı zaman dilimindeki eğilimi kontrol edebilirler. Zaman dilimlerinin çoğu bir alım veya satım sinyali gösteriyorsa, bu piyasa yönünün sağlam bir teyidini sağlar.
  • Giriş ve Çıkış Stratejisi: Optimum giriş ve çıkış noktalarını belirlemek için bireysel sinyalleri kullanın. Örneğin, birden fazla zaman diliminde görülen bir alım sinyali, uzun pozisyona girmek için iyi bir zaman olduğunu gösterebilir.
  • İşlem Yönetimi: "ALL" kombine sinyali, bu çiftin eğilim genel görünümünü sunarak, tüccarların eğilimin doğru yönünde pozisyonlarını korumalarına veya genel eğilimle aynı yönde yeni işlemler açmalarına yardımcı olur.

Gösterge Ayarları:

  • Grafikteki Konum: Gösterge, sembol boyutu ve aralık için özelleştirilebilir ayarlarla ana grafiğin köşesinde gösterilir.
  • Özelleştirilebilir Renkler: "Al," "sat" ve "sinyal yok" sinyallerinin renkleri, tüccarın görsel tercihine göre özelleştirilebilir.

Alarm Sınırlaması:

Bu gösterge, tüm ticaret türlerine uyum sağlayan esnek tasarımı nedeniyle alarmlara sahip değildir ve sahip olamaz. Bu, tek bir zaman diliminde, çapraz zaman dilimlerinde veya eğilimi belirlemek için daha yüksek bir zaman dilimini kullanarak ve ardından daha düşük zaman dilimlerinde giriş arayarak işlem yapmayı içerir. Sabit alarmlar, "GoTrend Multi-Timeframe" in çok yönlü ve uyarlanabilir doğasına uygun olmayacaktır.

"GoTrend Multi-Timeframe" karar alma süreçlerini basitleştirmek ve işlemlerini optimize etmek isteyen her tüccar için mükemmel bir yardımcıdır. Birden fazla zaman diliminde net görselleştirme ve derinlemesine eğilim analizi ile bu gösterge, işlem yapılan çiftin durumunu daha hızlı anlamak ve dolayısıyla daha doğru ticaret kararları almak için gerekli bilgileri sağlar.

Girdi Parametrelerinin Tanımı:

  • scaleX (Değer: 60): Grafikte görüntülenen sinyaller arasındaki yatay mesafeyi tanımlar. Bu değer, net ve düzenli bir görselleştirme için simgeler arasındaki boşluğu ayarlar.
  • scaleY (Değer: 25): Grafikte görüntülenen sinyaller arasındaki dikey mesafeyi tanımlar. Bu değer, örtüşmeleri önlemek ve kolay okuma sağlamak için simgeler arasındaki boşluğu ayarlar.
  • offSetX (Değer: 45): Grafiğin sol kenarından ilk sinyal simgesine kadar olan yatay mesafeyi ayarlar. Sinyallerin grafikte istenilen yere yerleştirilmesini sağlar.
  • offSetY (Değer: 20): Grafiğin üst kenarından ilk sinyal simgesine kadar olan dikey mesafeyi ayarlar. Sinyallerin grafikte istenilen yere yerleştirilmesini sağlar.
  • fontSize (Değer: 15): Sinyal simgelerinin yazı tipi boyutu. Bu değer, simgelerin grafikte ne kadar büyük veya küçük görüneceğini belirler.
  • corner (Değer: 2): Sinyallerin grafiğin hangi köşesine yerleştirileceğini tanımlar. Değerler şunlar olabilir:
    • 0: Sol üst köşe
    • 1: Sağ üst köşe
    • 2: Sol alt köşe
    • 3: Sağ alt köşe
  • symbolCodeBuy (Değer: 217): Alım sinyalini temsil eden simge kodu. Bu kod, "Wingdings" yazı tipindeki belirli bir karaktere karşılık gelir.
  • symbolCodeSell (Değer: 218): Satım sinyalini temsil eden simge kodu. Bu kod, "Wingdings" yazı tipindeki belirli bir karaktere karşılık gelir.
  • symbolCodeNoSignal (Değer: 216): Sinyal yok anlamına gelen simge kodu. Bu kod, "Wingdings" yazı tipindeki belirli bir karaktere karşılık gelir.
  • allBuy (Değer: 200): Birleşik alım sinyalini temsil eden simge kodu. Bu kod, "Wingdings" yazı tipindeki belirli bir karaktere karşılık gelir.
  • allSell (Değer: 202): Birleşik satım sinyalini temsil eden simge kodu. Bu kod, "Wingdings" yazı tipindeki belirli bir karaktere karşılık gelir.

Sinyal Renkleri:

  • signalBuyColor (Güçlü Yukarı) - (Renk: DarkGreen): Güçlü alım sinyalini gösteren simgenin rengi.
  • signalSellColor (Güçlü Aşağı) - (Renk: Red): Güçlü satım sinyalini gösteren simgenin rengi.
  • noSignalColor (Sinyal Yok) - (Renk: Goldenrod): Sinyal yok anlamına gelen simgenin rengi.
  • allSellColor (Renk: OrangeRed): Birleşik satım sinyalini gösteren simgenin rengi.
  • allBuyColor (Renk: Lime): Birleşik alım sinyalini gösteren simgenin rengi.
  • textColor (Renk: Black): Zaman dilimlerini (M5, M15, M30, H1, H4, D1) ve gösterge adlarını (RSI, SAR, MA, MACD, ADX, ALL) açıklayan metin rengidir.

Bu parametreler, her tüccarın kullanmayı tercih ettiği grafik rengini temel alarak görünümü özelleştirmeyi sağlar.


Önerilen ürünler
PDP indicator is used for: defining price probability distributions. This allows for a detailed representation of the channel and its borders and forecast the probability of a price appearing at each segment of its fluctuations; defining the channel change moment. Operation principles and features PDP analyzes a quote history on lower timeframes and calculates a price probability distribution on higher ones. Forecast algorithms allow the indicator to calculate probability distributions and m
Time Levels
Yurij Izyumov
4.27 (11)
The indicator is designed for displaying the following price levels on the chart: Previous day's high and low. Previous week's high and low. Previous month's high and low. Each of the level types is customizable. In the indicator settings, you set line style, line color, enable or disable separate levels. The version of the exact same indicator but only with sound alerts there - Time Levels with Alerts . Configurations ----Day------------------------------------------------- DayLevels - enable
FREE
Adaptive SSA
Jean Francois Le Bas
SSA stands for ' Singular Spectrum Analysis '. It combines elements of classical time series decomposition, statistics, multivariate geometry, dynamical systems and signal processing. SSA decomposes time series into a sum of components (ETs), with each component representing a lower smoothing, using several SVD ( Singular Value Decompositions ). It is a powerful filtering process used in many fields of research (climatology, biomedical, aerospace, etc), where high quality forecasting and smoo
Big Figure Indicator
Vonjinirina Alfred Randrianiaina
"BIG FIGURE INDICATOR", otomatik olarak fiyat grafiklerindeki belirli seviyelerde yatay çizgiler tanımlar ve çizer; örneğin, bütün sayılar veya yarım sayılar gibi (örneğin, para birimi işlemlerinde 1.0000 veya 1.5000). Bu seviyeler, büyük tüccarların ve yatırımcıların odaklanabileceği yuvarlak sayıları temsil ettikleri için psikolojik olarak önemli kabul edilir ve potansiyel destek veya direnç seviyelerine yol açabilir. Büyük rakam göstergesi, tüccarların önemli fiyat seviyelerini belirlemeleri
FREE
Beautiful
Tatiana Savkevych
The Beautiful indicator shows potential market reversal points. The intelligent algorithm of the indicator detects the trend well, filters out market noise and generates input signals and exit levels. Uses just one parameter for settings. Simple, visual and efficient trend detection. The indicator does not redraw and does not lag. You can set up message alerts as sound or email. Works on all currency pairs and on all timeframes. Ready-made trading system.
MQLTrend
Mohammad Reza Aghaei
This tool helps you to control the situation at other times and include them in your trades when analyzing the market  This tool scans the market and reports the movement of the market at different times With the help of this tool, you can prevent many wrong analyzes With the help of this tool, you can have an overview of the market in the shortest time and save your time
FREE
OVERVIEW The Vector Candle Zones Render indicator automatically renders boxes for vector candle zones that are yet to be recovered. The indicator is an implementation of an existing PVA candles indicator. Combine it with PVSRA and MarketMakerMethod strategy. FEATURES Software: MetaTrader4 - MT4 - 600+ build Timeframes: Multi-Timeframe Markets: Forex/Cryptos/Energies/Bonds/Metals/Indices/Futures/Commodities Customizable style parameters: Change Color style Chan
MT Scanner
Niravkumar Maganbhai Patel
4 (3)
This indicator helps you to Scan symbols which are in the Market Watch Window  and filter out trends with alerts. It works based on the effective indicator "SUPERTREND" which is used by many traders for trading: When box color changes to " Green " or " Red " color, it indicates you for trend change for long and short entry. And also you will get alerted on screen. When it changes to " Green ", it indicates you that trend is going upwards, and you can take the long entry. If the color changes to
FREE
Trend Star
Ivan Simonika
5 (1)
The indicator ignores sharp fluctuations and market noise and tracks market trends with absolute reliability. It is suitable for trading on small timeframes and on large ones, it ignores sudden price spikes or price movement corrections due to the reduction of market noise around the average price value. For calculations, the indicator uses indicators: iLow, iHigh, iMA, iATR. Since the output signal relies on reliable indicators, it is also reliable. You can configure both a sound signal and se
Extremum Reverse Bar
Yurij Izyumov
3.55 (11)
This indicator has been created for finding the probable reversal points of the symbol price. A small candlestick reversal pattern is used it its operation in conjunction with a filter of extremums. The indicator is not redrawn! If the extremum filter is disabled, the indicator shows all points that have a pattern. If the extremum filter is enabled, the condition works – if the history Previous bars 1 candles back contains higher candles and they are farther than the Previous bars 2 candle, such
FREE
Unveil the Secret to Trading with Joker's TrendMaster!  Ready to outperform the markets with a proven and reliable strategy? Look no further! Introducing Joker's TrendMaster, the revolutionary indicator crafted by Yuri Congia! With Joker's TrendMaster, you'll gain access to a powerful combination of advanced technical analysis and unique strategic insights. Limited-time Special Opportunity: Seize the moment! Be among the first 10 (Purchasing 1/10) to seize this unique opportunity, and not
FREE
Lisek Stochastic
Darius Hans Lischka
3 (7)
Lisek Stochastic   oscillator indicator with Alarm, Push Notifications and e-mail  Notifications. The Stochastic indicator is a momentum indicator that shows you how strong or weak the current trend is. It helps you identify overbought and oversold market conditions within a trend. The Stochastic indicator is lagging indicator, which means it don't predict where price is going, it is only providing data on where price has been !!! How to trade with Stochastic indicator: Trend following: As lon
FREE
Real Channel
Vitalii Zakharuk
The key difference between the Real Channel indicator and other channel indicators (for example, from the same Bollinger) is that the Real Channel takes into account not simple moving averages, but twice smoothed ones, which, on the one hand, makes it possible to more clearly determine the market movement, and on the other hand makes the indicator less sensitive. Real Channel is a non-redrawing channel indicator based on moving averages.
Super trend is one of the best trend indicators in metatrader 4 (MT4). Triple SuperTrend indicator is an indicator that consist of three super trend indicator that can be aranged. This indicator is built by mql4 language and doesn't provided by MT4 platform. Highly recommended using EMA SuperTrend Strategy Indicator if you want to get better result in here: https://www.mql5.com/en/market/product/91664 This indicator is easy to use, power full and has many benefits, there are: Using three ind
FREE
TrendPlus
Sivakumar Subbaiya
4.21 (14)
Trend Plus   Trendplus  Indicator   Time Frame: Suitable for any time frame.  Purpose: Trend Prediction. Blue and red candle indicate the buy and sell call respectively. Buy: When the blue candle is formed buy call is initiated. close the buy trades when the next red candle will formed.   Sell: When the Red candle is formed Sell call is initiated. close the Sell trades when the next blue candle will formed.   Happy trade!!
FREE
Ska ZigZag BuySell
NKATEKO VUKOSI LEROY MASANGO
Ska ZigZag BuySell indicator determines the overbought and oversold regions within a trend. The indicator determines the overbought region by the candlestick high and the oversold region by the candlestick low. This indicator only gives signals with arrow and audible alerts each and every time when a new candlestick appear. To utilize the full strategy i recommend using "Ska ZigZag BuySell" together with "Ska ZigZag Line". The Ska ZigZag Line indicator is available for free. NOTE: Indicator is h
Elephant Candle
David Leander Tschacher
The Elephant Candle is an indicator for MT4. It draws arrows when strong bullish or bearish candles appear. Strong candles frequently initiate a new trend. The arrows can be used in expert advisors. This indicator can improve already existing trading strategies. The indicator is very fast and doesn't repaint. Inputs Period Candle Multiplier Candle Niceness [%] Arrow Size Enable Alert Enable Push Notification Enable Email
Doonchian
Andriy Sydoruk
The Doonchian channel consists of two channel displays. Channel lines are determined by a simple and reliable algorithm. The channel is preferably used for trading inside the channel. The indicator does not redraw and does not lag; simple algorithms are the basis of the work. It works on all currency pairs and on all timeframes. As always a warning, we must not forget that the approach must be comprehensive, the indicator signals require additional information to enter the market.
The indicator trades during horizontal channel breakthroughs. It searches for prices exceeding extreme points or bouncing back, monitors night flat and defines targets using customizable Fibo levels with a sound alert, which can be disabled if necessary. The indicator allows you to create a horizontal channel between the necessary extreme points in visual mode quickly and easily. It automatically applies your selected Fibo levels to these extreme points (if the appropriate option is enabled in t
Developed methods for trading collected in one indicator. In the form of arrows, it defines entries in the direction of the trend. It has 2 types of arrows - trend and signal guides, informing about the potential movement in the direction of the trend. Works without redrawing, ready for use on all symbols/tools. The most suitable time frames to use are M15, M30, H1, H4. How to use The indicator finds the direction of the trend in the form of a signal arrow, a graphic rectangle stretches
The Sentiment Ratio indicator gauges current Market Sentiment between -100% and 100%, where lower than -40% is considered Bearish and higher than 40% is Bullish. The channel between the two is considered Neutral. The indicator has been a very useful filter tool for signals within a trading system. Example call function:  int SentimentIndicator(double triggerLevel)//Return sentiment if trigger level is activated {   double sentimentRatio=iCustom(NULL,0,"Sentiment Ratio",0,0,0);   if(sentimentRa
FREE
Smart Channel is a non-redrawing channel indicator based on moving averages. The indicator is used to identify trends in financial markets and indicates the direction of price movement. Smart Channel, in fact, is a miniature trading strategy, since, regardless of the construction methods, it uses the tactics of rebounding from the boundaries of the built channel, and the boundaries themselves are used as guidelines for the correct placement of stop loss and take profit orders. The key diffe
Drawing Pack
John Louis Fernando Diamante
4 (1)
This indicator provides several drawing tools to assist in various methods of chart analysis. The drawings will keep their proportions (according to their handle trendline) across different chart scales, update in real time, and multiple drawings are supported. # Drawing Option Description  1 Grid box draggable boxed grid, user defines rows x colums, diagonal ray option  2 Grid partial or fullscreen grid, sized by handle line  3 Grid flex a diagonal grid, sized and sloped by handle line
This indicator will provide you with everything you need in order to overcome losses due to human emotions. The indicator determines the moments of a trend reversal and the direction of its movements. This development is equipped with the most modern, adaptable trading algorithms. The main secret of short-term trading is to have information on when to enter a deal. The indicator works great on all timeframes and informs the trader about the most successful moments of buying or selling a currency
Free automatic Fibonacci is an indicator that automatically plots a Fibonacci retracement based on the number of bars you select on the BarsToScan setting in the indicator. The Fibonacci is automatically updated in real time as new highest and lowest values appears amongst the selected bars. You can select which level values to be displayed in the indicator settings. You can also select the color of the levels thus enabling the trader to be able to attach the indicator several times with differe
FREE
The indicator is a set of parameters for setting three moving averages (fast, medium and slow), which can be used to analyze the market. This indicator provides the ability to analyze market trends and make trading decisions based on the intersections of various moving averages. It also supports audio alerts for timely notification of trading signals. LengthFaster: Sets the number of candles used to calculate the faster moving average. A value of 5 means using price data from the last 5 can
T3IndiFast
Ridwan Kureemun
Supporting file (2 of 2) for T3 Cloud MA Trend indicator derived from T3 moving averages. The cloud is bounded by a fast T3 and slow T3 lines. Buying/Selling opportunities above/below cloud. The fast and slow T3 MA lines can also be used as dynamic support/resistance for more aggressive entries. Use default values for best settings. The number of look back bars is user defined. This indicator can be used in combination with other strategies such as price action. Suitable for all time frames. P
FREE
T3IndiSlow
Ridwan Kureemun
Supporting file (1 of 2) for T3 Cloud MA Trend indicator derived from T3 moving averages. The cloud is bounded by a fast T3 and slow T3 lines. Buying/Selling opportunities above/below cloud. The fast and slow T3 MA lines can also be used as dynamic support/resistance for more aggressive entries. Use default values for best settings. The number of look back bars is user defined. This indicator can be used in combination with other strategies such as price action. Suitable for all time frames. P
FREE
SpectorChart
Sergii Krasnyi
5 (1)
Bu gösterge mum çubuğu kenarlarının ve gövdelerinin renginin yanı sıra hacimlerin rengini de gerçek zamanlı olarak sürekli değiştirir. Göstergenin kullanımı kolaydır. Renk paleti çok çeşitlidir. Bu ürün grafiksel bir çözümdür, bu nedenle metinle ne yaptığını açıklamak zordur, indirerek görmek daha kolaydır, ayrıca ürün ücretsizdir. Gösterge, video düzenleme için bir grafiğin güzel bir resmini oluşturmak isteyen blog yazarları veya grafiklerini canlı hale getirmek, gerçek zamanlı olarak renk değ
FREE
Advanced SSA
Jean Francois Le Bas
SSA stands for 'Singular Spectrum Analysis'. It combines elements of classical time series decomposition, statistics, multivariate geometry, dynamical systems and signal processing. SSA decomposes time series into a sum of components (ETs), with each component representing a lower smoothing, using several SVD (Singular Value Decompositions). It is a powerful filtering process used in many fields of research (climatology, biomedical, aerospace, etc), where high quality forecasting and smoothin
Bu ürünün alıcıları ayrıca şunları da satın alıyor
TPSpro RFI Levels
Roman Podpora
4.86 (21)
Reversal First Impulse levels (RFI)    INSTRUCTIONS        RUS       -       ENG              R ecommended to use with an indicator   -   TREND PRO -  Version MT5 A key element in trading is zones or levels from which decisions to buy or sell a trading instrument are made. Despite attempts by major players to conceal their presence in the market, they inevitably leave traces. Our task was to learn how to identify these traces and interpret them correctly. Main functions: Displaying active zones
Şu anda %20 İNDİRİMLİ! Herhangi bir Acemi veya Uzman Tüccar için En İyi Çözüm! Bu gösterge paneli yazılımı 28 döviz çifti üzerinde çalışıyor. Ana göstergelerimizden 2'sine (Gelişmiş Para Birimi Gücü 28 ve Gelişmiş Para Birimi Dürtüsü) dayanmaktadır. Tüm Forex piyasasına harika bir genel bakış sağlar. Gelişmiş Para Birimi Gücü değerlerini, para birimi hareket hızını ve tüm (9) zaman dilimlerinde 28 Forex çifti için sinyalleri gösterir. Trendleri ve / veya scalping fırsatlarını belirlemek içi
Scalper Inside PRO
Alexey Minkov
4.75 (59)
An exclusive indicator that utilizes an innovative algorithm to swiftly and accurately determine the market trend. The indicator automatically calculates opening, closing, and profit levels, providing detailed trading statistics. With these features, you can choose the most appropriate trading instrument for the current market conditions. Additionally, you can easily integrate your own arrow indicators into Scalper Inside Pro to quickly evaluate their statistics and profitability. Scalper Inside
TPSproTREND PrO
Roman Podpora
4.78 (18)
TPSpro TRENDPRO  - is a trend indicator that automatically analyzes the market and provides information about the trend and each of its changes, as well as giving signals for entering trades without redrawing! The indicator uses each candle, analyzing them separately. referring to different impulses - up or down impulse. Exact entry points into transactions for currencies, crypto, metals, stocks, indices!  -  Version MT5               DETAILED DESCRIPTION                R ecommended to use with
TrendMaestro
Stefano Frisetti
5 (3)
note: this indicator is for METATRADER4, if you want the version for METATRADER5 this is the link:  https://www.mql5.com/it/market/product/108106 TRENDMAESTRO ver 2.4 TRENDMAESTRO recognizes a new TREND in the bud, he never makes mistakes. The certainty of identifying a new TREND is priceless. DESCRIPTION TRENDMAESTRO identifies a new TREND in the bud, this indicator examines the volatility, volumes and momentum to identify the moment in which there is an explosion of one or more of these data a
Atomic Analyst
Issam Kassas
5 (3)
Öncelikle belirtmek gerekir ki bu Ticaret Göstergesi Yeniden Çizim Yapmaz, Gecikmez ve Gecikme Göstermez, bu da hem manuel hem de robot ticareti için ideal hale getirir. Kullanıcı kılavuzu: ayarlar, girişler ve strateji. Atom Analisti, Piyasada Daha İyi Bir Avantaj Bulmak İçin Fiyatın Gücünü ve Momentumunu Kullanan PA Fiyat Hareketi Göstergesidir. Gürültüleri ve Yanlış Sinyalleri Kaldırmaya ve Ticaret Potansiyelini Artırmaya Yardımcı Olan Gelişmiş Filtrelerle Donatılmıştır. Birden fazla katma
The AT Forex Indicator MT4 is a sophisticated trading tool designed to provide traders with a comprehensive analysis of multiple currency pairs. This   powerful indicator   simplifies the complex nature of the forex market, making it accessible for both novice and experienced traders. AT Forex Indicator uses   advanced algorithms   to detect trends, patterns and is an essential tool for traders aiming to enhance their forex trading performance. With its robust features, ease of use, and reliabl
FX Volume
Daniel Stein
4.61 (36)
Sabah Brifingimiz aracılığıyla ayrıntılar ve ekran görüntüleri ile günlük piyasa güncellemenizi alın burada mql5 ve on Telegram ! FX Volume, bir brokerin bakış açısından piyasa duyarlılığı hakkında GERÇEK bir fikir veren İLK ve TEK hacim göstergesidir. COT raporlarından çok daha hızlı bir şekilde, brokerlar gibi kurumsal piyasa katılımcılarının Forex piyasasında nasıl konumlandıklarına dair harika bilgiler sağlar. Bu bilgileri doğrudan grafiğinizde görmek, ticaretiniz için gerçek oyun değiştir
Trend Screener
STE S.S.COMPANY
4.83 (89)
Trend Göstergesi, Trend Alım Satım ve Filtreleme için Çığır Açan Benzersiz Çözüm, Tüm Önemli Trend Özellikleriyle Tek Bir Araç İçinde Yerleştirildi! Forex, emtialar, kripto para birimleri, endeksler ve hisse senetleri gibi tüm sembollerde/araçlarda kullanılabilen %100 yeniden boyamayan çoklu zaman çerçevesi ve Çoklu para birimi göstergesidir. Trend Screener, grafikte noktalarla ok trend sinyalleri sağlayan etkili bir trend trend göstergesidir. Trend analizörü göstergesinde bulunan özellikler: 1.
Entry Points Pro
Yury Orlov
4.7 (226)
Yeniden boyamadan bir ticarete girmek için doğru sinyaller sağlayan MT5 için en iyi gösterge! Herhangi bir finansal varlığa uygulanabilir: forex, kripto para birimleri, metaller, hisse senetleri, endeksler. MT5 versiyonu burada Oldukça doğru alım satım sinyalleri sağlayacak ve bir alım satımı açıp kapatmanın en iyi zamanını size söyleyecektir. Göstergeyi ödeyen yalnızca bir sinyali işleme örneğiyle videoyu (6:22) izleyin! Çoğu tüccar, Giriş Noktaları Pro göstergesinin yardımıyla ilk işl
Indicator : RealValueIndicator Description : RealValueIndicator is a powerful tool designed specifically for trading on the EURUSD pair. This indicator analyzes all EUR and USD pairs, calculates their real currency strength values, and displays them as a single realistic value to give you a head start on price. This indicator will tell you moves before they happen if you use it right. RealValueIndicator allows you to get a quick and accurate overview of the EURUSD currency pair tops and bottoms,
Enigmera
Ivan Stefanov
5 (4)
ENIGMERA: Pazarın çekirdeği https://www.enigmera.com Giriş Bu gösterge ve ticaret sistemi, finansal piyasalar için dikkate değer bir yaklaşımdır. ENIGMERA, destek ve direnç seviyelerini doğru bir şekilde hesaplamak için fraktal döngüleri kullanır. Gerçek birikim aşamasını gösterir ve yön ve hedefler verir.  İster bir trendde ister bir düzeltmede olalım çalışan bir sistem.  Nasıl çalışır? ENIGMERA üç çizgiden oluşur: destek/direnç çizgisi, hedef çizgisi ve sapma çizgisi. Sistem, geçmiş veril
NAM Order Blocks
NAM TECH GROUP, CORP.
5 (1)
MT4 Multi-timeframe Order Blocks detection indicator. Features - Fully customizable on chart control panel, provides complete interaction. - Hide and show control panel wherever you want. - Detect OBs on multiple timeframes. - Select OBs quantity to display. - Different OBs user interface. - Different filters on OBs. - OB proximity alert. - ADR High and Low lines. - Notification service (Screen alerts | Push notifications). Summary Order block is a market behavior that indicates order collection
All in One Trade
Alexey Minkov
4.48 (27)
The All-in-One Trade Indicator (AOTI) determines daily targets for EURUSD, EURJPY, GBPUSD, USDCHF, EURGBP, EURCAD, EURAUD, AUDJPY, GBPAUD, GBPCAD, GBPCHF, GBPJPY, AUDUSD, and USDJPY. All other modules work with any trading instruments. The indicator includes various features, such as Double Channel trend direction, Price channel, MA Bands, Fibo levels, Climax Bar detection, and others. The AOTI indicator is based on several trading strategies, and created to simplify market analysis. All-in-One
Shepherd Gann Squares
Abdullah Alrai
4.9 (10)
Bu gösterge, W.D. Gann'ın dokuzun karesi ve 144'ün karesine bağlı olarak yazdığı "Piyasa tahminleri için matematiksel formül" makalesine dayanan bir piyasa analiz yöntemidir. Kullanım kılavuzu: Add Your review And contact us to get it Tam MT5 Sürümünü Şunlardan Satın Alabilirsiniz: https://www.mql5.com/en/market/product/28669 MT4'te ücretsiz olarak test edebilirsiniz: https://www.mql5.com/en/market/product/15320?source=Site +Profile+Seller#!tab=reviews Bu ürün sizin için
Tanıtım       Kuantum Trend Keskin Nişancı Göstergesi   , trend tersine dönmeleri belirleme ve ticaret yapma şeklinizi değiştiren çığır açan MQL5 Göstergesi! 13 yılı aşkın ticaret tecrübesine sahip deneyimli tüccarlardan oluşan bir ekip tarafından geliştirilmiştir.       Kuantum Trend Keskin Nişancı Göstergesi       trend dönüşlerini son derece yüksek doğrulukla belirlemenin yenilikçi yolu ile ticaret yolculuğunuzu yeni zirvelere taşımak için tasarlanmıştır. ***Kuantum Trend Keskin Nişancı Gö
System Trend Pro - This is the best trend trading indicator!!! The indicator no repaint!!!   The indicator has   MTF   mode, which adds confidence to trading on the trend (   no repaint   ). How to trade? Everything is very simple, we wait for the first signal (big arrow), then wait for the second signal (small arrow) and enter the market in the direction of the arrow. (See screens 1 and 2.) Exit on the opposite signal or take 20-30 pips, close half of it, and keep the rest until the oppo
Gold Channel is a volatility-based indicator, developed with a specific timing algorithm for the XAUUSD pair, which consists of finding possible corrections in the market. This indicator shows two outer lines, an inner line (retracement line) and an arrow sign, where the theory of the channel is to help identify overbought and oversold conditions in the market. The market price will generally fall between the boundaries of the channel. If prices touch or move outside the channel it is a tra
Cycle Sniper
Elmira Memish
4.41 (37)
NEW YEAR SALE PRICE FOR LIMITED TIME!!! Please contact us after your purchase and we will send you the complimentary indicators to complete the system Cycle Sniper is not a holy grail but when you use it in a system which is explained in the videos, you will feel the difference. If you are not willing to focus on the charts designed with Cycle Sniper and other free tools we provide, we recommend not buying this indicator. We recommend watching the videos about the indiactor and system before pu
norepaint buy sell indicator is norepaint indicator.and works all pairs and all timeframes. Indicator hold too long way to signals. So 5m chart and 15m chart more suitable. using is wery simple ,it puts arrow on price probably buy sell arrows. thise indicator is suitable for beginner and experienced traders. there is cnt numbers that show how many bars you see the signal back. increasing it possible but up to chart have the how many bars . minimum value of this 500.
GOLD Impulse with Alert
Bernhard Schweigert
4.56 (9)
Bu gösterge, 2 ürünümüz Advanced Currency IMPULSE with ALERT  +   Currency Strength Exotics  'in süper bir kombinasyonudur. Tüm zaman dilimleri için çalışır ve 8 ana para birimi artı bir Sembol için grafiksel olarak güç veya zayıflık dürtüsünü gösterir! Bu Gösterge, Altın, Egzotik Çiftler, Emtialar, Endeksler veya Vadeli İşlemler gibi herhangi bir sembol için para birimi gücü ivmesini göstermek için uzmanlaşmıştır. Türünün ilk örneğidir, Altın, Gümüş, Petrol, DAX, US30, MXN, TRY, CNH vb.
Quantum Breakout Indicator PRO
Bogdan Ion Puscasu
4.96 (26)
Tanıtım       Quantum Breakout PRO   , Breakout Bölgeleri ile ticaret yapma şeklinizi değiştiren çığır açan MQL5 Göstergesi! 13 yılı aşkın ticaret deneyimine sahip deneyimli tüccarlardan oluşan bir ekip tarafından geliştirilen   Quantum Breakout PRO   , yenilikçi ve dinamik koparma bölgesi stratejisiyle ticaret yolculuğunuzu yeni zirvelere taşımak için tasarlanmıştır. Kuantum Breakout Göstergesi, size 5 kar hedefi bölgesi ile kırılma bölgelerinde sinyal okları ve kırılma kutusuna dayalı ol
ECM Elite Channel is a volatility-based indicator, developed with a specific time algorithm, which consists of finding possible corrections in the market. This indicator shows two outer lines, an inner line (retracement line) and an arrow sign, where the channel theory is to help identify overbought and oversold conditions in the market. The market price will generally fall between the boundaries of the channel. If prices touch or move outside the channel, it's a trading opportunity. The
Currency Strength Exotics
Bernhard Schweigert
4.88 (33)
ŞU ANDA %20 INDIRIMLI! Herhangi bir Acemi veya Uzman Tüccar için En İyi Çözüm! Bu Gösterge, Egzotik Çiftler Emtialar, Endeksler veya Vadeli İşlemler gibi herhangi bir sembol için para birimi gücünü göstermek için uzmanlaşmıştır. Türünün ilk örneğidir, Altın, Gümüş, Petrol, DAX, US30, MXN, TRY, CNH vb. gerçek para birimi gücünü göstermek için 9. satıra herhangi bir sembol eklenebilir. Bu benzersiz, yüksek kaliteli ve uygun fiyatlı bir ticaret aracıdır çünkü bir dizi tescilli özelliği ve yeni
MT4 için Astronomi Göstergesini Tanıtıyoruz: En İleri Göksel Ticaret Arkadaşınız Ticaret deneyiminizi göksel seviyelere yükseltmeye hazır mısınız? MT4 için devrim niteliğindeki Astronomi Göstergemizi arayın. Bu yenilikçi araç karmaşık algoritmaları kullanarak eşsiz astronomik içgörüler ve hassas hesaplamalar sunmak için geleneksel ticaret göstergelerini aşmaktadır. Bilgi Evreni Parmaklarınızın Ucunda: Göksel verilerin hazinelerini açığa çıkaran kapsamlı bir paneli gözlemleyin. Gezegenlerin geo/h
REMINDER: Early buyers hot price discount: Price subject to rise after first 20 copies. Starting price $65 and final price will be $1275. Secure your discounted copy Now! Smart Money Analyser Indicator User Manual 1. Introduction Welcome to the   Smart Money Analyser Indicator This powerful tool provides traders with comprehensive market analysis by combining various technical indicators to generate actionable trading signals. Designed to be user-friendly, this indicator helps traders of a
Up down v6T
Guner Koca
5 (1)
Thise indicator is up down v6  comes with tradingwiev pinescript. purchased people, after installed on terminal ,contact me on mql5  to get BONUS  TradingView pinescript. up-down indicator is no repaint and works all pairs and lower than weekly time frames charts. it is suitable also 1 m charts for all pairs. and hold long way to signal. dont gives too many signals. when red histogram cross trigger line that is up signal.and price probably will down when blue histogram cross trigger line that
Please send me Direct message on MQL5 CHAT after purchasing the Indicator for Training and Installation Support There are some additional files that is important to use with the Indicator . So be sure to contact me after purchasing the Indicator So that I can add you for training and support . If you find any difficulty with installation then send me Direct message here So that I can connect with you via Anydesk or Teamview for the product installation. " Smart Order Block Indicator " to find
Price Action Entry Alerts
Stephen Sanjeeve Sahayam
5 (3)
Bu gösterge, alış veya satış baskısı için her çubuğu tarar ve en yüksek hacme sahip 4 tip mum modelini tanımlar. Bu mumlar daha sonra Alış veya Satış sinyallerini göstermek için birkaç doğrusal filtre kullanılarak filtrelenir. Sinyaller, daha yüksek zaman çerçevesi yönüyle bağlantılı olarak ve yüksek hacimli saatlerde alım satım yapıldığında en iyi sonucu verir. Tüm filtreler özelleştirilebilir ve bağımsız çalışır. Bir düğmeyi tıklayarak tek bir yönün sinyallerini görüntüleyebilir. Bu gösterge
How to use Pair Trading Station Pair Trading Station is recommended for H1 time frame and you can use it for any currency pairs. To generate buy and sell signal, follow few steps below to apply Pair Trading Station to your MetaTrader terminal. When you load Pair Trading Station on your chart, Pair Trading station will assess available historical data in your MetaTrader platforms for each currency pair. On your chart, the amount of historical data available will be displayed for each currency pai
Yazarın diğer ürünleri
Aurum Apex Mt4 EA
Martin Alejandro Bamonte
Aurum Apex EA Açıklaması Aurum Apex EA, MT4 Platformu için tasarlanmış güçlü bir %100 otomatik ticaret aracıdır. Piyasayı gerçek zamanlı olarak analiz eder ve çeşitli ticaret fırsatlarını tespit eder. Tüm seviyelerdeki tüccarlar için uygun olan Aurum Apex EA, Risk parametresi aracılığıyla ayarlanabilen üç risk modu sunar: Risk = 0.1 (Düşük Risk): Altın hareketlerine aşina olmayan yeni tüccarlar için idealdir. Bu ayar sürprizleri en aza indirirken güveni artırır. Risk = 0.2 (Orta Risk): Altın ti
BullsEye Signal NoRepaint
Martin Alejandro Bamonte
BullseyeSignal – NoRepaint adından da anlaşılacağı gibi, hiçbir koşulda yeniden çizilmez. Sinyal, görüntüde görülen aynı mum üzerinde verilir. Forex, kripto para birimleri, hisse senetleri, endeksler ve vadeli işlemler gibi yüksek volatiliteye sahip piyasalar için idealdir. Satın almak için yeşil bir ok ve satmak için kırmızı bir ok göreceksiniz, ancak arka planda daha basitleştirilmiş bir ticaret deneyimi sağlamak için birçok gösterge birlikte çalışmaktadır. Özellikle doğru girişler sağlamak üz
NextCandlePredictor Göstergesi NextCandlePredictor, yeniden boyamayan, rengini değiştirmeyen, hareket etmeyen, kaybolmayan ve gecikme olmayan bir uyarılı sinyal göstergesidir. Herhangi bir zaman diliminde bir sonraki veya yaklaşan mumların yönünü belirlemenize yardımcı olacaktır. New York, Londra veya her ikisinin de çakıştığı yüksek volatiliteye sahip piyasalar için şiddetle tavsiye edilir. Ana Özellikler: Zaman Dilimlerinde Esneklik: M1'den H1'e ve ötesine kadar herhangi bir zaman diliminde hı
MTFMA (Çok Zaman Çerçeveli Hareketli Ortalamalar) göstergesi, ana grafikten ayrı bir pencerede farklı zaman dilimlerinde birden fazla hareketli ortalamayı (MA) kullanarak alım ve satım sinyalleri sağlar (yeniden boyamaz). Küçük zaman dilimlerinde scalping için ve daha büyük zaman dilimlerinde uzun vadeli ticaret için uygun, çok yönlü ve kolay yorumlanabilen bir göstergedir. Neden Multi-Frame? Çok zaman çerçeveli terimi, göstergenin birden fazla zaman diliminden gelen verileri kullanma ve birleşt
Scalping Signal NO Repaint NO Lag
Martin Alejandro Bamonte
5 (1)
"Scalping Signal No Repaint No Lag", herhangi bir şemaya sürüklendiğinde, herhangi bir şablon veya başka bir gösterge yüklemeye gerek kalmadan tüm gerekli göstergeleri otomatik olarak yükleyen piyasadaki tek göstergedir. Şemayı, sağlanan resimdekiyle tam olarak aynı olacak şekilde otomatik olarak yapılandırır. Bu gösterge, yeniden boyama veya gecikme olmadan sinyaller garanti eder, bu nedenle tüm döviz çiftleri ve zaman dilimlerinde (TF) scalping stratejileri için idealdir. Özellikler Göstergele
Clear Breakout
Martin Alejandro Bamonte
"Breakout Buy-Sell" göstergesi, farklı piyasa seansları (Tokyo, Londra ve New York) sırasında fiyat kırılmalarına dayalı olarak potansiyel alım ve satım fırsatlarını belirlemek ve vurgulamak için tasarlanmıştır. Bu gösterge, traderların alım ve satım bölgelerini, ayrıca kâr alma (TP) ve zarar durdurma (SL) seviyelerini net bir şekilde görselleştirmelerine yardımcı olur. Kullanım Stratejisi Gösterge şu şekilde kullanılabilir: İlk Kurulum : Piyasa seansını seçin ve GMT farkını ayarlayın. Piyasa Gö
GBPUSD Pip Hunter EA Ana Özellikler: M15 Zaman Çerçevesinde GBPUSD için Optimize Edilmiştir: Özellikle GBPUSD çifti için 15 dakikalık grafik üzerinde tasarlanmış ve test edilmiştir. Minimum Tavsiye Edilen Hesap Boyutu: Düşük geri çekilmeler sağlamak için minimum $1000 hesap bakiyesi gereklidir. Spread Uyumluluğu: Karlılığı maksimize etmek için düşük spread veya ECN hesaplarla en iyi şekilde kullanılır. Risk Yönetimi: Ticaret ihtiyaçlarınıza göre Ekponansiyel Lot özelliğini 1.0 olarak ayarlayarak
"MultiSymbol & TF Chart Integrated" göstergesi, tek bir grafikte (çoklu mod) tercih ettiğiniz zaman dilimlerinde 60'a kadar döviz çiftini izleyebilmenizi veya işlem yaptığınız çifti tüm TF'lerde görüntüleyebilmenizi (basit mod) sağlayarak piyasaya hızlı ve kapsamlı bir bakış sunmak üzere tasarlanmıştır. Ana Avantajlar: Tam İzleme: Tek bir grafikte tüm istenen çiftleri bir bakışta gerçek zamanlı olarak izlemeye olanak tanır. Zaman Tasarrufu: Grafikler arasında geçiş yapma ihtiyacını ortadan kald
Pairs and TF Changer
Martin Alejandro Bamonte
Farklı para çiftlerini ve zaman dilimlerini izlemek için birden fazla grafik arasında geçiş yapmaktan bıktınız mı? Pairs and TF Changer göstergesi ticaret deneyiminizi devrim yapacak! Stratejiniz için tüm göstergeleri yükledikten sonra, Pairs and TF Changer 'i grafiğe ekleyin. Gerekirse, konumunu, renklerini veya görüntülenen sütun sayısını ayarlayabilirsiniz! Ana Özellikler: Kesintisiz Entegrasyon: Bu göstergeyi ticaret stratejinize zahmetsizce entegre edin. Tek bir tıklamayla tüm para çiftler
Filtrele:
İnceleme yok
İncelemeye yanıt