Scalper Terminal X30
- Indicateurs
- Kenan Ozkarakas
- Version: 1.0
- Activations: 7
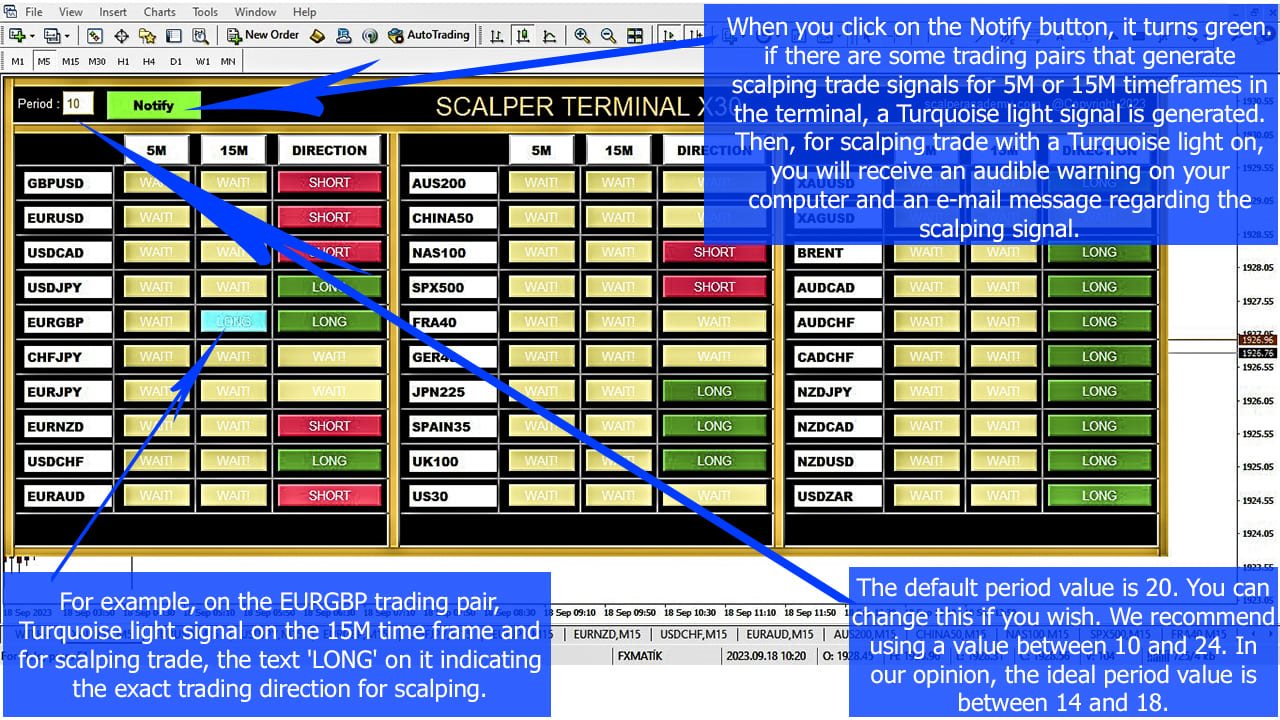
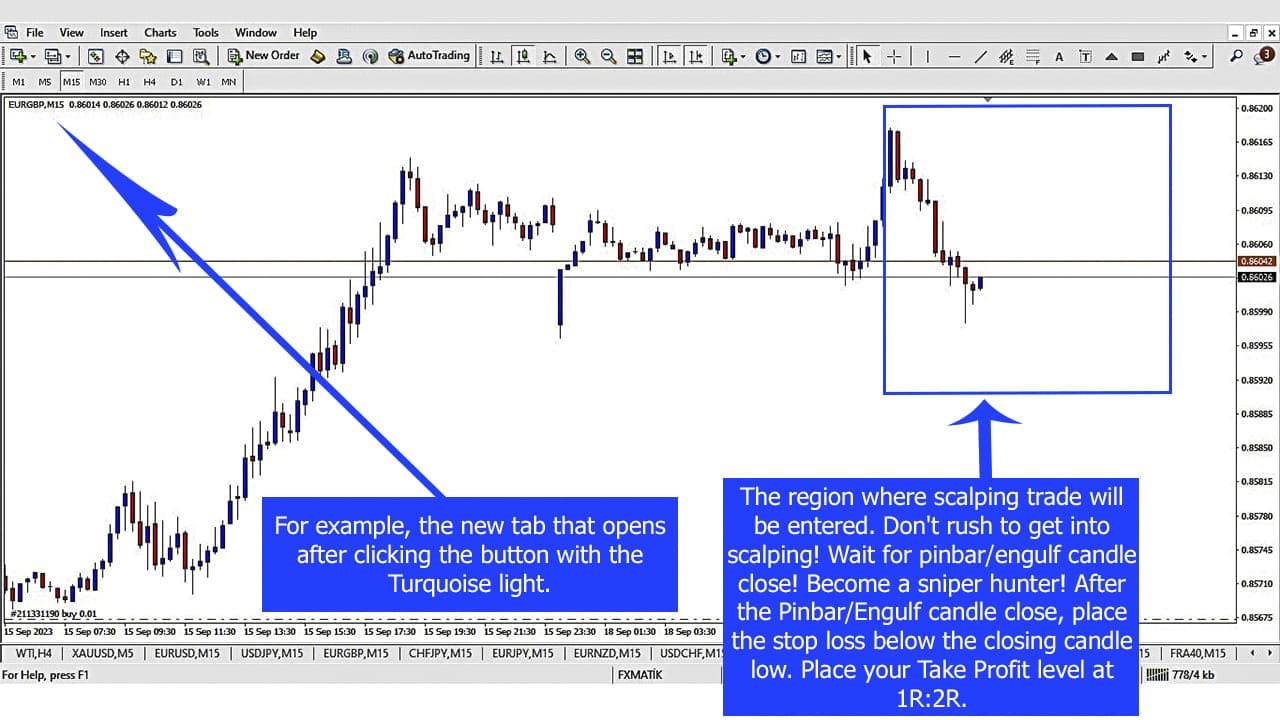
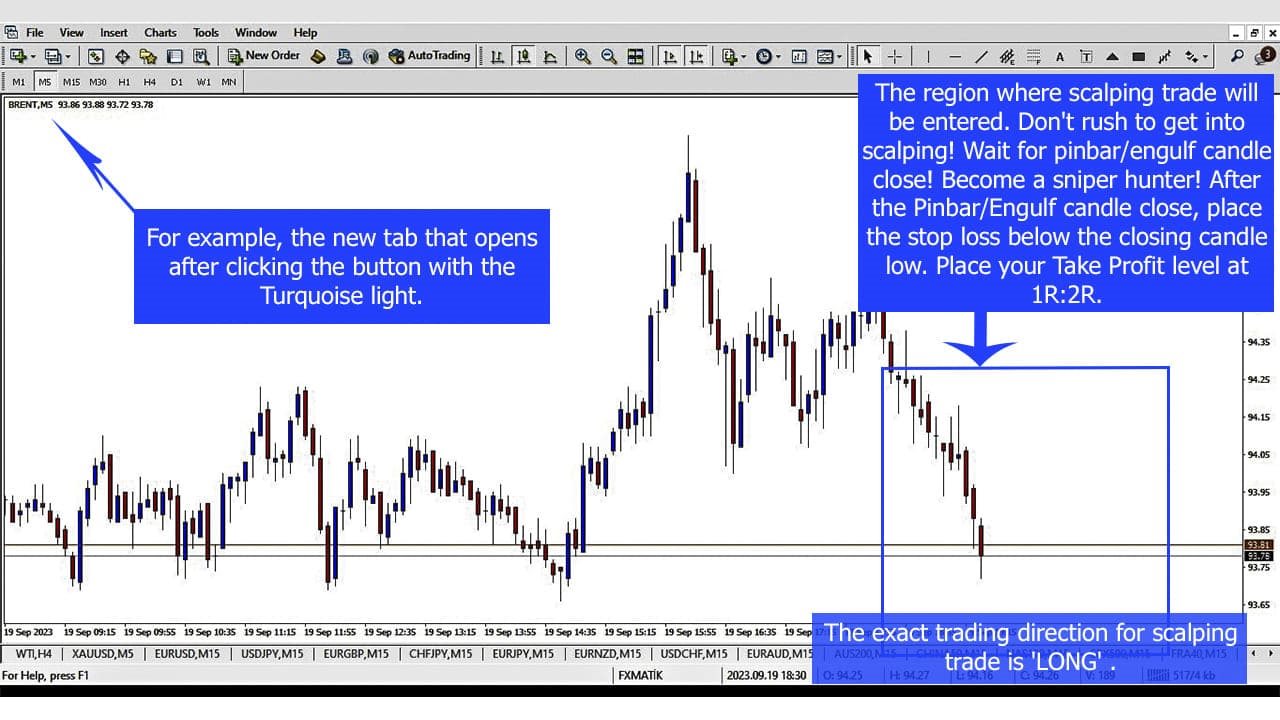
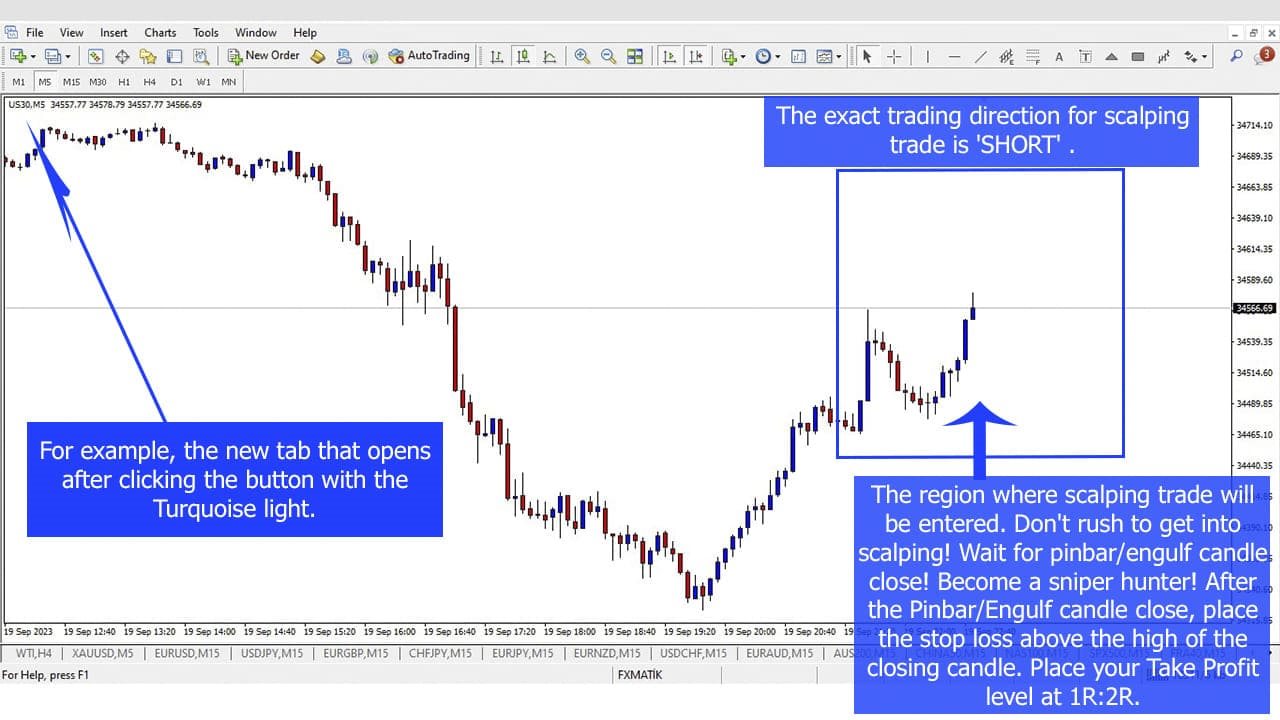
Le logiciel d’interface Scalper Terminal est un indicateur, il ne s’engage pas dans des transactions d’achat-vente automatiques. Cet indicateur montre la zone commerciale actuelle dans laquelle les transactions peuvent être effectuées lorsqu'une opportunité commerciale de scalping se présente. Lorsqu'il y a un signal de scalping, sur le côté droit de la paire de trading concernée, le voyant Turquoise s'allume et la direction exacte du trading est écrite au-dessus. Après cela, cliquez sur le bouton Turquoise pour saisir la transaction. Un nouvel onglet s'ouvre. Ensuite, des clôtures de bougies sont attendues, ce qui est une condition pour entrer dans le commerce du scalping.
Afin de réussir des transactions commerciales de scalping avec Scalper Terminal ;
- Assurez-vous de regarder les vidéos dans la section description. Restez fidèle au logiciel Scalper Terminal comme un soldat.
- À droite de chaque paire de trading se trouvent les colonnes 5M, 15M et DIRECTION. Tout d’abord, cliquez sur le bouton Notifier et rendez-le vert.
- Vous n'avez pas besoin de regarder constamment l'écran. Attendez simplement le signal lumineux turquoise ou le son du message d’alerte métatrader.
- Lisez la direction exacte de l'opération qui y est écrite (également le texte de la colonne DIRECTION), qui est une lumière turquoise. Dans la direction exacte du trading, cliquez sur le bouton Turquoise pour le scalping.
- Dans le nouvel onglet ouvert pour la transaction de scalping, attendez que le pinbar ou engloutissez la bougie se ferme comme un chasseur.
- Lorsque la fermeture du pinbar ou de la bougie engloutissante est la condition pour entrer dans la position, ouvrez une position dans la direction indiquée par le terminal Scalper.
- Ajoutez un ordre stop loss du côté opposé au sens d’entrée de la position. (Par exemple, s'il s'agit d'une transaction LONGUE, le lieu de l'ordre stop loss est le niveau le plus bas de la dernière bougie fermée.)
- Ensuite, ajoutez votre commande Takeprofit sous la forme 1R:2R.
- La seule condition de succès est d'entrer dans toutes les positions avec le même taux de risque et le stop loss doit être 1R et le Takeprofit doit être 2R. Utilisez un plugin Metatrader4 gratuit supplémentaire tel que le calculateur de taille de position (par exemple, PSC Trader.ex4) pour saisir des positions avec la taille de lot appropriée pour votre risque fixe.
- Scalper Terminal peut générer entre 5 et 20 signaux commerciaux de scalping au cours de la journée. (Dépend de la valeur de période en haut à gauche du logiciel. Je recommande d'utiliser la valeur 18)
- Soyez un chasseur comme un tireur d'élite ! Sois patient! Attendez le signal lumineux turquoise, puis attendez la fermeture de la bougie pinbar/engulf.
- Conservez une feuille de calcul Excel pour tous vos postes. Si vous suivez la règle risque-récompense 1R:2R, le succès est inévitable.
- Sélectionnez seulement 1 paire du groupe index et 1 paire du groupe Forex en même temps. Vous ne devez pas ouvrir de transactions dans plus d'une parité du même groupe.
- Lorsque vous ouvrez une transaction sur une paire avec un signal lumineux turquoise entrant, faites une pause de 1 à 2 heures pour entrer dans la transaction suivante. Parce qu'il serait plus idéal s'il y avait du temps entre deux transactions consécutives.