Scalper Terminal X30
- Göstergeler
- Kenan Ozkarakas
- Sürüm: 1.0
- Etkinleştirmeler: 7
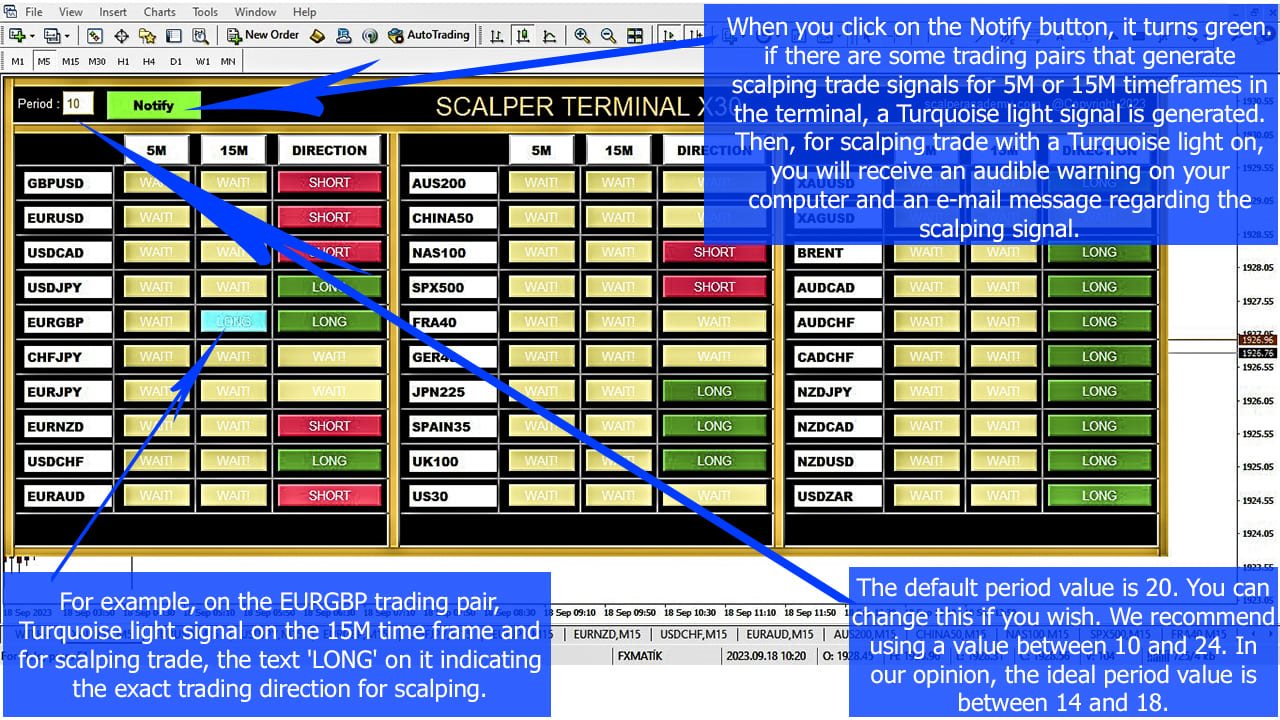
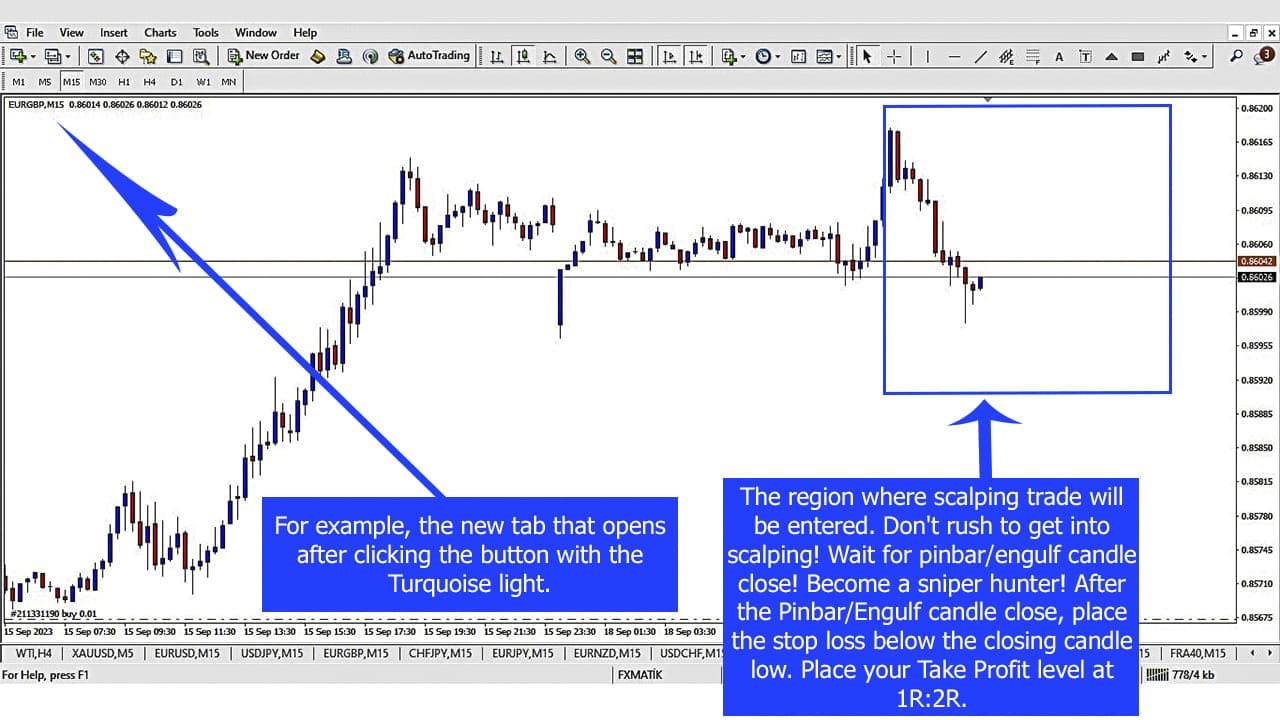
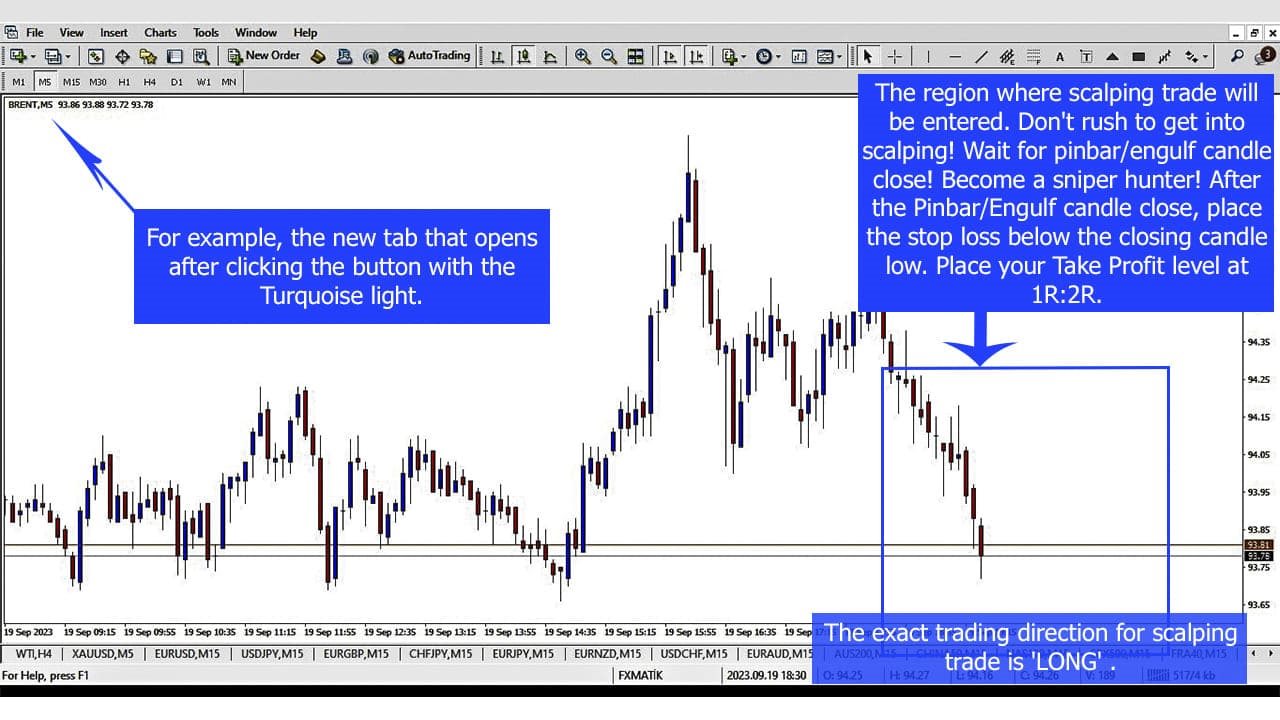
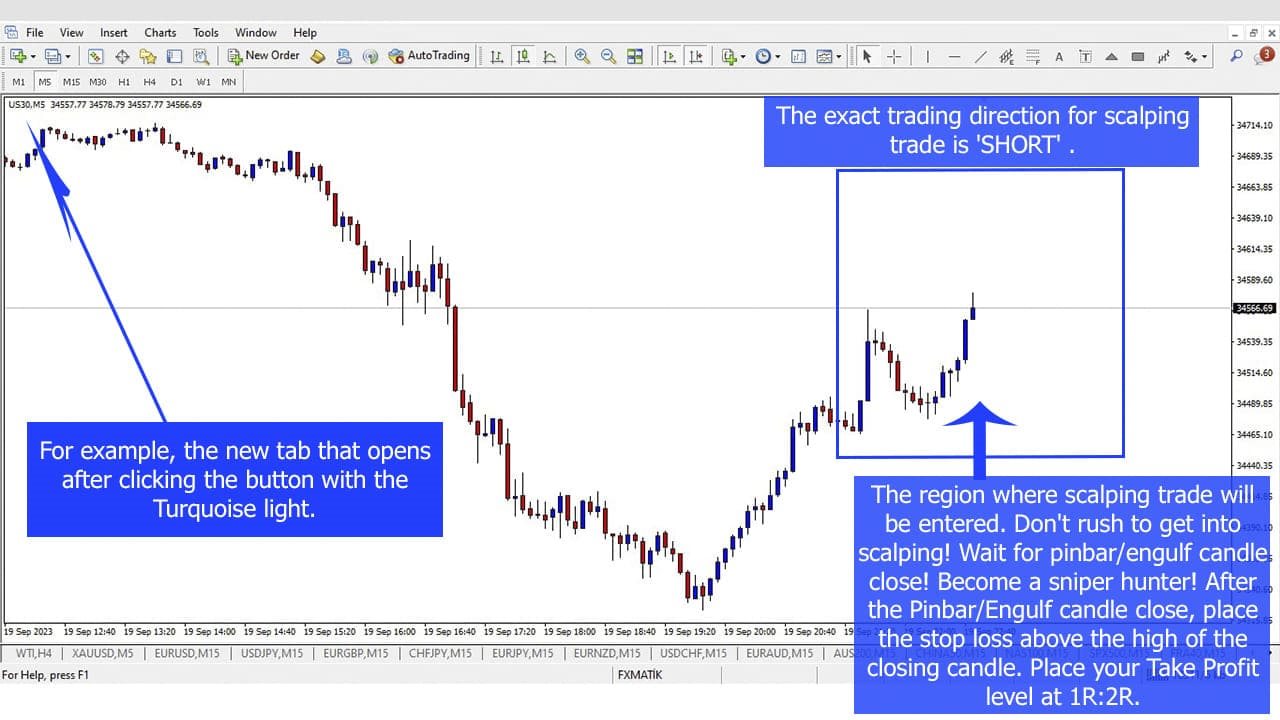
Scalper Terminal arayüz yazılımı indikatördür, otomatik alım-satım işlemleri yapmaz. Bu gösterge, ölçeklendirme ticaret fırsatı ortaya çıktığında işlemlerin girilebileceği mevcut ticaret bölgesini gösterir. Scalping sinyali oluştuğunda ilgili işlem çiftinin sağ tarafında Turkuaz ışık yanar ve üzerinde tam işlem yönü yazılır. Bundan sonra işleme girmek için Turkuaz butonuna tıklayın. Yeni bir sekme açılır. Daha sonra scalping ticaretine girişin şartı olan mum kapanışları bekleniyor.
Scalper Terminal ile başarılı scalping ticaret işlemleri gerçekleştirmek için;
- Açıklama kısmındaki videoları mutlaka izleyin. Scalper Terminal yazılımına bir asker gibi bağlı kalın.
- Her işlem çiftinin sağında 5M, 15M ve DIRECTION sütunları bulunur. Öncelikle Bildir butonuna tıklayın ve yeşil yapın.
- Sürekli ekranı izlemenize gerek yok. Turkuaz ışık sinyalini veya metatrader uyarı mesajı sesini bekleyin.
- Üzerinde yazılı olan turkuaz ışık olan çalışma yönünü (ayrıca YÖN Sütunu metni) tam olarak okuyun. Tam ticaret yönünde, ölçeklendirme için Turkuaz düğmesine tıklayın.
- Scalping işlemi için açılan yeni sekmede pinbarın gelmesini bekleyin veya bir avcı gibi mum yakınını yutun.
- Pozisyona girmek için pinbar veya yutma mumunun kapanması şart olduğunda, Scalper Terminali tarafından gösterilen yönde bir pozisyon açın.
- Pozisyonun giriş yönünün ters tarafına bir zararı durdurma emri ekleyin. (Örneğin, UZUN bir işlem ise zararı durdurma emrinin yeri son kapatılan mumun en düşük seviyesidir.)
- Daha sonra Takeprofit emrinizi 1R:2R olarak ekleyin.
- Başarının tek şartı tüm pozisyonlara aynı risk oranıyla girmek ve zararı durdurma 1R, Takeprofit ise 2R olmalıdır. Sabit riskiniz için uygun lot büyüklüğüne sahip pozisyonlar girmek için Pozisyon Boyutu Hesaplayıcı (Örneğin, PSC Trader.ex4) gibi ek bir ücretsiz Metatrader4 eklentisi kullanın.
- Scalper Terminali gün içinde 5-20 arası scalping ticaret sinyali üretebilir. (Yazılımın sol üst kısmındaki periyot değerine bağlıdır. 18 değerini kullanmanızı öneririm)
- Keskin nişancı gibi bir avcı ol! Sabırlı ol! Turkuaz ışık sinyalini bekleyin ve ardından pinbar/yutan mumun kapanmasını bekleyin.
- Tüm pozisyonlarınız için bir excel elektronik tablosu tutun. 1R:2R risk-ödül kuralını izlerseniz başarı kaçınılmazdır.
- Aynı anda endeks grubundan sadece 1 çift ve Forex grubundan 1 çift seçin. Aynı gruptan birden fazla paritede işlem açmamalısınız.
- Gelen turkuaz ışık sinyali ile bir parite üzerinde işlem açtığınızda, bir sonraki işleme girmek için 1-2 saat ara verin. Çünkü art arda yapılan iki işlem arasında süre olması daha ideal olacaktır.