PTS Divergence Buy Finder
- Indicateurs
- PrecisionTradingSystems
- Version: 2.1
- Activations: 10
PTS - Divergence Buy Finder par Precision Trading Systems
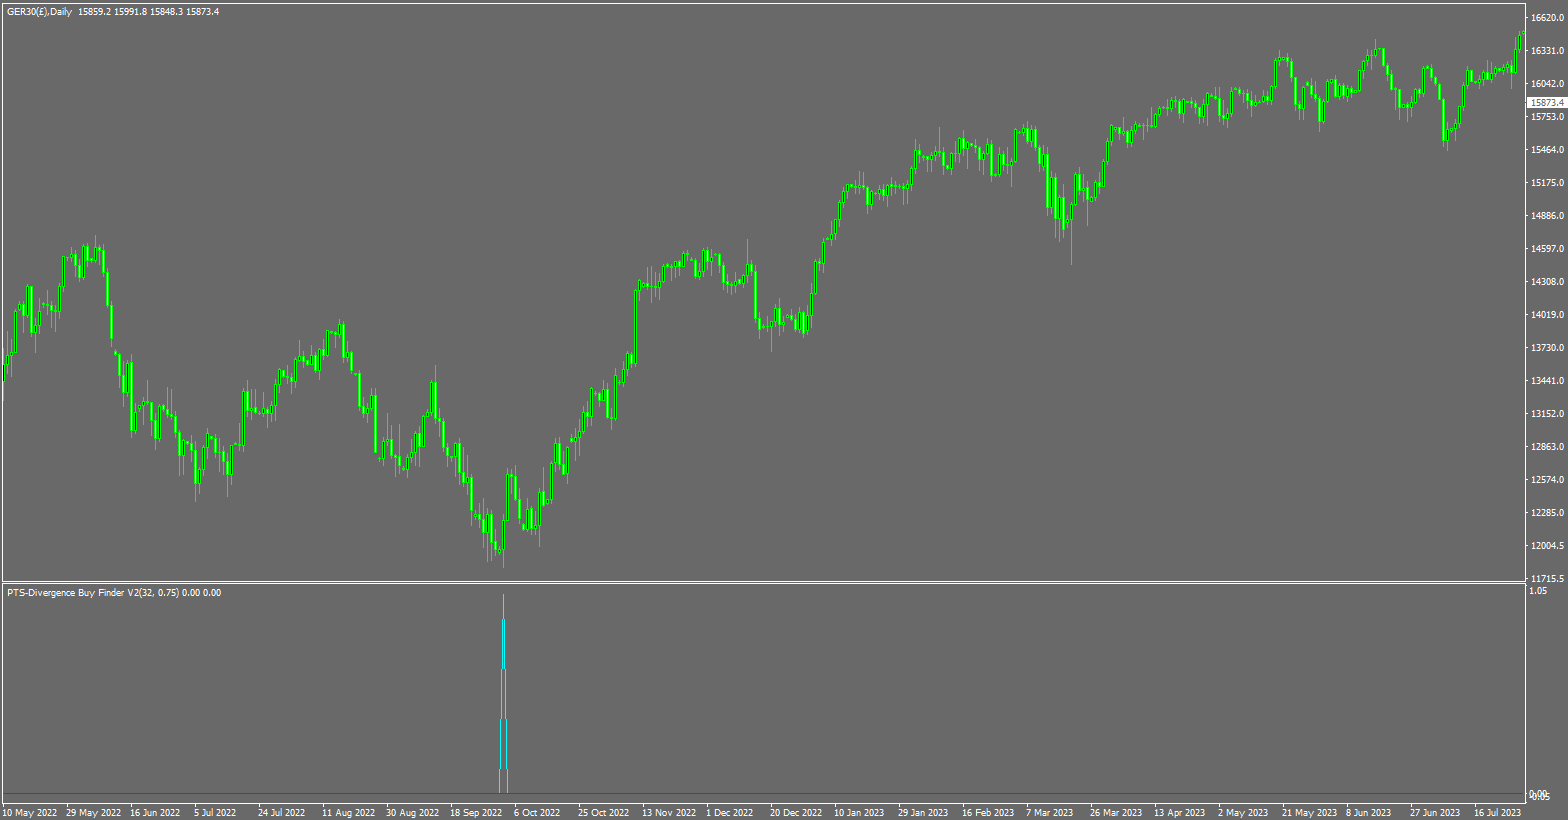
Le Precision Divergence Finder a été conçu pour trouver les points bas du marché avec une précision extrême, et il le fait fréquemment.
En analyse technique, l'art de choisir les creux est généralement beaucoup plus facile que de choisir les sommets, et cet outil est précisément conçu pour cette tâche. Après avoir identifié une divergence haussière, il est sage d'attendre que la tendance s'inverse avant d'acheter. Vous pouvez utiliser un sommet de 10 ou 20 bars pour entrer en position ou une moyenne mobile de 15 à 30 en hausse pour identifier un changement de tendance.
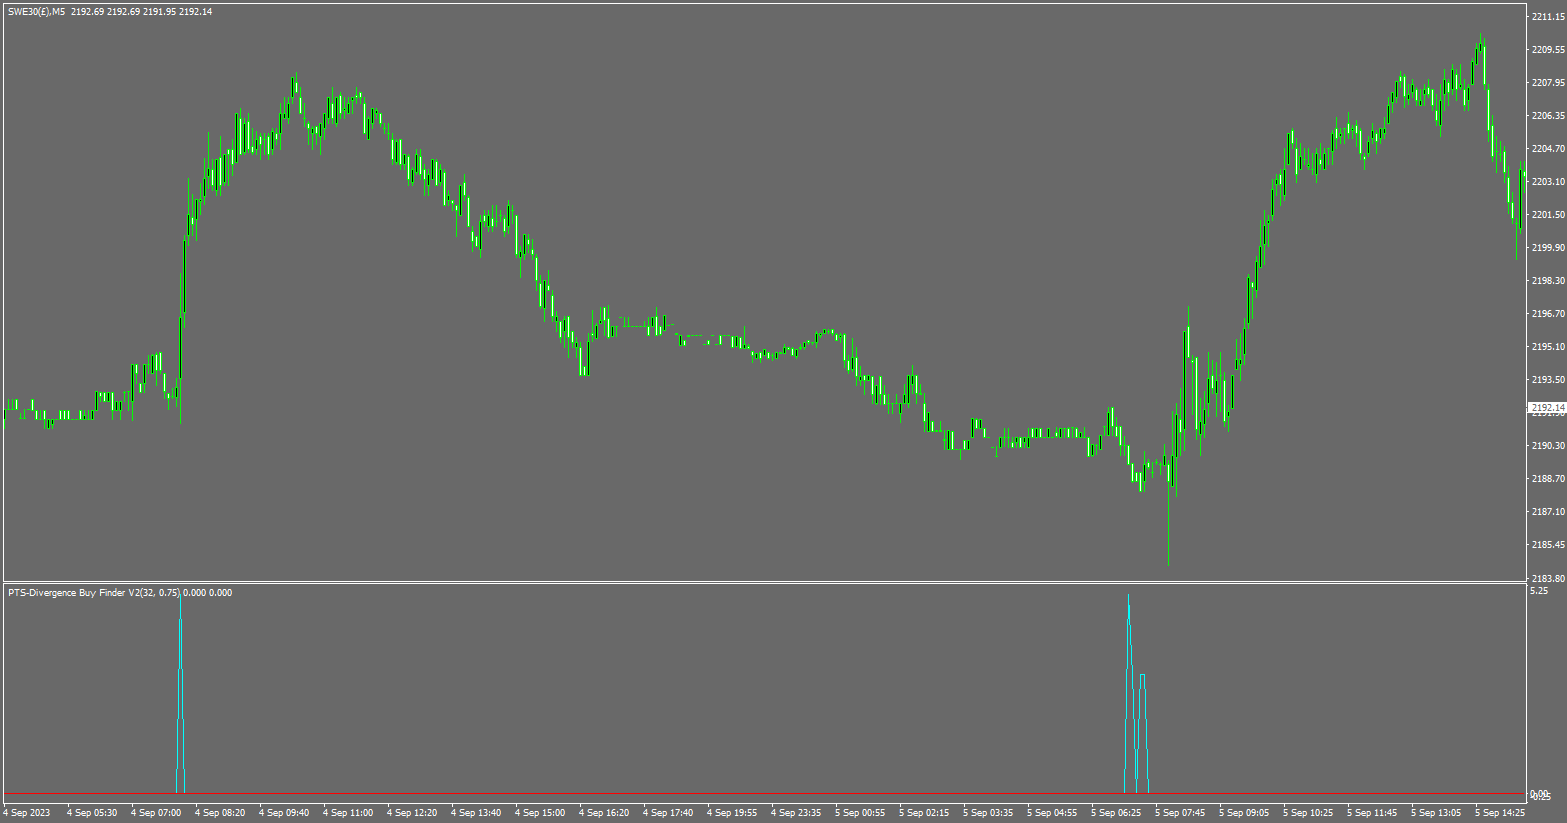
L'algorithme complexe recherche et compte le nombre de divergences actives de l'indice de demande présentes en temps réel, bar par bar.
Le modèle observe lorsque le prix du marché atteint un nouveau plus bas et que l'indice de demande ne fait PAS de nouveau plus bas, créant ainsi une divergence.
L'indicateur utilise deux paramètres.
1. La longueur de l'indice de demande (DI) qui fournira à l'indicateur quelque chose à rechercher, et il trouvera toutes les divergences de DI sur la longueur que vous avez choisie.
2. La différence, c'est la quantité de divergence entre [la valeur DI actuelle] et [les valeurs DI jusqu'à 200] bars auparavant, et pour chaque divergence trouvée à partir de différentes périodes de rétrogradation, il produira une sortie [1] dans la fenêtre de l'indicateur.
Un total de 20 périodes sont inspectées jusqu'à un maximum de 200 bars, donc la valeur de sortie maximale qu'elle affichera est de 20.
Paramètres suggérés :
Les longueurs de l'indice de demande de 15 à 100 fonctionneront, mais les meilleures sont comprises entre 20 et 60.
Les différences de divergence vont de 0,1 à 20 (avec 0,75 à 5 étant généralement optimaux, cependant, la meilleure valeur peut être beaucoup plus grande en fonction de votre volume de données).
Si vous utilisez le volume de ticks, ces paramètres sont suggérés. Cependant, si vous avez un volume de transactions, utilisez des valeurs de différence beaucoup plus grandes, multipliées par 10.
Longueur DI 20 = différence de 0,95 - 5
Longueur DI 30 = différence de 0,85 - 4
Longueur DI 40 = différence de 0,75 - 4
Longueur DI 50 = différence de 0,25 - 3,5
Longueur DI 60 = différence de 0,2 - 3
Longueur DI 70 = différence de 0,15 - 2,5
Longueur DI 80 = différence de 0,1 - 2
Longueur DI 90 = différence de 0,1 - 1,8
Longueur DI 100 = différence de 0,1 – 1,7
La plupart des utilisateurs de MT4 auront accès au volume de ticks, il s'agit donc d'un bon point de départ pour les valeurs suggérées.
Veuillez noter que je n'utilise pas les notifications push. Si vous souhaitez me contacter, veuillez m'envoyer un e-mail via mon site Web au lieu de le faire sur MT4, car je ne verrai pas votre message pendant quelques semaines.