PTS Divergence Buy Finder
- Indicatori
- PrecisionTradingSystems
- Versione: 2.1
- Attivazioni: 10
PTS - Divergence Buy Finder di Precision Trading Systems
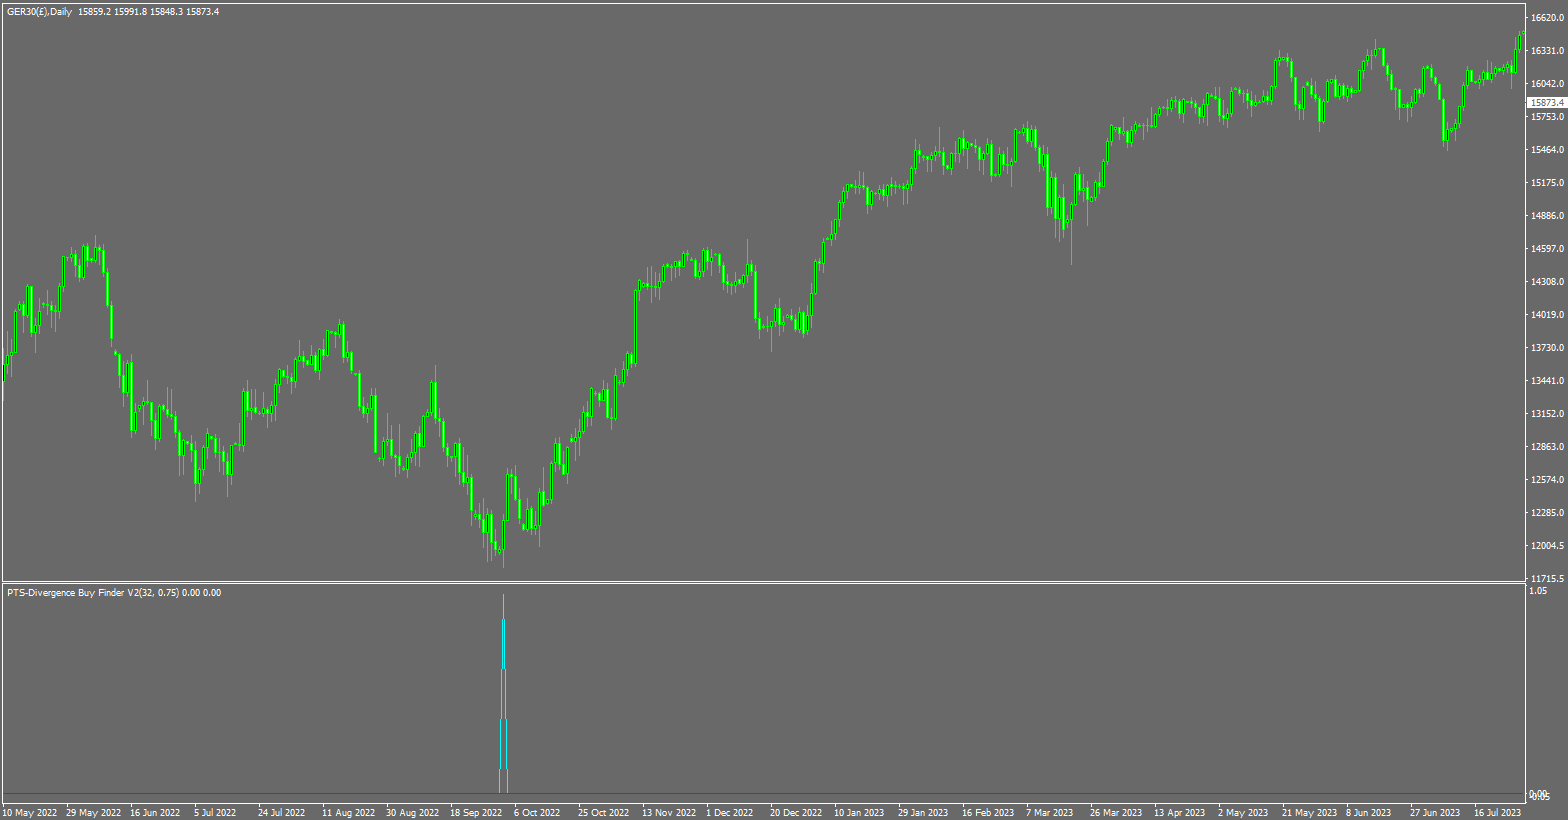
Il Precision Divergence Finder è stato progettato per individuare i minimi di mercato con estrema precisione e lo fa frequentemente.
Nell'analisi tecnica, l'arte di individuare i minimi di mercato è generalmente molto più semplice rispetto a individuare i massimi, e questo strumento è progettato appositamente per questa finalità. Dopo aver identificato una divergenza rialzista, è saggio attendere che la tendenza si inverta prima di acquistare. È possibile utilizzare un massimo di 10 o 20 bar per entrare in posizione o una media mobile di 15-30 in crescita per individuare un cambio di tendenza.
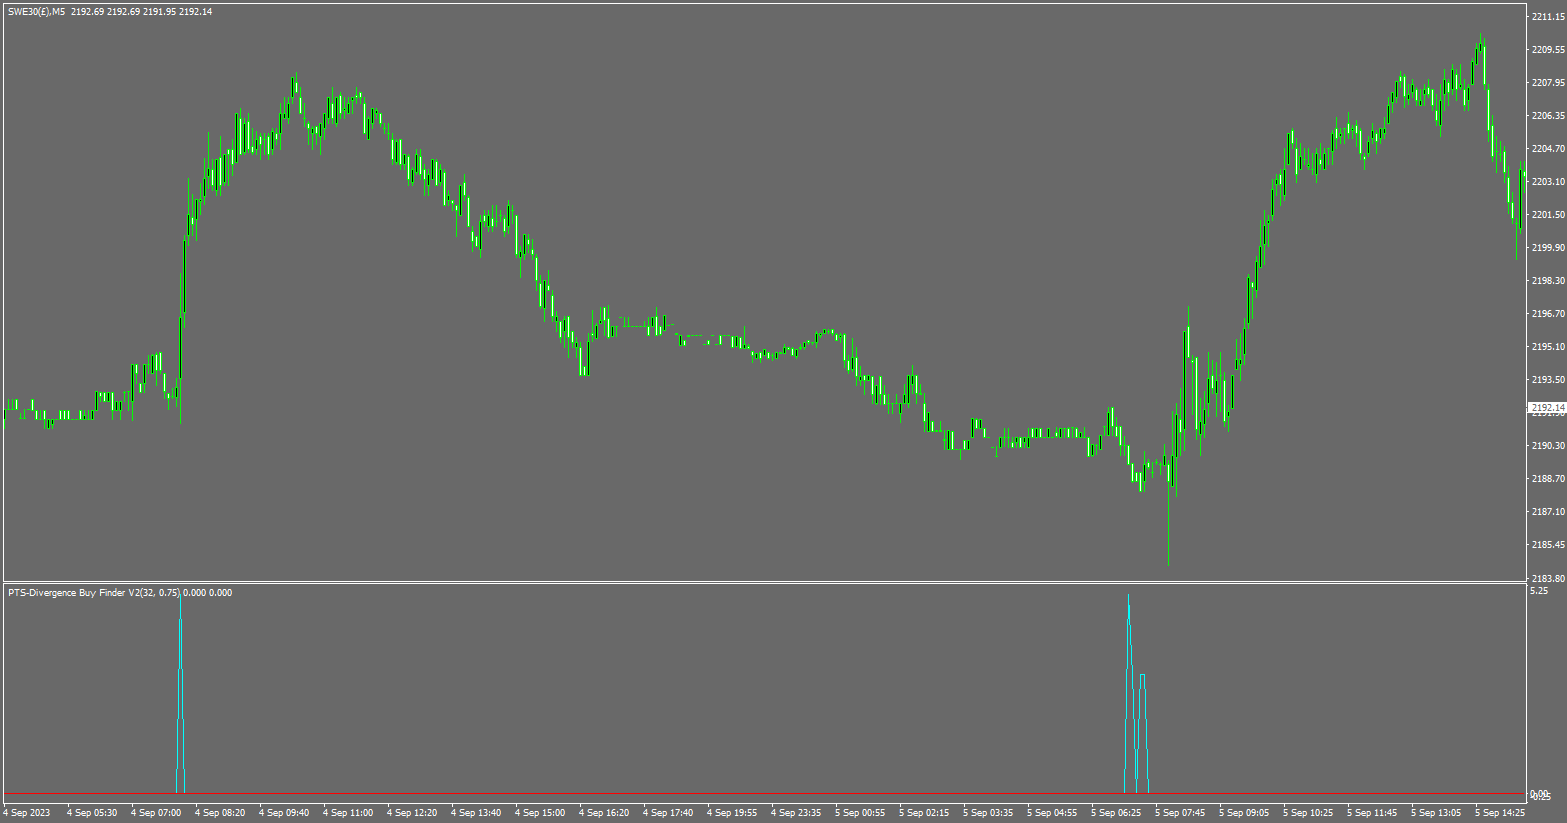
L'algoritmo complesso cerca e conta il numero di divergenze attive dell'Indice di Domanda presenti su base barra per barra in tempo reale.
Il modello osserva quando il prezzo di mercato sta raggiungendo un nuovo minimo e l'Indice di Domanda NON sta raggiungendo un nuovo minimo, causando una divergenza.
L'indicatore utilizza due impostazioni.
1. Lunghezza dell'Indice di Domanda (DI) che fornirà all'indicatore qualcosa su cui concentrarsi e troverà tutte le divergenze del DI sulla lunghezza che hai scelto.
2. Differenza, che è l'ammontare della divergenza tra [il valore DI attuale] e [i valori DI fino a 200] barre fa, e per ogni divergenza individuata da vari periodi di retroguardia, produrrà un output [1] nella finestra dell'indicatore.
Un totale di 20 periodi vengono esaminati fino a un massimo di 200 barre, quindi il valore di output massimo che verrà mostrato è 20.
Impostazioni consigliate
Le lunghezze dell'Indice di Domanda da 15 a 100 funzioneranno, ma le migliori sono comprese tra 20 e 60.
La differenza delle divergenze va da 0,1 a 20 (con solitamente 0,75 a 5 come valore ottimale, ma il miglior valore potrebbe essere molto più grande a seconda del volume dei dati).
Se si utilizza il volume dei tick, queste impostazioni sono suggerite. Tuttavia, se si dispone di un volume di scambi, è consigliabile utilizzare valori di differenza molto più elevati, moltiplicati per 10.
Lunghezza DI 20 = differenza di 0,95 - 5
Lunghezza DI 30 = differenza di 0,85 - 4
Lunghezza DI 40 = differenza di 0,75 - 4
Lunghezza DI 50 = differenza di 0,25 - 3,5
Lunghezza DI 60 = differenza di 0,2 - 3
Lunghezza DI 70 = differenza di 0,15 - 2,5
Lunghezza DI 80 = differenza di 0,1 - 2
Lunghezza DI 90 = differenza di 0,1 - 1,8
Lunghezza DI 100 = differenza di 0,1 – 1,7
La maggior parte degli utenti di MT4 avrà accesso al volume dei tick, quindi la tabella dei valori suggeriti è un buon punto di partenza.
Si prega di notare che non utilizzo le notifiche push, quindi se desiderate contattarmi, vi prego di inviarmi un'e-mail tramite il mio sito invece di farlo su MT4, poiché non vedrò il vostro messaggio per alcune settimane.