Regardez les tutoriels vidéo de Market sur YouTube
Comment acheter un robot de trading ou un indicateur
Exécutez votre EA sur
hébergement virtuel
hébergement virtuel
Test un indicateur/robot de trading avant d'acheter
Vous voulez gagner de l'argent sur Market ?
Comment présenter un produit pour qu'il se vende bien
Expert Advisors et indicateurs payants pour MetaTrader 5 - 34

Un modèle de graphique en triangle symétrique représente une période de contraction et de consolidation avant que le prix ne soit forcé de casser à la hausse ou de s'effondrer. Une cassure de la ligne de tendance inférieure marque le début d'une nouvelle tendance baissière, tandis qu'une cassure de la ligne de tendance supérieure indique le début d'une nouvelle tendance haussière.
Version MT4 disponible ici : https://www.mql5.com/en/market/product/68709/
Cet indicateur identifie ces modèles e

Loss Recovery 3 is an Expert Advisor for recovering losses of positions that were opened in the wrong direction (that were opened by another EA or manually). This EA recovers your loss and closes your position on Break Even or with determined profit.
Trading Strategy:
Loss Recover3 EA try to Recover Wrong Positions, by using Averaging method. There are various features on the EA to control risk of the strategy.
Using EA :
The EA is very simple and without complicated input parameters. Th

The most crucial price level in any "Volume Profile" is the "Point of Control" . Is the price level with the highest traded volume. And mainly, is the level where the big guys start there their positions, so it's an accumulation/distribution level for smart money.
The idea of the indicator arose after the "MR Volume Profile Rectangles" indicator was made. When creating the "MR Volume Profile Rectangles" indicator, we spent a lot of time comparing the volumes with those from the volume profile
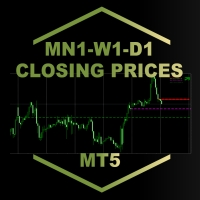
MN1-W1-D1 Close Price Indicator to Index Trading for MT5
The indicator draws lines to the close prices of the last closed bars of monthly, weekly and daily timeframes. Observably, these prices are significant support and resistance prices at major indices, like Nasdaq, DAX. The info panel always shows the prices relative to each other in the correct order. If the current price is the highest - i.e. higher than the last monthly, weekly and daily closing price - it is in the first row. The lowest
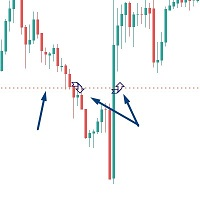
Introductory Offer! *** Only $47 - normal price $97 !! *** Ends soon - don't miis it!! The Close Above or Below Price Indicator is part of my suite of Price and Trendline Alerts Indicators. I'm excited to introduce the Close Above or Below Price Indicator – part of my new suite of Price and Trendline Alert Indicators – fantastic tools designed to alert you when candles close above or below significant prices in the markets you trade. With this indicator, you can set up to 4 price alerts on a

Account Informer Utility Helps you :
Stay in Touch With Your Account. Hear About Your Account Critical Conditions. Check Your Account Connectivity. Inform from any Position Change. When All Orders Closed
Receive Notifications as Android or IOS Notifications on Your Phone, Email or Popup Window.
Information can send in these conditions according to your selection :
Constant Time Period When Drawdown Larger than Specified Value When Margin Level Smaller t

Definition : TPO is a Time Price Opportunity. Instead of using bars or candles with an Open, High, Low, and Close price, each "bar" in a Market Profile is represented by horizontal bars against the price It is called Market Profile terminology.
In other words time-price-opportunity (TPO) profiles are histograms of how much time was spent at each price within the span of the profile.
By using a TPO chart, you are able to analyze the amount of trading activity, based on time, for each price level
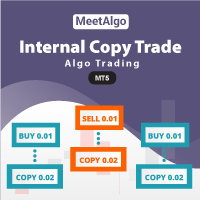
MeetAlgo internal copy trade EA MT5 is capable of copying your trade in the same account the same terminal. It is very useful if you have hired the website mql5.com signal to earn investment profits, the lot size on the MT4 software received from the primary signal will be limited to reduce the risk. It is because the lot size is very significant; the investment profits will, in turn, be tiny. The tool is used to increase the size of the order. This tool is set to duplicate the order from the in

ATTENTION: the utility cannot work in the Strategy Tester, if you want to try the demo version for free for a week, or have any questions, write me an email! You can find my address on my user profile.
TrendLine Auto Executor is a software capable of identifying the trendlines you have drawn on the chart and opening orders as soon as they are touched or exceeded. The software allows you to manage two orders at a time for each chart by tracking two groups of trendlines, one for each order, and e

BTC AutoTrader - Il tuo compagno definitivo per il trading di Bitcoin! SEGNALE | SETFILE Transform Your Trading Journey Welcome to BTC AutoTrader, a cutting-edge Expert Advisor that is revolutionizing automated Bitcoin trading! Whether you are an experienced trader or just starting out with a modest account, our EA puts professional-level trading capabilities at your fingertips. Why Traders Love BTC AutoTrader Intelligent Automated Trading: Watch in amazement as the EA ident

Ilanis is an Expert Advisor for stock trading, it can be used for trading on Forex and other markets, including commodities, metals and index markets. To determine the market entry, the EA uses the modern and ultra-light adaptive indicator FourAverage. Principle of position maintaining is similar to that of the popular Forex robot Ilan, using averaging. But unlike Ilan, Ilanis uses an accurate entry into the market. The robot pays a lot of attention to position control, if the price goes in the

This Expert Advisor trades news on any timeframe. The news are downloaded from the Forex Factory website. Make sure to add the URL to the terminal settings. The EA is launched on a single chart and defines all necessary pairs for trading on its own. The robot works with pending orders setting two Buy stop and Sell stop orders before a news release. It determines the time zones of the calendar and terminal automatically. Make sure to add the time.is URL to the terminal settings. The EA can be tes

Fractal Bot Gold is a trading bot that utilizes breakout and rebound strategies from fractal levels to determine effective entry points for positions, as well as to set safe stop-losses and take-profits. Combined with the Average True Range (ATR) indicator and precise adaptation to market conditions, it minimizes the impact of market noise and volatility, providing reliable risk management and optimizing profits. The bot’s parameters are carefully optimized and adapted for trading the Gold (XAU

Sapphire Strat Maker is an EA builder (Expert Advisor Builder or Strategy Maker) designed to make the creation of trading strategies easier . The goal is to provide the most intuitive, functional and fast environment to test and execute new strategies. Check out the free version here - Sapphire Strat Maker Alt . Also, check out the Emerald EA Builder : an easier to use EA builder, with a few more functionalities (trailing stop, limit orders, etc.). With this Expert Advisor you can create thousa

Superior Boom and Crash Spike Alert: Real-Time Market Intelligence at Your Fingertips
Unlock the power of timely trading decisions with our Superior Spike Alert, a cutting-edge trading tool designed to notify you of potential market spikes. This innovative system sends instant alerts to your phone, audible notifications on your laptop, and displays clear arrows on charts for each currency pair, ensuring you stay ahead of the market.
Key Features:
1. Mobile Notifications: Receive instant ale
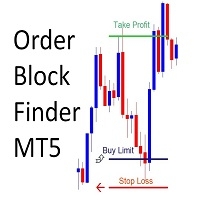
Order Block Finder
Sends Alerts – On MT5 To Your Phone To Your Email
Does not repaint .
Works on any Forex pair, any timeframe.
10 Activations allowed so you are free from limitations >> MT4 Version Here Spreads from 0.1pip RAW/ECN Accounts, click here . Check out my Waka Esque EA signal here: >> High Risk Settings or Medium Risk Settings .
What Is An Order Block? An Order Block (or Banker Candle, or Institutional Candle) is an opportunity to get very high risk to reward trades (o

All-in-one trading powerhouse: trend, reversal, and exhaustion detection
This indicator is a personal implementation of the famous Traders Dynamic Index, which uses RSI, moving averages and volatility bands to find trends, reversals and price exhaustions. However, this particular implementation supports not only RSI, but many others. It is suitable for scalping, day trading, and swing trading and aims to provide a full picture of the current market conditions. [ Installation Guide | Update Guid
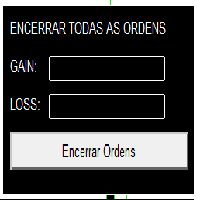
GESTOR FINANCEIRO BRUCUTU [PT-BR] Expert Advisor para gestão financeira de operações no MetaTrader 5, desenvolvido pela VNETD. PRINCIPAIS CARACTERÍSTICAS: Controle automático de Gain e Loss financeiro Interface gráfica intuitiva e profissional Encerramento rápido de todas as posições com um clique Persistência dos valores entre diferentes timeframes Monitoramento contínuo das posições abertas Design minimalista e eficiente FUNCIONALIDADES: Gain Stop: Define um valor de lucro para encerramento au

More informations at Telegram group: t.me/DARKRAYFXEAEN Darkray FX EA uses a return-to-average strategy coupled with buying and selling exhaust zone detection. ️ Expert Advisor for Forex ️ Any Symbol, CDFs, etc. ️ Developed for Metatrader 5 ️ Swing/Position trading ️ Accuracy higher than 95% ️ Low Drawndown Indicators available for setups settings: EMA200 • moving average of 200 periods (other periods can be used with excellent results as well); RSI • Checks the levels on sale for th

The liquidity swings indicator highlights swing areas with existent trading activity. The number of times price revisited a swing area is highlighted by a zone delimiting the swing areas. Additionally, the accumulated volume within swing areas is highlighted by labels on the chart. An option to filter out swing areas with volume/counts not reaching a user-set threshold is also included.
This indicator by its very nature is not real-time and is meant for descriptive analysis alongside other com

Vue d'ensemble SwingVolumePro est un indicateur avancé et polyvalent, conçu pour être utilisé sur une large gamme d'actifs financiers et pour supporter différents styles de trading. Basé sur une analyse rigoureuse du volume et du prix, il fournit des signaux clairs et précis permettant aux traders de tous niveaux de prendre des décisions éclairées basées sur des données de haute qualité.
SwingVolumePro.PDF
Principales caractéristiques Polyvalence: SwingVolumePro peut être appliqué à d
The Limited gold token is a powerful automated trading solution designed to capitalize on market range movements. Specifically crafted for traders who leverage high-low range strategies, this bot identifies optimal trading opportunities within defined price boundaries and executes precise trades for maximum profitability. Because this strategy is so unique, I only want to sell a limited number of licenses. Therefore, the price will steadily increase to limit sales.

Flow Bookmap : Visualisez le Flux du Marché et Protégez vos Trades ️ VOUS VOULEZ DOMINER LE MARCHÉ AVEC DES INFORMATIONS PRÉCISES SUR LES ACHETEURS ET LES VENDEURS ? Flow Bookmap est l'outil ultime pour les traders qui souhaitent comprendre en profondeur le comportement du marché. Il transforme les données du flux d'ordres en une interface intuitive sur le graphique MT5, mettant en évidence les zones d'intérêt critiques pour prendre des décisions rapides et sécurisées. Comment ça fonct

The EA uses a reverse strategy. To detect trading signals, the following indicators are used: Moving Average, Relative Vigor Index, Average True Range, Alligator and other custom indicators . Each pair has a stop loss, take profit, breakeven and trailing stop. The EA trades on many major currency pairs and timeframes. The EA uses timeframes: MetaTrader 4 MetaTrader 5 M1, M5, M15, M30, H1 M1, M2, M3, M4, M5, M10, M12 , M15, M20, M30, H1 , H2 Real monitoring 1 : https://www

Easy Copier Limited is utility tool to copy trade / trade copier form one account (master) to other account (slave) . It works only with a single forex ( EURUSD ) . You can use this tool as local copier ( Terminals have to be in same PC / VPS ) as well as Remote Copier ( Terminals can be in different PC / VPS ). For remote copy you can use my server or it can be configured to your server . Trades are possible to copy from MT4 => MT4 MT4 => MT5 MT5 => MT5 MT5 => M

DTFX Algo Zones are auto-generated Fibonacci Retracements based on market structure shifts.
These retracement levels are intended to be used as support and resistance levels to look for price to bounce off of to confirm direction.
USAGE Figure 1 Due to the retracement levels only being generated from identified market structure shifts, the retracements are confined to only draw from areas considered more important due to the technical Break of Structure (BOS) or Change of Character (CHo
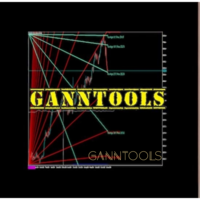
GannTools Indicator
The GannTools Indicator is a powerful trading tool inspired by W.D. Gann's strategies. This indicator provides traders with dynamic support and resistance levels, trend analysis, and key price patterns using Gann angles and cycles. Key Features: Customizable Gann Fans, Angles, and Cycles for precise market analysis. Automatic identification of key price levels and trend directions. Works on all timeframes and instruments for flexible trading strategies. Integrated visualiza

What is this indicator? This indicator draws a customized vertical, horizontal, or trend line at any position on the chart. To draw each line, press the hotkey and then click at any point on the chart. Each drawn line is synchronized with other charts by timeframe. (Each chart requires this indicator to be installed)
How to draw a vertical or horizontal line 1. Press the hotkey to enter drawing mode. 2. Move the mouse to any point. 3. Click to draw the line.
How to draw a trendline 1. Press t
Time Range Breakout EA AFX – Precision Trading with Proven ORB Strategy! Capture Market Trends with High-Precision Breakouts!
The Time Range Breakout EA AFX is an advanced, no-martingale, no-grid Expert Advisor designed for day traders . Built on the Opening Range Breakout (ORB) strategy , it identifies and capitalizes on market movements during key time windows, ensuring safe and consistent profits . Why Choose Time Range Breakout EA AFX? Proven Strategy: Based on the time-tested ORB

When the market breaks the glass ceiling someone has to use the broom and pick up the glass from the floor.
Broom is the system that detects this break and collects the crystals.
Being a very aggressive scalping system, it should only be used in pairs with a low spread and low commissions.
This system is suitable for small accounts and can be used with only $ 100.
You can download the demo and test it yourself.
Very stable growth curve as result of smart averaging techniques.
"Safety f
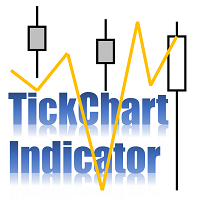
TickChart Indicator plots tick line on the main window of MetaTrader. ( Free version of this is "TickChart Indicator Lite" )
The tick-line shows the most detailed, fastest and real-time activities of the market, which are usually hidden in bars or candles longer than 1 minute. Usually, several new tick-line segments appear while a bar of M1 time frame is completed. After the release of an important economic indicator, the number of ticks per bar may exceeds 100. This indicator overlays the tick

Order Book, known also as Market Book, market depth, Level 2, - is a dynamically updated table with current volumes of orders to buy and to sell specific financial instument at price levels near Bid and Ask. MetaTrader 5 provides the means for receiving market book from your broker, but in real time only, without access to its history. The indicator OrderBook Cumulative Indicator accumulates market book data online and visualizes them on the chart. In addition, the indicator can show the market
This EA is easy to use, it does not have too complicated settings and algorithms for performing trading operations. It’s not optimized for long, it may appeal to those who recently decided to engage in trading on the exchange with the help of advisers, or who do not want to understand the settings for a long time. The basis of his work is several indicators (moving average, RSI, stochastic, ATR). Despite its simplicity, it has a custom trailing stop function, which can reduce the risks for a dep
Exclusive Stairs is a trend indicator for the MetaTrader 5 platform. Its operation algorithm is based on moving averages, processed by special filters and price smoothing methods. This allows the Exclusive Stairs to generate signals much earlier than the conventional Moving Average. This indicator is suitable both for scalpers when used on the smaller timeframes and for traders willing to wait for a couple of days to get a good trade. Exclusive Stairs for the MetaTrader 4 terminal : https://ww

Binance Full Trader is developed for connection to your Binance account and get data, draw price charts and trade easily with any strategy by an indicator. A user-friendly interface has developed for it and has tried to give access to the necessary information such as open orders and wallet balances. · There are two sample indicators (one for trade signal and another for price) that you can download it from these links: https://drive.google.com/file/d/1w2CGuu3rArWKMhS9LkepT9zhVkGR1AO7/vie
INTRODUCTION
Deriv AlgoTraders EA (bot) est conçu et développé par des professionnels du marché chevronnés avec des années d'expérience dans le but de préserver le capital commercial tout en réalisant des bénéfices constants. Il fonctionne sur la plate-forme MT5 fournie par Deriv Limited, une société de courtage offrant une large gamme d'actifs dérivés de marchés réels ou simulés. Certains des avantages de ce type de marché sont sa disponibilité 24 heures sur 24 et 7 jours sur 7 et l'influence

The ICT Propulsion Block indicator is meant to detect and highlight propulsion blocks, which are specific price structures introduced by the Inner Circle Trader (ICT). Note: Multiple Timeframe version avaiable at here
Propulsion Blocks are essentially blocks located where prices interact with preceding order blocks. Traders often utilize them when analyzing price movements to identify potential turning points and market behavior or areas of interest in the market.
USAGE (fingure 1)

Overview
The Volume SuperTrend AI is an advanced technical indicator used to predict trends in price movements by utilizing a combination of traditional SuperTrend calculation and AI techniques, particularly the k-nearest neighbors (KNN) algorithm.
The Volume SuperTrend AI is designed to provide traders with insights into potential market trends, using both volume-weighted moving averages (VWMA) and the k-nearest neighbors (KNN) algorithm. By combining these approaches, the indicator

!! IMPORTANT!, PLEASE REMEMBER TO RUN THIS EA ON THE 1 MINUTE TIME-FRAME AND BOOM1000 ASSET ONLY !! This wonderful piece of software is a super intelligent self learning algorithm made for mt5, checkout the examples at the bottom of the page Engage has had the pleasure of working with a very talented honest and good willed individual called Nardus van Staden to create this wonderful product, if you want something as awesome as this check him out at This Link .
The EA "Engage Synthetic Scalper
100 % PER MONTH PROFIT---- MY NEW SIGNAL HERE -------> https://www.mql5.com/en/signals/2162238?source=Site+Signals+My#
ENGULFING PATTER EA IS AN EXPERT ADVISOR THAT OPENS POSITION BASED ON THE " ENGULFING CANDLESTICK PATTERN " FREE INDICATOR HERE ------>>>> https://www.mql5.com/en/market/product/62135?source=Site+Profile+Seller PLEASE KINDLY NOTE THAT THIS EA IS NOT OPTIMIZED AND WITH STANDARD SET IS NOT PROFITABLE.SO PLEASE OPTIMIZE THIS ROBOT BEFORE GOING LIVE . THE ROBOT OPENS POSITION
The Gold Nugget PF is a powerful automated trading solution designed to capitalize on market range movements. Specifically crafted for traders who leverage high-low range strategies, this bot identifies optimal trading opportunities within defined price boundaries and executes precise trades for maximum profitability. Because this strategy is so unique, I only want to sell a limited number of licenses. Therefore, the price will steadily increase to limit sales. Next price is 190 USD. Broker - A
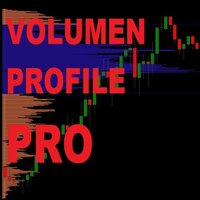
Möchten Sie Ihren Gewinn maximieren, um Ihre Ziele schneller zu erreichen? Bitte beachten Sie, dass dies vor unserem Volumenprofil der Fall ist. Aufgrund der grafischen Darstellung der Aufteilung des Volumens können Sie die Aufteilung und die Entwicklung des Gesamtvolumens problemlos sehen. Diese Leitung ist ohne Zweifel die beste Möglichkeit, Ihre Leistungen zu verbessern und zu verbessern. Dank unseres leistungsstarken Volumenprofils, das nicht auf die Leistungsfähigkeit und Wirksamkeit von M
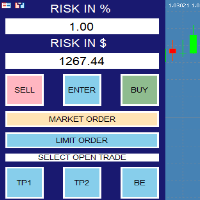
RISK CALCULATOR - TRADING PANEL - CHART OVERLAY with:
PARTIAL TAKE PROFIT ("virtual TP") % RISK LOT SIZE TRAILING STOP LOSS Fast and simple control of your trades Easy lot size calculation with easy SL/TP setting. Your trading will be much more comfortable with this tool!
Works like any EA, add it to selected chart and trade !
(this version is converted from MT4)
Features: start trade with calculated lot based on % of account balance * that you want to risk/ or based on

This product contains following indicators: (Lines + LineSAR + Channels + BTL + Ladder) Phi Lines - special EMAs, similar to MIMAs from Phicube; Phi LineSAR - erase and highlight Phi Lines in support or resistance. Similart to MIMASAR from Phicube; Phi Channels - show support and resistance, similar to Phibo from Phicube (Green and Read Lines); Phi BTL - candles color following Phi Lines alignment; Phi LADDER - Indicator that allow you to visualize possible targets.
FUTURO Tool Future too

Excellent dashboard for analytics. The panel helps to analyze the values of the Parabolic SAR indicator and its signals.
With this panel you can: watch the current signal from Parabolic SAR on all timeframes; watch the current signal from Parabolic SAR for different symbols; watch the current Parabolic SAR value; several types of signals for analytics.
Values in a table cell: value of Parabolic SAR
Signal type: Parabolic SAR crosses Price Parabolic SAR upper/lower Price
Work opti

For any trader, the result of market analysis is the correct determination of entry and exit points from the market. The ClearArrows indicator does not display any unnecessary information that may distract or mislead the trader, but only the most important thing. The indicator is very easy to use, when a down arrow appears, you need to open a SELL deal, when an up arrow appears you need to open a BUY deal.
The ClearArrows indicator, despite its outward simplicity, has a large analytical algori
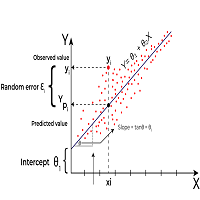
Linear Regression is a statistical method used to model the relationship between two or more variables. The primary goal of Linear Regression is to predict the value of one variable (called the dependent variable or outcome variable) based on the value of one or more other variables (called independent variables or explanatory variables) Linear Regression can be applied to technical analysis, and it is indeed one of the tools used by traders and analysts to make predictions and identify trends i
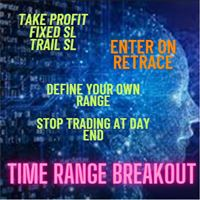
The most flexible TIME RANGE BREAK OUT SYSTEM Live Monitoring: https://www.mql5.com/en/signals/1885158
- SET your own time range to define when to calculate the range (from 00:00 to 23:59) - SET your STOP LOSS and TAKE PROFIT as a % of Range Size - SET your own Lot Size OR Put a % of Risk that you are willing to take on ONE TRADE.. The system will automatically calculate the STOPLOSS using the size of the range and the Capital of the Account.. This way you are sure that max you can lose on a

Introducing the Hyper Frequency Crude Oil Expert Advisor
Are you looking to elevate your trading game with a powerful and reliable tool? Look no further than the ** Hyper Frequency Crude Oil Expert Advisor **. This cutting-edge EA is designed to optimize your trading strategy and maximize your profits in the volatile crude oil market. Here are some of the key benefits of using this Expert Advisor:
1. **High Accuracy and Profitability** The Hyper Frequency Crude Oil EA boasts an impressive
The analyzer allow estimating how the margin level changes when a position price or volume changes. It also displays price level at which StopOut and MarginCall may occur.
Parameters: volume position upgrading - the number of lot position changes. number of levels on the chart - the number of levels plotted on the chart levels color - color for drawing levels

Main: Not martingale, not a grid, working on all symbols; a good rational algorithm; Work of two indicators: Parabolic Sar and Moving Average (you can set a separate Timeframe for each indicator); There is a good money management system (there are several type for trailing stop loss); EA can work on closed candles, and on current candles; Quickly optimized (the work is maximally accelerated). Very well optimized for EURUSD . Current sets after optimization are in comments. Version MT4: https://

KT Forex Volume shows the buying and selling volume of a currency pair in the form of a colored histogram. The volume is made of buying and selling transactions in an asset. In FX market: If the buying volume gets bigger than the selling volume, the price of a currency pair would go up. If the selling volume gets bigger than the buying volume, the price of a currency pair would go down.
Features Avoid the bad trades by confirming them using the tick volume data. It helps you to stay on the side

Gold Miner MT5 strategy is based on the search for areas of concentration of prices of large buyers and sellers. In such zones, short-term trends are usually generated. This is a grid EA, but thanks to the function of overlapping unprofitable orders, it is able to withstand large drawdowns and recover the account. Works well on volatile pairs and gold (XAUUSD, GBPUSD, USDCAD, EURUSD, USDJPY, USDCHF, AUDUSD, NZDUSD ... ). It has many useful functions, such as closing orders on Friday or w

Walking Steps EA is a scalping Expert Advisor designed to work in a volatile market. It is suitable for working with any brokers, including American brokers, requiring FIFO to close primarily previously opened transactions. All orders are accompanied by a virtual stop loss and take profit in pips, and there are also breakeven and trailing stop functions. The chart displays information on the speed of order execution and slippage. Advisor does not use martingale or grid. The EA does not
Moving averages are very often used for analyzing currency pairs and trading. This Expert Advisor can analyze many moving averages at once and trade based on this. When the required number of moving averages signal a purchase, the adviser makes a purchase, if the indicators signal a sale, the advisor sells. Also, there is filtering spurious signals at low volatility based on the ADX indicator. In the settings of the adviser, you can set the required number of sliding ones, their period (the init

Purpose DG Trend+Signs is an indicator that paints candles with trend colors and clearly shows consolidations, using both DoGMA Trend and DoGMA Channel indicators. It was created to help users in their trades, showing trends, consolidations and marking entry and exit points. The indicator also takes consolidations in consideration to identify breakouts.
Key features Designed to be simple to use, with a few parameters Does NOT repaint Does NOT recalculate Signals on entries Works in ALL pairs Wo

Features: fast opening / closing deals automatic closing of trades by profit / loss shows the number of deals and the total profit for the Symbol
Fast open deals: set the Lot volume set StopLoss / TakeProfit in points (if you set "0", then it is not used) set slippage set Magic (if necessary) set comment (if necessary)
Fast open features: fast open Buy fast open Sell fast close ALL open orders for the current Symbol
Auto close deals by profit / loss (analogue of virtual StopLoss / TakeProfi
The Liquidation Estimates (Real-Time) experimental indicator attempts to highlight real-time long and short liquidations on all timeframes. Here with liquidations, we refer to the process of forcibly closing a trader's position in the market.
By analyzing liquidation data, traders can gauge market sentiment, identify potential support and resistance levels, identify potential trend reversals, and make informed decisions about entry and exit points.
USAGE (Img 1) Liquidation refers to

Are you looking for a cool expert where you can manage your orders easily and fast? I have good news because by using Rapid Trade Manager you can: calculate the risk per trade (percentage or fixed amount) manage your open orders individually choose from a variety of features such as: Take Profit, Partial Close, Stop Loss, Trailing Stop, Break Even, Close All and Close Order. Note! Doesn't work in the Strategy Tester If you are interested check out my videos for more. More info about the Rap

Harmonic patterns are characteristic series of price movements with respect to Fibonacci levels, which statistically precede price reversals. This indicator searches for harmonic patterns. It is capable of recognising 26 classical and non-classical harmonic patterns : Classical Gartley Butterfly Alternate Butterfly Bat Alternate Bat Crab Deep Crab Three Drives Non-classical Shark Alternate Shark Cypher 5-0 Anti Gartley Anti Butterfly Anti Alternate Butterfly Anti Bat Anti Alternate Bat Anti Crab

The current Rise and Fall is judged from the Commodity Channel Index (CCI) of the three cycles and displayed in a panel by color coding.
The second and third of the three cycles are changed according to the correction factor multiplied by the first cycle (minimum cycle).
In addition, each CCI is displayed with ATR (Average True Range) corrected for variation.
When two of the three CCI are complete, Trend_1 is displayed.
When all three are complete, Trend_2 is displayed.
// ---
Squeeze is
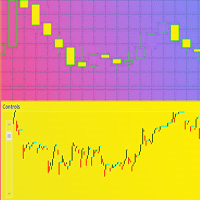
Индикатор для отображения свеч размером меньше одной минуты, вплоть до размера в одну секунду, для детализированного просмотра графика . Имеется ряд необходимых настроек для удобной визуализации. Настройка размера хранения истории ценовых данных транслируемых инструментов. Размер видимых свеч. Настройка отображения неподвижности на курсах графика. Возможность отображения на различных торговых инструментах. Удачной всем торговли.

The indicator allows you to simplify the interpretation of signals produced by the classical MACD indicator.
It is based on the double-smoothed rate of change (ROC).
Bollinger Bands is made from EMA line.
The indicator is a logical continuation of the series of indicators using this classical and efficient technical indicator.
The strength of the trend is determined by Bands and main line.
If the bands width are smaller than the specified value, judge it as suqueeze and do not recommend tra

This incicator shows you when a pin bar is formed, and aid you perform a inversion strategy or a trend continuation based on resistence support and or channel. Typically a pin bar shows you a price rejection from the market and the signal most of time is profitable. So i suggest to use buy/sell limit order over ratrace SL little bit over or below bar and take profit based on your strategy and money management.
Best timeframe are D H4 H1

The Breakout Box for MT5 is a (opening) range breakout Indicator with freely adjustable: - time ranges - end of drawing time - take profit levels by percent of the range size - colors - font sizes It can not only display the range of the current day, but also for any number of days past. It can be used for any instrument. It displays the range size and by request the range levels and the levels of the take profit niveaus too. By request it shows a countdown with time to finish range. The indic
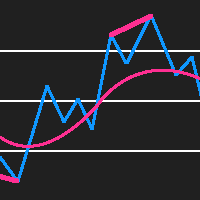
RSI Divergence Detector is an RSI indicator which also detects divergences and plots arrows and trend lines on the chart where you should buy and sell. Please note that this indicator provides 5 buffers and doesn't repaint making it an exceptional indicator for Expert Advisors. The indicator also provides alerts. Buffer 0 = RSI Buffer 1 = Buy Buffer 2 = Sell Buffer 3 = RSIGradient Buffer 4 = PriceGradient
NON REPAINTING
DIVERGENCE DETECTION

The Trend Quality Indicator (by David Sepiashvili) is intended to measure trend activity. Some benchmarks can be used to determine the strength of a trend.
In the range of values from -1 to +1 ( Ignored zone parameter) , the trend is buried beneath noise. It is preferable to stay out of this zone.
The greater the value, the less the risk of trading with a trend, and the more reliable the trading opportunity.
The range from +1 to +2, or from -1 to -2, may be treated as zone of weak trend

The Synchronized Cross indicator allows you to link cross hairs from multiple chart windows. This means that as you move the cross hair in one chart, all other cross hairs will move together by automatically staying on the same time. If, for example you are moving your mouse cursor in a M5 timeframe (see screenshots), the crosshair will show as a line in the higher timeframes, and as an area in the lower timeframes. Thus making it easier to correlate timeframes. The input parameters are self exp
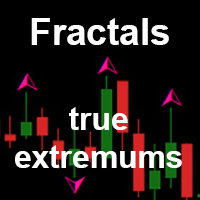
Fractals true extremums is a modification of the Fractals indicator. The indicator sorts out weak fractals leaving only the ones that are significant for searching the chart extreme points. The sorting is performed during fractals construction. The old data does not change. Only the last value can change (just like in the standard Fractals indicator). The indicator can show lines indicating Fractals from higher timeframes.
The product can be used by EAs for comparing price extreme points on char
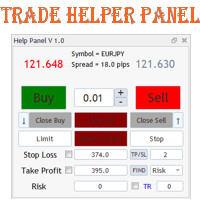
Данная панель предназначена для удобного совершения сделок в платформе Metatrader. Она позволяет с легкостью открывать позиции, устанавливать стоп лосс и тэйк профит, использовать трейлинг стоп и тд..
Входные параметры :
Magic - уникальный номер эксперта Lot step - шаг изменения лота Custom - произвольная сумма для высчитывания риска Risk Value - тип поиска значения риска (в %) Функции панели : Открытие sell и buy позиций
Возможность установки profit / loss для позиции, в том числе и графичес
Le MetaTrader Market est le meilleur endroit pour vendre des robots de trading et des indicateurs techniques.
Il vous suffit de développer une application pour la plateforme MetaTrader avec un design attrayant et une bonne description. Nous vous expliquerons comment publier votre produit sur Market pour le proposer à des millions d'utilisateurs de MetaTrader.
Vous manquez des opportunités de trading :
- Applications de trading gratuites
- Plus de 8 000 signaux à copier
- Actualités économiques pour explorer les marchés financiers
Inscription
Se connecter
Si vous n'avez pas de compte, veuillez vous inscrire
Autorisez l'utilisation de cookies pour vous connecter au site Web MQL5.com.
Veuillez activer les paramètres nécessaires dans votre navigateur, sinon vous ne pourrez pas vous connecter.