Regardez les tutoriels vidéo de Market sur YouTube
Comment acheter un robot de trading ou un indicateur
Exécutez votre EA sur
hébergement virtuel
hébergement virtuel
Test un indicateur/robot de trading avant d'acheter
Vous voulez gagner de l'argent sur Market ?
Comment présenter un produit pour qu'il se vende bien
Expert Advisors et indicateurs payants pour MetaTrader 5 - 29

Bot Pulse Trading – Robot Bandes de Bollinger DAX Profitez de la volatilité du marché grâce à un algorithme de trading basé sur les Bandes de Bollinger conçu pour le DAX ! Ce robot de trading avancé identifie des points d'entrée et de sortie précis, s'adaptant à la dynamique du marché avec une approche structurée et disciplinée. Caractéristiques principales :
Stratégie intelligente Bandes de Bollinger – Identifie les extrêmes de prix pour des transactions à forte probabilité. Une transaction à

Price Range MT5 est un indicateur avec un historique de trading réel. Il dessine automatiquement toutes les plages de prix, calcule les supports et les résistances et définit le prix Stop-Loss pour l'ouverture de positions selon différentes stratégies. Signal en direct d'un compte réel : https://www.mql5.com/fr/signals/2278827 Stratégies de trading de l'indicateur Price Range Trading de plage entre support et résistance ; Trading des cassures de plage de prix ; Trading des rebonds à partir de l
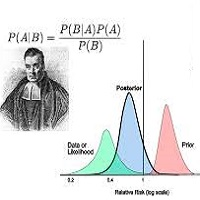
Bayesian methods can be effectively applied to predict price trends in financial markets, including Forex, stocks, and commodities. Here’s how Bayesian techniques can be used for trend prediction: 1. Bayesian Linear Regression Bayesian linear regression can be used to model the relationship between time and price. This method allows for the incorporation of prior beliefs about the trend and updates the trend as new data comes in. Example: Suppose you want to predict the price trend of a currency
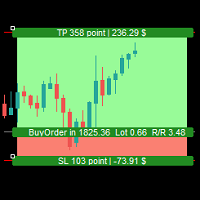
Simple Assistant for Trading
Precise Risk Management in each
Automatic Money Management Visual Trading Open Position Management User friendly and practical
during 15 years of considerable experience in stock market, we have dealt with many professional traders who have been used profitable and unrivalled methods in this market but failed in the long term. The reason is undoubtedly the lack of standard in their manner during their trade. Standard means the accurate repetition of a process….

The indicator automatically builds Support/Resistance levels (Zones) from different timeframes on one chart.
Support-resistance levels are horizontal lines. As a rule, the market does not respond to a specific price level, but to a price range around the level, because demand and supply of market participants are not formed clearly on the line, but are “spread out” at a certain distance from the level.
This indicator determines and draws precisely such a price range within which strong positi

Multicurrency and multitimeframe modification of the Fractals indicator. Displays the last two fractals — their sequence (and which one is broken), or the distance between them. You can specify any desired currencies and timeframes in the parameters. Also, the panel can send notifications on a fractal's breakout. By clicking on a cell with a period, this symbol and period will be opened. This is MTF Scanner. The key to hide the dashboard from the chart is "D" by default.
Parameters Calculation

This indicator displays the wave structure of the market in the form several wave levels nested in each other. For each of these levels an automatic preliminary (draft) marking of waves in Elliott's style (123..., ABC... etc.) is created. This markup is completely automatic and absolutely univocal. The indicator is especially useful for beginner wave analysts, because among all the possible versions for wave marking, it allows you to immediately take the most adequate version as a ba

Welcome to the Make It Rain Expert Advisor!!! Automated Multi-Pair Trading with Advanced Strategies Introducing the Make It Rain Expert Advisor!!! My latest expert system utilizing a new strategy and new signals for trading across multiple currency pairs. This is a fully automated expert engineered to have a higher profit-to-loss ratio average per trade while aiming for as many trades as possible . The EA will open up to 8 limit trades off of one signal in a grid pattern sharing the Take Prof

The liquidity swings indicator highlights swing areas with existent trading activity. The number of times price revisited a swing area is highlighted by a zone delimiting the swing areas. Additionally, the accumulated volume within swing areas is highlighted by labels on the chart. An option to filter out swing areas with volume/counts not reaching a user-set threshold is also included.
This indicator by its very nature is not real-time and is meant for descriptive analysis alongside other com

The indicator determines the ATR value (points) in a classic way (taking into calculation paranormal bars/candles) and more correctly - ignoring paranormal movements of the Instrument. Correctly it is excluding paranormal bars from the calculation, extremely small bars (less than 5%( customizable ) of the standard ATR) and extremely large bars (more than 150% ( customizable ) of the standard ATR) are ignored. This is a Extended version - allows you to set calculation parameters a

Introduction to DCA CYCLEMAX
Live Signal MT4 3000 USD start , BUY / SELL Both set : Click Here
Live Signal MT4 1000 USD start , Almost BUY set : Click Here
Overview DCA CYCLEMAX is a powerful semi-automatic grid trading program (EA) optimized for assets that exhibit strong directional trends in the market. It is especially effective for assets with high volatility and a steady directional trend, such as Gold (GOLD), Nasdaq 100 (NS100), and cryptocurrencies. Using the DCA (Dollar-Cost Aver

Introduction Il s'agit d'une EA de retrait conçue pour détecter les divergences de tendance, ce qui correspond au premier type d'arguments d'achat et de vente de la théorie du « Zhan Zhong Shuo Chan ». Avec un facteur de profit exceptionnellement élevé, cette EA offre une rentabilité constante à long terme. Il utilise un trading en grille dynamique, lui permettant de s'adapter de manière transparente aux diverses conditions du marché.
Nouveau prix promotionnel EA : 99 $ → 149 $ Signal en direc
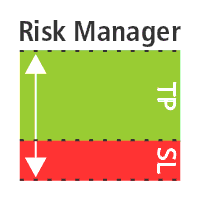
Risk Manager – Assistant de Trade pour MT5 Aperçu Risk Manager – Assistant de Trade est un outil avancé conçu pour améliorer l’exécution des trades, automatiser la gestion des risques et optimiser la performance de trading. Il intègre le calcul dynamique de la taille des lots, une protection par stop-loss caché, l’automatisation des trades et un journal de trading en temps réel pour offrir aux traders un avantage sur le marché. Avec son interface intuitive et ses capacités d’automatisation, Risk
IQ FX Correlation Matrix is a powerful multi-timeframe dashboard that helps traders analyze real-time currency correlations across multiple forex pairs. With customizable settings, sleek design, and one-click symbol switching, it enhances trade accuracy, reduces risk, and identifies profitable correlation-based opportunities. Download the Metatrader 4 Version Message us here after purchase to get the Indicator Manual. Download Now! Offer valid only for next 10 Buyers. Price will increase gradua

I've combined two trading strategies, the Order Block Strategy and the FVG Trading Strategy, by utilizing a combination of the FVG indicators and Order Blocks. The results have been surprisingly effective.
This is a two-in-one solution that makes it easy for traders to identify critical trading zones. I've optimized the settings so that all you need to do is install and trade; it's not overly complex to explain further. No need for any usage instructions regarding the trading method. You shoul

Gold 588 is a gold night scalping high performance EA which takes the positions with the highest probability of winning. Gold 588 takes trend following trades considering the prevailing higher timeframe during the low volatility hours of late night markets. This approach causes a high win-rate which even with the small scalping profit margin of for each trade, leads to a profitable strategy.
Inputs of this EA have been kept minimalistic to provide users with the best optimized performance,

Version MT4 https://www.mql5.com/en/market/product/129411 Version MT5 https://www.mql5.com/en/market/product/129412
Le Dashboard Scanner Kalman est un outil d'analyse multi-symboles et multi-périodes avancé conçu pour simplifier votre processus de trading en exploitant les puissants calculs de niveau de tendance et de support-résistance de Kalman. Cet indicateur combine des algorithmes de suivi de tendance et une analyse précise du support-résistance pour vous aider à identifier rapidement les
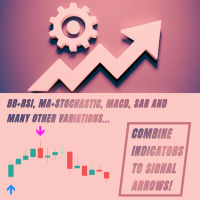
C'est un constructeur. C'est-à-dire le créateur de stratégies. Et pas seulement. Il s'agit d'un indicateur de signal pour la plupart des indicateurs standard intégrés dans MetaTrader 5. Combinez vos indicateurs dans une flèche de signal. Par exemple, vous avez une stratégie et vous devez connaître sa rentabilité, inclure les éléments nécessaires dans le menu et obtenir des statistiques. Et si vous n’avez pas de stratégie, utilisez-la sur Internet ou créez la vôtre. Rigonstruktor vous aidera avec

Élevez votre trading au niveau supérieur avec EMA CrossPro EA, un Expert Advisor sophistiqué mais facile à utiliser, conçu pour maximiser les profits sur les marchés en tendance. Cet EA exploite la puissance des Moyennes Mobiles Exponentielles (EMA) pour détecter et capitaliser sur les fortes tendances du marché avec précision et efficacité. La logique derrière EMA CrossPro EA : Signal d'achat : L'EA initie une opération d'achat lorsque la EMA rapide croise la EMA lente vers le haut, signalant l

Cet indicateur suit efficacement tous les autres chandeliers temporels que vous souhaitez suivre sur le même graphique.
1. Sélectionnez n'importe quel délai supérieur pour charger les barres sur le même graphique
2. Personnalisez les couleurs et le style des chandeliers
3. Choisissez le nombre de barres pour dessiner les chandeliers
4. Suivez les bougies complètes dans un délai plus long, ainsi que la mèche et le corps.
5. Facile et pratique pour ceux qui ne veulent pas changer de graphique

Besoin d'ouvrir plusieurs positions/trades en même temps ? Nous avons créé votre solution simple. Vous pouvez désormais saisir plusieurs postes à la fois. Vous pouvez définir la taille du lot, le nombre de positions, le take profit et le stop loss. Par exemple : vous souhaitez acheter 3, 5, 10 ou n’importe quel nombre de positions avec une certaine taille de lot. Vous pouvez maintenant le faire en appuyant simplement sur le bouton « Acheter ». Ou Par exemple : vous souhaitez vendre 3, 5, 10 ou
Il s'agit d'une stratégie de réversion moyenne à taux de réussite élevé qui peut être négociée sur la plupart des marchés, notamment : les paires de devises, les indices boursiers, les actions individuelles, les obligations et plusieurs matières premières. Cet Expert Advisor est construit sur des principes de trading et des règles statistiques robustes et éprouvés, sans BS. Back testez et optimisez l’Expert Advisor sur votre marché cible. Exécutez l’EA sur plusieurs marchés non corrélés pour ob
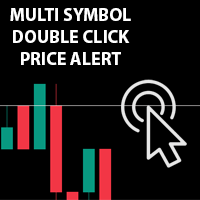
Double-cliquez sur plusieurs symboles n'importe où sur le graphique pour définir une alerte de prix et être averti par Terminal Alert ou Push Notification
1. Ajouter l'utilitaire EA sur le graphique
2. Parcourez le graphique avec les touches fléchées <- gauche ou -> droite
3. Double-cliquez n'importe où sur le graphique et cela ajoutera une ligne, faites glisser cette ligne pour définir le prix souhaité et le tour est joué, l'alerte est définie ! Lorsque le prix atteindra la ligne, il vous en
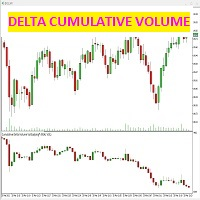
cet indicateur détecte la différence entre les contrats conclus en offre et en demande (agression) pour chaque bougie.
l'indicateur affiche dans la fenêtre dédiée sous le graphique des prix, des bougies données précisément par la différence entre les contrats vendus et achetés, qui génèrent la force volumétrique du marché.
il est possible (voir sur les captures d'écran) comment sélectionner uniquement le graphique delta des chandeliers cumulatifs, ou même avec une ligne de tendance des bougie

Cet indicateur trace jusqu'à 6 niveaux qui peuvent être activés / désactivés pour rendre le graphique plus propre selon les exigences du commerçant
Ces 6 niveaux sont en 2 ensembles : Haut et Bas
Pour chaque ensemble, différents délais peuvent être sélectionnés
Il est basé sur la stratégie d'inversion du précédent haut bas, car il est considéré que le prix montre généralement un rejet dans un délai plus court comme 5 minutes lorsque le prix atteint le haut bas quotidien, hebdomadaire ou mens

Crypto.com à MT5
Flux de bougies en direct vers Metatrader 5 à partir du websocket Crypto.com
C'est une donnée de taux en direct OHCLV (Open High Low Close Real Volume)
commerçants, si dans un graphique minute, les données OHLC ne sont pas correctes, elles peuvent donner une mauvaise analyse dans l'étude graphique technique, ce produit garantit qu'il fournit des données précises en temps réel qui peuvent aider à l'analyse manuelle
vous pouvez vérifier mon autre produit crypto sur mon profi
Le programme vous permet de copier facilement des transactions entre MetaTrader 4 (MT4) et MetaTrader 5 (MT5) dans n'importe quelle direction. Le programme est conçu pour fonctionner sur "Windows PC" et "Windows VPS". Tout type de copie est disponible
MT4 - MT4 MT5 - MT5 MT5 - MT4 MT4 - MT5 *The copier works only on forex and only with currency pairs
*deux versions du produit Trade Copier for MT4 + Trade Copier for MT5 sont nécessaires pour la copie entre les terminaux MT4 - MT5.
MT4 - htt

Voici Position Closer - la solution pour les traders qui souhaitent fermer automatiquement toutes les positions ouvertes lorsqu'ils atteignent un objectif de profit ou de perte.
Avantages de l'utilisation de Position Closer :
Facile à utiliser - il suffit de définir votre objectif de gain ou de perte pour toutes les positions ouvertes. Définissez-le une seule fois - il n'est pas nécessaire de le faire pour chaque paire de trading. Moyen pratique de gérer les positions, en particulier lorsque
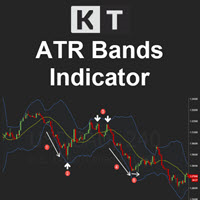
KT ATR Bands trace des enveloppes de volatilité en utilisant une combinaison de l’Average True Range (ATR) et d’une moyenne mobile. Ces bandes sont couramment utilisées pour détecter des points de retournement potentiels ainsi que des périodes de forte ou faible volatilité.
Fonctionnalités
Multi-unité de temps : Par exemple, vous pouvez afficher les bandes ATR du graphique journalier sur un graphique H1. Alertes intelligentes : Activez ou désactivez les alertes pour chaque bande, et définissez

OBTENEZ D'AUTRES EA GRATUITEMENT !!! OBTENEZ D'AUTRES EA GRATUITEMENT !!! OBTENEZ D'AUTRES EA GRATUITEMENT !!! OBTENEZ D'AUTRES EA GRATUITEMENT !!! OBTENEZ D'AUTRES EA GRATUITEMENT !!!
USD Scalper MT5 est un Neural EA pour les paires USD. Ce produit est fait pour GBPUSD, EURUSD, AUDUSD, NZDUSD. De nouvelles paires pourraient être ajoutées à l'avenir.
PAIRES ACTUELLES :
GBPUSD
EURUSD
AUDUSD
NZDUSD - SERA AJOUTÉ DANS LA PROCHAINE VERSION
CONTRIBUTIONS:
RISQUE POURCENTAGE DU RISQUE BAS
Tradez comme les grands acteurs ! ITZ est l'outil idéal pour les traders qui cherchent à s'aligner sur les mouvements institutionnels.
Il vous informe des sessions de marché entrantes et sortantes tout en exploitant des stratégies hautement optimisées pour les signaux de session.
Principales fonctionnalités :
Support multidevises – Tradez facilement sur différents actifs. Optimisé pour les périodes M1 à M30 – Idéal pour les scalpers et les day traders. 3 stratégies de signaux puissantes – Co

Smart Trading Copilot : C'est un assistant de trading intelligent qui vous aidera à gérer vos opérations quotidiennes. Le Smart Trading Copilot est équipé d'un panneau de trading convivial, avec un design moderne et utilisant une technologie de pointe.
Le Smart Trading Copilot offre un large éventail de fonctionnalités :
1. Support de gestion des risques : Il calcule automatiquement la taille de lot appropriée en fonction du pourcentage de risque spécifié et du stop loss, aidant ainsi les t

Présentation de l'indicateur L'indicateur est conçu selon des formules de moyenne mobile, ce qui est plus stable et a moins de décalage que RSI ou CCI. L'indicateur a trois valeurs d'indicateur, la période moyenne mobile et les couleurs de la ligne peuvent être modifiées manuellement. Que peut vous apporter cet indicateur ? Signaux d'entrée précis : L'indicateur dessine des signaux de flèche vers le haut et vers le bas. Analyse des tendances multi-périodes : en chargeant cet indicateur dans un

NewsCatcher Pro opens both pending and market orders based on data from the mql5.com calendar. In live mode, NewsCatcher Pro automatically downloads the calendar, opens orders, trails and closes orders. NewsCatcher Pro can trade any event from the calendar with any symbol available in MetaTrader, including Gold, Oil and cross-rates. To change the default symbol, go to the event view you want to change it for. NewsCatcher Pro uses two strategies: Strategy 1 (pending orders): the advisor opens two

Cet indicateur de tableau de bord multi-symboles peut envoyer une alerte lorsqu'une forte tendance a été identifiée. Il peut le faire en construisant le tableau de bord à l'aide des indicateurs/oscillateurs suivants (ci-après uniquement mentionnés comme indicateurs) : RSI, Stochastics, ADX, CCI, MACD, WPR (Williams Percent Range, également appelé Williams %R), ROC (Price taux de changement) et oscillateur ultime. Il peut être utilisé avec toutes les tranches horaires de M1 à MN (il ne peut affic

Alert Stochastic plus delay and level Filter
A stochastic oscillator is a momentum indicator comparing a particular closing price of a security to a range of its prices over a certain period of time. We added many types of alerts plus the Level Cross Filter to aid in your search for better opportunities in the market. Product Features Sound alert Push Notification (Alerts can be sent to your mobile phone) Signs on chart Alert box Level Filter Delay Level Filter
Indicator Parameters K,D

Indicateur de trading manuel et d'analyse technique pour le Forex.
Il se compose d'un indicateur de tendance avec le niveau d'ouverture du jour de bourse et d'un indicateur de flèche pour déterminer les points d'entrée.
L'indicateur ne se recolore pas ; il fonctionne lorsque la bougie se ferme.
Contient plusieurs types d'alertes pour les flèches de signalisation.
Peut être configuré pour fonctionner sur n’importe quel graphique, instrument de trading ou période.
La stratégie de travail est bas
L'utilitaire est conçu pour cloner des transactions sur votre compte de trading - le programme ouvre une transaction supplémentaire avec vos paramètres. Il permet d'augmenter ou de diminuer le lot, d'ajouter un lot, de modifier les paramètres stoploss et takeprofit. Le programme est conçu pour fonctionner sur "Windows PC" et "Windows VPS". Buy a cloner and get the second version for free
Paramètres : CLONE_POSITIONS - les commandes à cloner ; MAGIC_NUMBER - numéro magique ; DONT_REPEAT_TRADE
Introduction de l'EA Moving Average REMARQUE - Après avoir acheté The Moving Average EA, envoyez-moi un message privé pour recevoir gratuitement mon utilitaire TradeWatch EA ! L'EA Moving Average est un outil de trading flexible conçu spécifiquement pour les indices synthétiques, tout en étant également efficace avec le forex et d'autres classes d'actifs. Contrairement à de nombreux EA qui reposent sur des réglages de moyennes mobiles fixes, cet EA permet aux utilisateurs de personnaliser complè

La divergence est l’un des signaux les plus importants permettant d’anticiper un retournement de tendance sur le marché. KT Stoch Divergence détecte les divergences régulières et cachées entre le prix et l’oscillateur stochastique.
Limitations de KT Stoch Divergence
Utiliser les divergences stochastiques comme unique signal d'entrée peut être risqué. Toutes les divergences ne conduisent pas à une forte inversion. Pour de meilleurs résultats, combinez-les avec l'action des prix et la direction d

Je vous recommande de lire le blog du produit (manuel) du début à la fin afin que il est clair dès le début ce que propose l'EA. La stratégie principale de cet Expert advisor (EA) est de placer des trades lorsque 3 moyennes mobiles (MA) sont alignées consécutivement et à une certaine distance l'une de l'autre (elle peut être utilisée par exemple pour une stratégie peu connue utilisée par certains traders institutionnels , ce qui implique les MA 10, 20 et 30 sur la plage horaire D1

The Engulf Seeker indicator is a powerful tool designed to detect engulfing candlestick patterns with precision and reliability. Built on advanced logic and customizable parameters, it offers traders valuable insights into market trends and potential reversal points.
Key Features and Benefits: Utilizes revised logic to analyze previous candles and identify strong bullish and bearish engulfing patterns. Convenient arrow-based alert system notifies traders of pattern occurrences on specific symbo
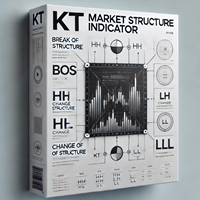
The KT Market Structure intelligently detects and displays Break of Structure (BOS) , Change of Character (CHoCH) , Equal Highs/Lows (EQL) , and various significant swing high/low points using our proprietary algorithm for accurate pattern detection. It also offers advanced pattern analysis by effectively demonstrating the captured profit for each pattern. A fully automated EA based on this indicator is available here: KT Market Structure EA MT5
Features
Accurate Pattern Detection: Our advance

Nous vous présentons une offre unique - un produit innovant appelé Space Cake qui changera votre approche du trading sur le marché! Ce produit est spécialement conçu pour les traders et investisseurs expérimentés qui souhaitent augmenter leur efficacité et réduire les risques. Grâce à ses fonctions et fonctionnalités uniques, il deviendra un assistant indispensable dans vos activités de trading.
Sans martingale, grilles et autres stratégies à haut risque.
Version MT4- Cliquez sur
Principaux
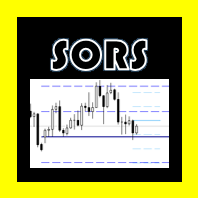
THE SORS COMPLEXES
This indicator is designed to draw the SORS lines on the graph, these are the modern way of calculating market points that it usually respects, they are comprised of supports and resistance, but unlike the classics, these are calculated from volatility endogenous and standard deviation,
In the configuration you can change the color of each level linear and hide the ones that are not needed.
A = Annual. M = Monthly. W = Weekly D = Daily.

RSI Robot Easy This fully configurable robot has the purpose of executing orders using the RSI indicator as a base. It is possible to choose whether the entries will happen when entering the overbought areas and / or when leaving the oversold area. It is possible to configure stoploss and takeprofit, as well as the maximum number of orders at a time.
Aurélio Machado.
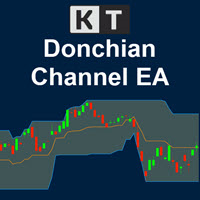
Le KT Donchian Channel Robot utilise une stratégie puissante combinant la cassure du canal Donchian, la direction de l’EMA et la mesure de la volatilité via l’ATR. Entrée Achat : Cassure par le haut + EMA en hausse + Volatilité en augmentation. Entrée Vente : Cassure par le bas + EMA en baisse + Volatilité en baisse.
Fonctionnalités Fonctionne efficacement avec tout type de compte, indépendamment des conditions du broker. Toutes les positions sont protégées par un stop-loss et un take-profit. A

GoldRushX - Le Robot de Trading que Vous Ne Pouvez Pas Manquer Nous vous présentons GoldRushX, votre nouveau partenaire automatisé pour maximiser vos profits sur les marchés financiers. Développé sur la base d'algorithmes robustes et converti directement depuis Pine Script, GoldRushX est une solution complète pour les traders en quête d'efficacité, de précision et d'une gestion avancée du risque. Caractéristiques Principales: Bandes de Bollinger et Moyennes Mobiles: Grâce à un calcul précis des

Libérez la Précision du Trading avec Koala FVG Scalper - Votre Solution pour le Scalping Multi-Devises Découvrez le Koala FVG Scalper innovant, un expert advisor conçu pour tirer parti du concept Qualified FVG (Fair Value Gap). Augmentez votre trading avec ce EA de scalping innovant, intégré de manière transparente avec l'indicateur Koala FVG, disponible gratuitement ici . Principaux Avantages: Haute Précision: Atteignez plus de 80% de prédictions correctes sur le cadre temporel H1 pour plusieur

Ultimate Double Top Scanner (Multi Pair And Multi Time Frame) : ---LIMITED TIME OFFER: NEXT 25 CLIENTS ONLY ---46% OFF REGULAR PRICE AND 2 FREE BONUSES ---SEE BELOW FOR FULL DETAILS Any major price level that holds multiple times, is obviously a level that is being defended by
the large institutions. And a strong double top pattern is a clear indication of institutional interest.
Double top patterns are widely used by institutional traders around the world. As they allow you to manage
yo

Volume Break Oscillator est un indicateur qui fait correspondre le mouvement des prix aux tendances des volumes sous la forme d'un oscillateur.
Je souhaitais intégrer l'analyse des volumes dans mes stratégies mais j'ai toujours été déçu par la plupart des indicateurs de volume, tels que l'OBV, le Money Flow Index, l'A/D mais aussi le Volume Weighted Macd et bien d'autres. J'ai donc écrit cet indicateur pour moi-même, je suis satisfait de son utilité, et j'ai donc décidé de le publier sur le ma
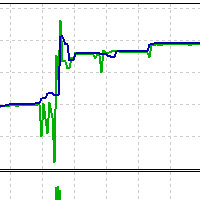
This strategy ensures significantly lower risk by employing advanced techniques and AI-driven filters to identify only the highest quality setups on a 1-minute timeframe. Configurations Based on Investment: $100 : Utilize an FBS broker cent account to convert $100 to $10,000 (cents). $1,000 : Apply a 0.25 lot size using the precise configurations detailed in the provided screenshot. $10,000 : Execute trades with a 10 lot size, adhering strictly to the specified configurations. $100,000 : Operat
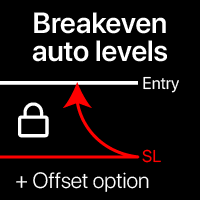
Niveaux automatiques de seuil de rentabilité En utilisant cet utilitaire, vous pouvez activer le mouvement automatique du SL, lorsque le trade atteint un profit souhaité. Particulièrement important pour les traders à court terme. L'option de décalage est également disponible : une partie du profit peut être protégée. Utilitaire multifonction : 66+ fonctionnalités, incluant cet outil | Contactez-moi pour toute question | Version MT4 Processus d'activation de la fonction automatique de seuil de r

Imbalance DOM Pro : Optimisez vos trades avec l'imbalance du carnet d'ordres AVEZ-VOUS ACCÈS AU CARNET D'ORDRES SUR MT5 ? SOUHAITEZ-VOUS ÉLEVER VOTRE TRADING À UN NIVEAU SUPÉRIEUR ? Si vous êtes un trader qui utilise le flux d'ordres pour prendre des décisions, Imbalance DOM Pro peut révolutionner votre analyse. Parfait pour les scalpers et les traders à court terme, cet outil identifie les déséquilibres dans le carnet d'ordres et vous offre des opportunités de trading précieuses pour des e

Hedge Assistant - Le Hedge Assistant est un Expert Advisor (EA) intuitif, conçu pour simplifier les opérations de couverture. Cet EA prend en charge deux stratégies de couverture : simple et double. Pour plus de détails sur ces stratégies, consultez les vidéos explicatives disponibles sur notre chaîne YouTube (liens et images joints). Fonctionnalités : Backtest : Il n'est pas possible de réaliser un backtest, car les ordres sont exécutés manuellement via les boutons du panneau, nécessitant l'in
WaveTrend 3D is the mql version of this oscillator (By jdehorty and LazyBear). WaveTrend 3D (WT3D) is a novel implementation of the famous WaveTrend (WT) indicator and has been completely redesigned from the ground up to address some of the inherent shortcomings associated with the traditional WT algorithm.
WaveTrend 3D is an alternative implementation of WaveTrend that directly addresses some of the known shortcomings of the indicator, including its unbounded extremes, susceptibility to whips

R6 Scalping EA is a fully automated Expert Advisor with no use of martingale or hedge. This EA can be run from very small accounts and Free swap. As small as 1000 $ or 1000 cent minimum Recommendations The minimum deposit is 1000 USD. Use a broker with good execution and Low Spread. A very fast VPS is required.
NOTE : I also recommend to take out profit on a regular basis. That is once a week/month. Becauser there will be DD. This EA works best at an 1:200 UP++ leverage account with sm

Utilitaire de gestion des positions ouvertes et des commandes en attente. Le trailing stop intégré a cinq modes et sept outils. Il existe un stop loss virtuel et un take profit virtuel, qui peuvent être librement déplacés sur le graphique. À l'aide du simulateur de trading intégré, vous pouvez vérifier le fonctionnement de l'EA dans le testeur de stratégie. Un guide détaillé de UTralVirtualMT5 peut être trouvé dans la section "Commentaires". Dans le testeur MT5, le mouvement manuel des lignes vi
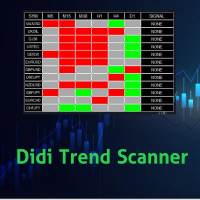
Didi Trend Scanner is an indicator for scanning market watch and detect market direction for each Time Frames and give signals for each pair
You can make decision of making trades by this scanner that specify market trend direction for you For each time frame you can add and remove any pairs you want to scan the scanner send alert via push notifications and email

Le Expert Advisor "Speedometer" est basé sur une stratégie d'analyse de la vitesse des ticks, permettant d'identifier les points d'entrée et de sortie en fonction des variations du taux de données des ticks. Le Expert Advisor surveille la dynamique des ticks et ouvre des positions lorsqu'un seuil de vitesse de tick spécifié est atteint, ce qui permet d'entrer sur le marché en temps opportun pendant les périodes de forte activité et d'éviter les trades en période de faible volatilité. Le Expert

Minuteur de compte à rebours de bougie – Restez en avance sur le marché Vous êtes-vous déjà demandé combien de temps il reste avant que la bougie actuelle ne se ferme ? Le timing est essentiel en trading. Le minuteur de compte à rebours de bougie est la solution idéale pour les traders qui ont besoin d'une synchronisation précise pour exécuter leurs stratégies de manière efficace. Que vous soyez scalpeur, day trader ou swing trader, cet outil vous garantit de ne jamais manquer un moment crucial.
Tradez plus intelligemment avec les alertes CRT en temps réel ! Le CRT Alert EA est conçu pour les traders utilisant la Théorie de l’Amplitude des Bougies (CRT). Cet outil surveille plusieurs unités de temps et envoie une alerte dès que la troisième bougie se forme. Fonctionnalités :
Alertes en temps réel
Surveillance multi-timeframes
Paramètres personnalisables
Notifications push MT5
Davantage de fonctions à venir Fonctionnement :
1️⃣ Surveille 3 bougies consécutives selo

Martingale. "Oberon iMA" se compose de 15 blocs distincts (mini Expert Advisors), qui résument le profit et distribuent le drawdown dans le temps.
Particularités : Données d'entrée individuelles pour chaque caractère. Les symboles peuvent être répétés (même 15 symboles identiques s'échangeront séparément les uns des autres). Sur un même compte de trading, vous pouvez installer plusieurs "Oberon iMA" avec des paramètres différents (en respectant la condition : Magic[i+1]>Magic[i]+15). Insta

Golden Trend Pulse — trend indicator developed specifically for Gold, also applicable to the Cryptocurrency and Stock markets. The indicator is designed for precise determination of market trends using advanced analytical methods. The tool combines multifactor analysis of price dynamics and adaptive filtering of market noise, ensuring high accuracy in identifying key entry and exit points. Thanks to its intelligent system, the indicator effectively handles market variability, minimizing false
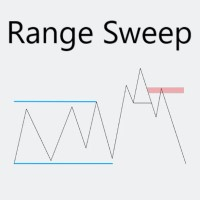
The strategy is quite simple but extremely effective. For Smart Money and ICT traders it may also be known as "Asian Range Sweep", "London Session Sweep" or a "Liquidity Raid".
First of all, the EA marks high and low of the chosen time range and then waits for the price to sweep high or low. Now when a liquidity of a high/low is taken, EA waits for the Market Structure Shift (MSS) and enters a trade on an imbalance (FVG) formed in the displacement.
MT4 version: CLICK The bot includes many func

Uses the built-in news calendar of the MT5 terminal or the Investing.com website (in the latter case, the Get news5 utility is required) Has the Scale parameter={100%, 110%, 125%, ...} to adjust the comfortable size of the text and control elements
Tells you in which direction it is safer to open positions 3 in 1: News + Trends + Forecast
News for the selected period: current and in tabular form
Actual trends for 5 customizable timeframes and trend reversal levels
Forecast of exchange rate mo

L'indicateur affiche des schémas harmoniques sur le graphique basé sur Dynamic ZigZag ( https://www.mql5.com/en/market/product/5356 ) et est presque un analogue complet de l'une des versions du célèbre korHarmonics. L'indicateur reconnaît les modèles suivants et leurs variétés : ABCD, Gartley (Papillon, Crabe, Chauve-souris), 3Drives, 5-0, Batman, SHS, One2One, Camel, Triangles, WXY, Fibo et Vibrations. Seul l'affichage des modèles ABCD et Gartley est activé dans les paramètres par défaut. L

OBTENEZ D'AUTRES EA GRATUITEMENT !!! OBTENEZ D'AUTRES EA GRATUITEMENT !!! OBTENEZ D'AUTRES EA GRATUITEMENT !!! OBTENEZ D'AUTRES EA GRATUITEMENT !!! OBTENEZ D'AUTRES EA GRATUITEMENT !!!
RSI Grid est basé sur les conditions de surachat et de survente RSI et ouvre une grille lorsque le commerce est du côté perdant du marché. Le RSI fournit aux traders techniques des signaux sur la dynamique des prix haussière et baissière, et il est souvent tracé sous le graphique du prix d'un actif. Un actif est

Crazy Scalper mt5 Crazy scalper Crazy Scalper is a non-indicator trading robot that uses a scalping system that trades in two directions simultaneously (buys and sells). At the same time, multidirectional positions cannot be profitable, and one of the open positions will necessarily go to a loss. If there is a losing position, a lock (lock) is used. In turn, if the locking position has not fulfilled its role and the quote reversed, the withdrawal is used without loss, according to the averag

* Zigzag corrigé et accéléré. (Vous pouvez changer la plage) * Le zigzag est mis à jour à chaque nouvelle bougie/barre. * Si vous le souhaitez, en activant le bouton, uniquement lorsque vous cliquez sur le bouton, il recherche un motif. Si vous le faites automatiquement, il recherche chaque fois que le graphique est actualisé. * 17 modèles harmoniques fréquemment utilisés et un modèle spécial que vous pouvez définir vos propres proportions. * Vous pouvez garder le graphique simple avec l'affich
Le MetaTrader Market offre un lieu pratique et sécurisé pour acheter des applications pour la plateforme MetaTrader. Téléchargez des versions démo gratuites de Expert Advisors et des indicateurs directement depuis votre terminal pour les tester dans le testeur de stratégie.
Testez les applications dans différents modes pour surveiller les performances et effectuez un paiement pour le produit que vous souhaitez en utilisant le système de paiement MQL5.community.
Vous manquez des opportunités de trading :
- Applications de trading gratuites
- Plus de 8 000 signaux à copier
- Actualités économiques pour explorer les marchés financiers
Inscription
Se connecter
Si vous n'avez pas de compte, veuillez vous inscrire
Autorisez l'utilisation de cookies pour vous connecter au site Web MQL5.com.
Veuillez activer les paramètres nécessaires dans votre navigateur, sinon vous ne pourrez pas vous connecter.