Regardez les tutoriels vidéo de Market sur YouTube
Comment acheter un robot de trading ou un indicateur
Exécutez votre EA sur
hébergement virtuel
hébergement virtuel
Test un indicateur/robot de trading avant d'acheter
Vous voulez gagner de l'argent sur Market ?
Comment présenter un produit pour qu'il se vende bien
Expert Advisors et indicateurs pour MetaTrader 5 - 106

KT Auto Trendline draws the upper and lower trendlines automatically using the last two significant swing highs/lows. Trendline anchor points are found by plotting the ZigZag over X number of bars.
Features
No guesswork requires. It instantly draws the notable trendlines without any uncertainty. Each trendline is extended with its corresponding rays, which helps determine the area of breakout/reversal. It can draw two separate upper and lower trendlines simultaneously. It works on all timefr
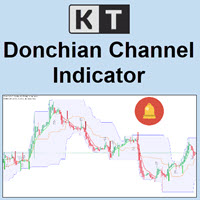
KT Donchian Channel is an advanced version of the famous Donchian channel first developed by Richard Donchian. It consists of three bands based on the moving average of last high and low prices. Upper Band: Highest price over last n period. Lower Band: Lowest price over last n period. Middle Band: The average of upper and lower band (Upper Band + Lower Band) / 2. Where n is 20 or a custom period value is chosen by the trader.
Features
A straightforward implementation of the Donchian channel

KT Coppock Curve is a modified version of the original Coppock curve published in Barron's Magazine by Edwin Coppock in 1962. The Coppock curve is a price momentum indicator used to identify the market's more prominent up and down movements.
Features
It comes with up & down arrows signifying the zero line crossovers in both directions. It uses a simplified color scheme to represent the Coppock curve in a better way. It comes with all kinds of Metatrader alerts.
Applications It can provide

KT Absolute Strength measures and plots the absolute strength of the instrument's price action in a histogram form. It combines the moving average and histogram for a meaningful illustration. It supports two modes for the histogram calculation, i.e., it can be calculated using RSI and Stochastic both. However, for more dynamic analysis, RSI mode is always preferred.
Buy Entry
When the Absolute Strength histogram turns green and also it's higher than the previous red column.
Sell Entry
W

Dyj cash Registry travaille sur les indicateurs techniques de dyj. Lorsque le marché est fort
C'est une opportunité et un marché sûrs. Les avantages sont compatibles avec les heures de négociation sécuritaires.
L'EE utilise le modèle de commande unique pour minimiser le volume des transactions et maximiser la stratégie de l'algorithme de règlement des bénéfices.
Pas de réseau.
Pas d'arbitrage.
Pas de haies.
Pas de Martingale. Please download the setting file and the PDF file of the back
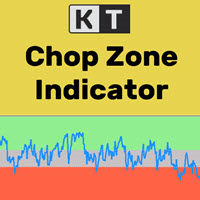
It's a well-known fact that most of the financial markets trend only 30% of the time while moving in a closed range rest 70% of the time. However, most beginner traders find it difficult to see whether the markets are trending or stuck in a range. KT Chop Zone solves this problem by explicitly highlighting the market phase into three zones as Bearish Zone, Bullish Zone, and Chop Zone.
Features
Instantly improve your trading by avoiding trade during the sideways market (Chop Zone). You can al

The indicator is a trading system for AUDUSD or NZDUSD currency pairs.
The indicator was developed for time periods: M15, M30.
At the same time, it is possible to use it on other tools and time periods after testing.
"Kangaroo Forex" helps to determine the direction of the transaction, shows entry points and has an alert system.
When the price moves in the direction of the transaction, the maximum length of the movement in points is displayed.
The indicator does not redraw, all actio

KT Forex Session shows the different Forex market sessions using meaningful illustration and real-time alerts. Forex is one of the world's largest financial market, which is open 24 hours a day, 5 days a week. However, that doesn't mean it operates uniformly throughout the day.
Features
Lightly coded indicator to show the forex market sessions without using massive resources. It provides all kinds of Metatrader alerts when a new session starts. Fully customizable.
Forex Session Timings I
Be sure to consult with me before buying.
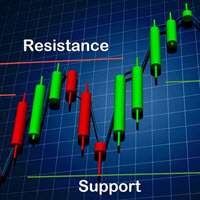
The robot trades based on support and resistance levels. You can use weekly and monthly times for less risk. More risk in daily and 4-hour times. Be sure to disable the robot at news times.Works on all currency pairs, indices, commodities and metals. Only observing the trade at the time of news will make this robot profitable. Automatic news management will be added in future versions.
benefits:
Works on all instruments and time series,

Only 5 copies of the EA at $30! Next price --> $45 This robot works on the basis of bowling band and has stepped entrances at safe points.
benefits:
Works on all instruments and time series,
It has excellent inputs for position management that can avoid a lot of risk.
Input settings:
Volume: Selects a fixed volume for the trade that uses its own risk management if it is zero.
Risk for all positions: The amount of risk for all positions in one direction,

KT Risk Reward shows the risk-reward ratio by comparing the distance between the stop-loss/take-profit level to the entry-level. The risk-reward ratio, also known as the R/R ratio, is a measure that compares the potential trade profit with loss and depicts as a ratio. It assesses the reward (take-profit) of a trade by comparing the risk (stop loss) involved in it. The relationship between the risk-reward values yields another value that determines if it is worth taking a trade or not.
Featur

Trend Direction Up Down Indicator Trend Direction Up Down is part of a series of indicators used to characterize market conditions.
Almost any strategy only works under certain market conditions.
Therefore it is important to be able to characterize market conditions at any time: trend direction, trend strength, volatility.
Trend Direction Up Down is an indicator to be used to characterize trend direction (medium term trend):
trending up trending down ranging Trend Direction Up Down is ba

Trend Strength MA indicator Trend Strength MA is a part of a series of indicators used to characterize market conditions.
Almost any strategy only works under certain market conditions.
Therefore, it is important to be able to characterize market conditions at any time: trend direction, trend strength, volatility, etc.
Trend Strength MA is an indicator to be used to characterize trend strength:
Up extremely strong Up very strong Up strong No trend Down strong Down very strong Down extrem

Trend Direction ADX indicator Trend Direction ADX is part of a serie of indicators used to characterize market conditions.
Almost any strategy only work under certain market conditions.
Therefore it is important to be able to characterize market conditions at any time: trend direction, trend strength, volatility, etc..
Trend Direction ADX is an indicator to be used to characterize trend direction:
trending up trending down ranging Trend Direction ADX is based on ADX standard indicator.
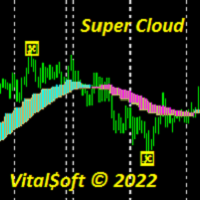
The Super Cloud indicator helps to determine the direction of the trend when trading. Shows on the chart signals about a possible upcoming trend change. The indicator provides an opportunity to detect various features and patterns in price dynamics that are invisible to the naked eye. Based on this information, traders can anticipate further price movement and adjust their strategy accordingly. Works on all timeframes except MN.
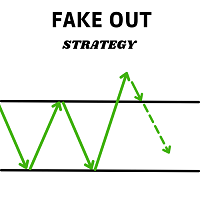
This expert advisor finds and operates the Fake out pattern, the search algorithm and its management can be adjusted from the Bot's configuration parameters.
Features: - Designed to operate with any type of asset.
- It is possible to set the time range in which the expert advisor will operate.
- Trailing stop managed internally by the algorithm.
- Partial position closing (partial profit taking), when the price has moved in favour of the position.
- Take profit automatically adjusted

The Analytical cover trend indicator is a revolutionary trend trading and filtering solution with all the important features of a trend tool built into one tool! The Analytical cover indicator is good for any trader, suitable for any trader for both forex and binary options. You don’t need to configure anything, everything is perfected by time and experience, it works great during a flat and in a trend.
The Analytical cover trend indicator is a tool for technical analysis of financial markets

According to Sir Isaac Newton's 3rd law, every action has its reaction and every movement must be compensated by an opposite movement of equal magnitude. The market cannot be oblivious to this physical principle, so when the force of gravity in the market of the big sharks hides like the sun behind the horizon, the night session allows us to see this law in all its splendor. This EA takes advantage of this movement to trade in the night session . Newton´s third law is designed to operate in the
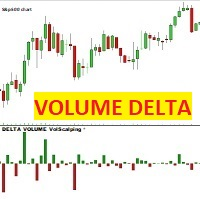
VOLUME DELTA Volscalping Cet indicateur, pour chaque bougie de prix, dessine une bougie Delta, qui est la différence entre les contrats achetés et vendus. La bougie sera rouge et négative si les contrats négociés dans l'offre (vendus) dépassent ceux dans la demande, au contraire, la bougie sera verte et positive si les contrats négociés dans l'ASK (achetés) dépassent ceux dans l'offre.
ATTENTION : L'indicateur ne fonctionne qu'avec des courtiers qui fournissent un flux de données de marché r
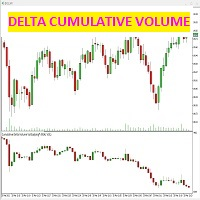
cet indicateur détecte la différence entre les contrats conclus en offre et en demande (agression) pour chaque bougie.
l'indicateur affiche dans la fenêtre dédiée sous le graphique des prix, des bougies données précisément par la différence entre les contrats vendus et achetés, qui génèrent la force volumétrique du marché.
il est possible (voir sur les captures d'écran) comment sélectionner uniquement le graphique delta des chandeliers cumulatifs, ou même avec une ligne de tendance des boug
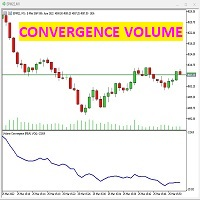
cet indicateur montre la force du volume réel par rapport au prix. si le graphique des prix et la tendance du volume ont la même tendance, cela signifie que tout est régulier. si l'indicateur s'écarte du graphique des prix, cela signifie que l'inversion est proche. lorsque le prix monte et que le graphique de "convergence des volumes" descend, cela signifie que l'argent sort du marché, que les vendeurs vendent à la hausse et que le prix devrait bientôt commencer à chuter. à l'inverse, si le gra
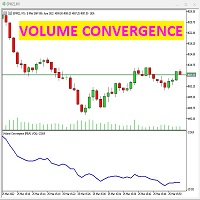
cet indicateur montre la force du volume réel par rapport au prix. si le graphique des prix et la tendance du volume ont la même tendance, cela signifie que tout est régulier. si l'indicateur s'écarte du graphique des prix, cela signifie que l'inversion est proche. lorsque le prix monte et que le graphique de "convergence des volumes" descend, cela signifie que l'argent sort du marché, que les vendeurs vendent à la hausse et que le prix devrait bientôt commencer à chuter. à l'inverse, si le gra

DreamlinerEA Live Results: https://www.mql5.com/en/signals/1459431
DreamlinerEA MT4 version: https://www.mql5.com/en/market/product/72691 DreamlinerEA is a fully automated Expert Advisor based on the author's trading strategy. During a period of low market volatility, when liquidity is not enough for the formation of a trend and breakdown of important levels, the system trades in the Channel and use small TP values (scalping) to quickly fix profit and re-enter the market, which sign
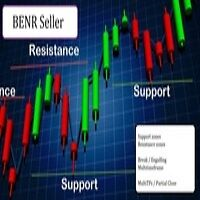
Cet EA permet de gérer les zones de supports et résistances sur MetaTrader 5…mais pas seulement.
A vos zones d’achat et de vente(au nombre de 2), vous pouvez ajouter 2 options pour entrer en position :
Option1 : c’est l’option qui rentre en position sans signal : des que le prix atteint la zone, le robot envoie un trade.
Option 2 : ici le robot va attendre un break dans le timeframe sélectionné. Exemple : vous mettez vos zones sur un graph H4 (pour la visibilité vous le laissez sur le H
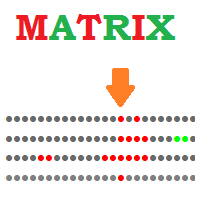
Matrix Indicator Matrix Indicator is a simple but effective indicator.
Matrix indicator displays usual oscillators indicators in a user friendly color coded indicator.
This makes it easy to identify when all indicators are aligned and spot high probability entries.
Inputs of indicator are:
Indicator: RSI, Stochastic, CCI, Bollinger Bands Param1/Param2/Param3: usual settings for the indicator ValueMin: Oversold level for oscillator ValueMax: Overbought level for oscillator The indicator
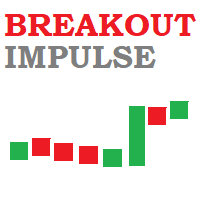
Breakout Impulse Indicator Breakout Impulse Indicator is a pattern recognition indicator for Forex, Stocks, Indices, Futures, Commodities and Cryptos.
The Breakout Impulse is a multi-bar pattern.
The purpose of the pattern is to identify a fast change in momentum.
This type of change can announce the start of a big directional move.
Inputs of the indicator are:
Distance : distance in pixel relative to top or bottom of candle to display the arrow symbol MaxBars : number of bars back u
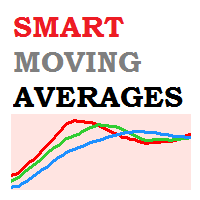
Smart Moving Averages Indicator Smart Moving Averages is an exclusive indicator for Metatrader platform.
Instead of calculating moving averages for the selected chart time frame, the Smart Moving Averages indicator gives you the opportunity to calculate moving averages independently from the chart time frame.
For instance you can display a 200 days moving average in a H1 chart.
Inputs of the indicator are:
Timeframe : timeframe to be used for the calculation of the moving average Perio
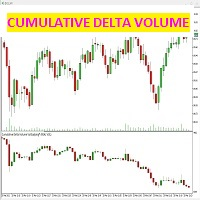
cet indicateur détecte la différence entre les contrats conclus en offre et en demande (agression) pour chaque bougie.
l'indicateur affiche dans la fenêtre dédiée sous le graphique des prix, des bougies données précisément par la différence entre les contrats vendus et achetés, qui génèrent la force volumétrique du marché.
il est possible (voir sur les captures d'écran) comment sélectionner uniquement le graphique delta des chandeliers cumulatifs, ou même avec une ligne de tendance des boug
Automatic trend lines. Type 1. With two extremums. 1) From the current bar "go" to the left and look for the first (right) extremum point with the InpRightExmSide bars on both sides. 2) From the first point again "go" to the left and look for the second (left) extremum point with the InpLeftExmSide bars on both sides.

Traders Toolbox Overwatch - est un utilitaire de surveillance pour toutes les instances en cours d'exécution de Traders Toolbox.
Il s'agit d'un simple utilitaire de changement de graphique et d'une surveillance du marché pour tous les graphiques Traders Toolbox Running.
Caractéristiques:
1. Couleurs, lignes et colonnes des boutons personnalisables.
2. Trois types de signaux (Hold - Yellow / Sell - Red / Buy - Green)
3. Mise à jour dynamique de la liste des boutons en fonction d

KT Trend Magic shows the trend depiction on chart using the combination of market momentum and volatility. A smoothing coefficient is used to smooth out the noise from the signal.It can be used to find out the new entries or confirm the trades produced by other EA or indicator.
Features
Drag n drop MTF scanner which scans for the new signals across multiple time-frames. Find new entries in the trend direction. Improve the accuracy of other indicators when used in conjunction. Can be used as a

Magic Night is an automated trading system that uses a channel indicator and candlestick patterns to open and close trades.
Trades every day at a specific time.
Doesn't use grid, martingale or other dangerous money management methods.
Timeframe М5, currency pairs EURAUD, EURCAD, GBPCAD, GBPUSD Minimum deposit 70 usd.
Live signal https://www.mql5.com
Instructions for installing https://Blogs Magic Night
Download set files https://Sets Magic Night
Settings EA Order_Comment - Orde

It is a strategy throughout the history of trading. This since it uses a divergence between the RSI and the price. Many traders use this. The backtest is done in 4 hours, but it can work in other timeframes. It is a risk-benefit ratio of 2:1 since the stop loss is 50 pips and the target to be reached is 100 pips. All these values can be modified at the discretion of the trader. PARAMETERS: LotSize: Its use is recommended at 0.1 for accounts that operate full lots and 1 for accounts that operat

This indicator shows your daily profit for each chart. Please let me know in the comment section or via the MQL5 chat if you want find any problem, or if you want any specific features for this indicator. How to use:
Attach the indicator to the chart you want to see your profit. You can change the color of the indicators. (Currently positive figures are green, and negative are red) You can display the profit for pair it is attached, or for the whole account (all the pairs)

This EA is there to take your trade closing stress away. Quickly close as many trades as you have opened at the click of a button, INCLUDING PENDING ORDERS. This works on the MT5 platform whether it be currencies, Indices, stocks or Deriv synthetic indices. I have saved it under utilities as it is a utility, however, to install this, you have to save the file in you "EA" folder. That is; Go to "File", then "Open Data Folder", "MQL5" and then "Experts". Paste this file there. Restart MT5 and you'
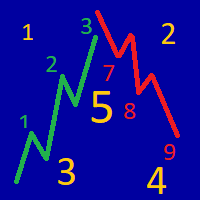
The indicator determines the strength of the trend and its possible reversal points, based on the author's arithmetic approach .
Each new peak or trough is a trend development. Such peaks and troughs are numbered so that the strength of the trend development can be seen. Attempts to change the trend are also numbered. This gives an understanding of a possible change in the direction of the trend. Indicator signals are generated when trying to change the trend .
In the settings, it i

Mean Volume Most indicators are based on price analysis.
This indicator is based on volume. Volume is overlooked piece of information in most trading systems.
And this is a big mistake since volume gives important information about market participants.
Mean Volume is an indicator that can be used to spot when volume is above average.
It usually means that institutional traders are active.
Peak in volume can be used to confirm an entry since increased volume can sustain the move in one or

Painel informativo para day trade. Funciona em conta NETTING ou conta HEDGE. Tem a possibilidade de separar as infomrações dos trades conforme o número mágico de cada EA. Foi desenhado para melhor funcionamento no mercado futuro da B3. Durante as operações, o painel faz a plotagem das linhas de preço, stoploss e takeprofit (gain). Possui informações de volume, preço médio, lucro e stops. Mostra o histórico de ganhos diário, semanal, mensal e anual.
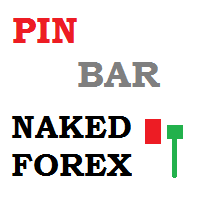
Pin Bar Indicator
The Pin Bar indicator is a pattern recognition indicator for Forex, Stocks, Indices, Futures, Commodities and Cryptos.
The strategy that comes with the Pin Bar pattern is based on price action.
Inputs of the indicator are:
Distance : distance in pixels relative to top or bottom of candle to display the arrow symbol UseAlerts (true/false): enable alerts PopAlerts (true/false): enable alerts in the popup window EmailAlerts (true/false): enable email alerts PushAle
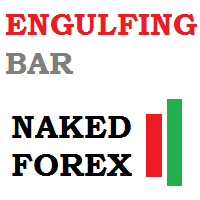
Engulfing Bar IndicatorEngulfing Bar indicator is a pattern recognition indicator for Forex, Stocks, Indices, Futures, Commodities and Cryptos.
The Engulfing Bar indicator is an enhanced pattern of the popular Engulfing Bar to keep only the best patterns produced in the market.
The strategy that comes with the Engulfing Bar is based on price action.
Inputs of the indicator are:
Distance: distance in pixels relative to top or bottom of candle to display the arrow symbol UseAlerts (true/
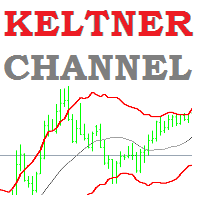
Keltner Channel Indicator Keltner Channel is an oscillator like Bollinger Bands.
Keltner Channel is a very good tool to time entries for your strategy.
Keltner Channel displays a channel where price is supposed to stay unless we are in overbought or oversold situations.
Various strategies use Keltner Channel indicator successfully to spot overbought / oversold situations and look for reversals.
Keltner Channel indicator uses ATR to determine overbought and oversold situations. Inputs of the

This EA is based on ADX strategy. Advantage: - Stable
- No grid martingale
- No scalper We recommend with following settings.
Symbol : XAUUSD
Period : 30M
Lot: recommend following rule: 100usd - 0.01 lots
1000usd - 0.1 lots or lower
2000usd - 0.2 lots or lower
10000usd - 1 lots or lower We do not recommend higher lots.
Need gold spreadless broker. Maybe VIP or Pro user with your broker.

Utilitaire pour copier des transactions d'un compte MT5 ou d'un compte MT4 vers un autre compte MT5. Demo-version can be downloaded here .
Vous pouvez copier des positions entre les comptes netting et Hedging dans n'importe quelle combinaison. Vous pouvez définir des filtres en fonction du nom de l'outil et des numéros de position magiques à copier. Jusqu'à présent, la source envoie des informations uniquement sur les positions du marché. Les ordres en attente sont traités au moment où ils

Normalized Volume99% of indicators are based on price analysis.
This indicator is based on volume. Volume is overlooked piece of information in most trading systems.
And this is a big mistake since volume gives important information about market participants.
Normalized Volume is an indicator that can be used to confirm reversal points.
The indicator code volume with colors indicating high, normal and low volume.
You could enhance dramatically your trading system using volume analysis.

This system is good at identifying short term reversals in the market. It is based on a machine learning study on market structure, and can be a great tool to scan the market or direct trades. With everything, there isn't a 100% win-rate, but this indicator is sometimes always accurate. When it thinks a reversal will happen, it will color the candle a specific color, draw an arrow and then alert you on whether to buy or sell the upcoming candle. Simple Setup Drag and drop onto any chart, at

Fisher Kuskus Indicator Fisher Kuskus is an indicator used by scalpers on low time frames like M1.
The Fisher Kuskus is now available for Metatrader platform.
Inputs of the indicator are:
Period : period to be used for calculation of the indicator PriceSmoothing : value of 0.0 to 0.99 IndexSmoothing : value of 0.0 to 0.99 The indicator can be used with any time frame.
It can be used with any class of assets: Forex, Stocks, Indices, Futures, Commodities and Cryptos. Other indicators for
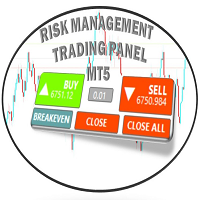
Risk Management Trading Panel calculates the volume of a position based on Account Balance , Currency , Currency Pairs , Synthetic Indices (Deriv Broker) once the user places stop-loss level ,and risk tolerance (set in percentage points of current balance). It also Displays reward/risk ratio based on take-profit and it shows recommended risk per trade based on current balance.
Trailing Stop your positions and Applying Breakeven with a push of a button has never been easier and you can also set

This EA is based on Supertrend strategy. Advantage: - Always trade with stoploss
- Stable
- No grid martingale
- No scalper We recommend with following settings.
Symbol : US100 or US30
Period : 1H
UseDynamicStoplose: true Lot: recommend following rule:
100usd - 0.01 lots
1000usd - 0.1 lots or lower
2000usd - 0.2 lots or lower
10000usd - 1 lots or lower We do not recommend higher lots.
And we do not recommend broker. When run our robot, please test wit

Choose the best trading tool: The impact of news on the exchange rate of a currency pair! As a news source you can use: Terminal calendar or Investing.com website In the second case, you will additionally need the Get News5 utility. The indicator combines well with the Trade maker utility, providing multi-currency trading. Calculates: indices of the impact of current news on currency pairs, taking into account market expectations. actual trend directions for 5 customizable timeframes and levels

Elasticity - it is a Secure Automated Software for trade Forex market and indices.
This EA modifies the distances depending on the market situation, being able to shorten or increase the distances depending on how the algorithm reads the market.
The system operates market breaks. Looking for the market point of greater efficiency ris/ benefit , to minimize the risks of margin call. The system uses two different algorithms, one to follow the trend and the other to operate market pullbacks

Inside Bar IndicatorInside Bar is a very popular candlestick pattern.
Inside Bar indicator can be used to trade Forex, Stocks, Indices, Futures, Commodities and Cryptos.
The Inside Bar indicator will search for inside bar candles pattern in the chart and will generate display them.
The indicator is also able to generate alerts in your screen or sent to your phone.
Inputs of the indicator are:
Symbol: type of char symbol to be displayed in the chart to show Inside Bar patterns CustomCode:

JUST EURUSD M5 !!
That´s it! Just attach this EA to EURUSD M5 Chart and let it trade yourself. Based on a particular strategy, this EA follow trends and trades according to it. You can configure some parameters, such as lot size, magic number, spread, number of opened orders, takeprofit, stoploss, trigger filter, trade out system and a calendar trade filter. Takeprofit and Stoploss can be fixed in points (10 x pips). Please PM if you have some doubt.

It's a multi-symbol and multi-timeframe scanner for our indicator - ACB Breakout Arrows . With default settings, it scans for the buy/sell signals on 28 currency pairs and 9 time-frames concurrently.
Features
It can scan 252* combinations of symbols and time-frames from a single chart. Open the signal's chart loaded with a predefined template with a single click. Easy drag n drop anywhere on the chart. Real-time alerts with popup, sound, push-notifications and email alerts.
Input Para

This EA is based on momentum strategy. It passed 10 years backtest without huge dropdown and profitable. From today your money does not sleep and rise every week. Advantage:
- Always trade with stoploss
- Stable
- No grid martingale
- No scalper We recommend with following settings. Symbol : US100
Period : 1H
UseDynamicStoplose: true Lot: recommend following rule: 100usd - 0.01 lots
1000usd - 0.1 lots or lower
2000usd - 0.2 lots or lower
10000usd - 1 lots or

The utility is designed to save funds on your trading account. There is support for three levels of minimum equity and free margin. For each level, you can set partial (by a certain percentage) or complete closing of all market orders. The partial close percentage is applied for each order separately based on its current size (i.e. the size at the time the equity or free margin reaches the appropriate level). Upon reaching the last third level, the utility can close all charts, which will make i

· Bandas Bollinger & RSI En este producto se utiliza una estrategia de trading con uno de los indicadores comúnmente utilizados en el mercado, esto en conjunto con una sólida experiencia del mercado en la que se observa el posible cambio de tendencia debido al toque de las bandas bollinger. A su vez tiene que fijarse en el indicador RSI. Por otro lado, el Take Profit así como el Stop Loss no tendrán que posicionarse ya que el algoritmo viene diseñado para que el Take Profit se fije en

At first, I got my teeth into Phoenix Ultra Expert Advisor.
This Expert Advisor will support automatic close order if the direction is correct and perform recovery if the direction is wrong. If you enter an order: 1. The price goes in the right direction and hits the Min Profit Point , trailing stop 20% of the current profit. 2. The price goes in the opposite direction, the Expert Advisor will place the order with the volume is Recovery Volume Percent at the input, the distance to enter
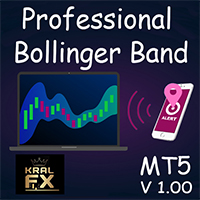
KF-BB
Professional Bollinger Bands with Alert.
Bollinger bands available in the market are mostly drawn based on simple moving average . KF-BB is the first bollinger bands that can draw the center line using all the usual methods simple , exponential, etc. A very professional indicator, it does not end here other advantages of this indicator include creating an alarm on the desktop and the mobile phone When the candlesticks hit one of the center lines or the upper and lower bands
Features in

Element is a Forex arrow indicator that implements a kind of technical analysis based on the idea that the market is cyclical in nature. Follows the market trend with good reliability, ignoring sharp market fluctuations and noise around the average price. Thus, all intersection points will be optimal points at which the movement changes taking into account the indicator period. It catches the trend and shows favorable moments of entering the market with arrows. Displays signals simply and clear

The Signal Sunrise channel indicator automatically builds a trend movement support channel. The price is in its trend movement in a certain range, and not a chaotic spread of the price is unclear in which direction. And if the price deviates within a certain range, then this means that the boundaries of these ranges are support and resistance lines and form a channel.
It is no secret that the wave theory, like many others, is based on observations, however, one of the most important patterns

Fixation of the Result is a trend indicator, a technical analysis tool that helps determine the exact direction of a trend: either an up or down price movement for a trading pair of currencies. This indicator, although a little late, is still the most reliable signal that a trader can safely focus on. Determining the market trend is an important task for traders.
The indicator is used in the forex markets. One of the main definitions for monitoring the currency market is a trend, which is why

Passage Victorious is a handy tool, and even if you are used to trading on a clean chart, sometimes you need to take a look at this indicator. If you are not sure how to determine the trend inflection point and are concerned about how to draw trend lines then this indicator is for you. From now on, you do not need to sit near the computer and analyze the price, just use this indicator.
The indicator calculates saturation levels of the price chart. A signal to exit the oversold area is a buy s

XP Trade Copier Copy From MT4 to MT4 Copy From MT4 to MT5 Copy from MT5 to MT5 Copy from MT5 to MT5 Note: You need to purchase the MT4 version to be able to copy from/to MT4 from/to MT5.
COPIER SETTINGS · Working Mode: There are 2 options: Provider and Follower. o Provide: In Provider mode the EA sends the trades to the follower. o Follower: in Follower mode the EA receives the trades from the provider. · Copier Identifier: You can use multi-instances from the EA as Provi

L'indicateur "JAC Trend Color Candle" pour Meta Trader 5, a été créé pour faciliter visuellement la tendance pour le trader. Il est basé sur trois paramètres, qui identifient la tendance haussière, la tendance baissière et le marché sans tendance. Les couleurs sont configurables par le commerçant, et le commerçant moyen également. les paramètres de tendance ne peuvent pas être configurés car ils sont le différentiel de l'indicateur.

1. What is this This is a tool used to display the balance curve in real time. The historical orders of the MT5 software are only tabular, and it looks troublesome when you have a lot of orders. This program can draw your historical trading orders in the form of a capital curve graph. This way you can see at a glance how well you are trading and where you are going wrong. At the same time, although the MT5 strategy backtest has a capital curve, it does not match the price one by one. So it is v
The indicator, Support and Resistance Detect Signal automatically detects support and resistance levels and trend lines, emitting a signal whenever the condition is met, as configured.
It reads support and resistance drawn manually or automatically built into the chart by other external indicators.
Note: Support and Resistance Detect Signal is compatible with almost all external indicators that draw on the chart, support and resistance levels, in addition to trend lines.
Discover
The indicator, Support and Resistance Detect Signal automatically detects support and resistance levels and trend lines, emitting a signal whenever the condition is met, as configured.
It reads support and resistance drawn manually or automatically built into the chart by other external indicators.
Note: Support and Resistance Detect Signal is compatible with almost all external indicators that draw on the chart, support and resistance levels, in addition to trend lines.
Discover our Elit
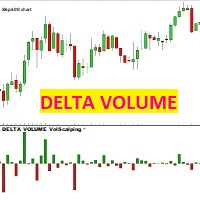
VOLUME DELTA Volscalping Cet indicateur, pour chaque bougie de prix, dessine une bougie Delta, qui est la différence entre les contrats achetés et vendus. La bougie sera rouge et négative si les contrats négociés dans l'offre (vendus) dépassent ceux dans la demande, au contraire, la bougie sera verte et positive si les contrats négociés dans l'ASK (achetés) dépassent ceux dans l'offre.
ATTENTION : L'indicateur ne fonctionne qu'avec des courtiers qui fournissent un flux de données de marché r
An imbalance indicator that marks imbalance on the chart with zones and gives the amount of imbalance as an oscillator value. There's one line for the amount of short imbalance, one line for the long imbalance and the combined imbalance as a thicker line. The combined imbalance goes above 0 if there's more imbalance above than below the current price and vice versa. The blue thicker line, shows (imblance above - imbalance below). The greeen dotted line shows imbalance above The red dotted line s

Dear users, January will be the last month that I will keep LL Gold Miner EA for sale at the price of $45 . From next month I will update the prices bringing the lifetime license to $250 , in order to guarantee the exclusivity of the strategy . However I will unlock the ability to rent the EA for 1/3/12 months while keeping the prices reasonably lower. So this really is your last chance to secure your lifetime copy of this fantastic strategy at this price . Don't miss the opportunity. Thank you
Savez-vous pourquoi MetaTrader Market est le meilleur endroit pour vendre des stratégies de trading et des indicateurs techniques ? Pas besoin de publicité ou de protection logicielle, pas de problèmes de paiement. Tout est fourni dans le MetaTrader Market.
Vous manquez des opportunités de trading :
- Applications de trading gratuites
- Plus de 8 000 signaux à copier
- Actualités économiques pour explorer les marchés financiers
Inscription
Se connecter
Si vous n'avez pas de compte, veuillez vous inscrire
Autorisez l'utilisation de cookies pour vous connecter au site Web MQL5.com.
Veuillez activer les paramètres nécessaires dans votre navigateur, sinon vous ne pourrez pas vous connecter.