Watch the Market tutorial videos on YouTube
How to buy а trading robot or an indicator
Run your EA on
virtual hosting
virtual hosting
Test аn indicator/trading robot before buying
Want to earn in the Market?
How to present a product for a sell-through
Expert Advisors and Indicators for MetaTrader 5 - 106

EQUITY DRAWDOWN MONITOR This is a simple mt5 advisor that monitors the drawdon levels Features:
Easy to use Useful for money managers How to Use Load the EA once a single chart Type the maximum drawdown desired in inputs
Leave the EA alone and never close that chart The EA monitors all trades and magic numbers in your account.
Input Parameter Drawdown Percent: Maximum drawdown in percentage terms allowable in the account. When the drawdown level is surpassed, the EA will close all tra

You can think of these indicators as moving pivot points. MasterChartsTrading Price Action Indicators show good price levels to enter or exit a trade. The Blue indicator line serves as a Bullish Trend setter. If your instrument closes above the Blue line, we think about going Long (buying). When your trading instrument closes below the Red line, we think about Shorting (selling). It is very easy to read price action if you have a reference point. These support/resistance lines are there to help
An indicator of patterns #37 and #38 ("Rectangle Tops" and "Rectangle Bottoms") from Encyclopedia of Chart Patterns by Thomas N. Bulkowski. Parameters: Alerts - show alert when an arrow appears Push - send a push notification when an arrow appears (requires configuration in the terminal) PeriodBars - indicator period VertexCount - the number of tops and bottoms: 2, 3, 4. ArrowType - a symbol from 1 to 17 ArrowVShift - vertical shift of arrows in piхels ShowLevels - show levels ColUp - colo
In order to detect "Big activity", new elements of the VWAP standard indicator were incorporated into this project.
In short, the plotted lines represent the moving average with EMA[VWAP]=VWAP[EMA].
Averages of the prices have been combined with volumetric weights and exponential decay.
Also, it was included the same weights to compute the standard deviation.
The parameter called as "strain" is a linear constant shifting the result (strain)xSD(VWAP).
So, a any set of bands can be plotted.

DYJ Tradays Economic Calendar is calendar Indicators of macroeconomic events for fundamental market analysis. Therein you will find financial news and indicators for the largest global economies – from the US and the EU to Australia and Japan, a total of 23 economies, involving more than 60 currency pairs. More than 800 macroeconomic indicators and events are collected from public sources in real time. Historical, current and forecast values, as well as importance characteristics are available

(Crypto Currency Charts) It brings the history as much as the number of bars you specify and starts to show the instant data directly. Provides the opportunity to work in all time frames. Allows you to work with multiple symbols. This app is a background service.
It downloads the history of all symbols starting with "F" on the market watch screen and shows the ticks data.
Automatically transfers real-time trading data of Binance Futures to MT5.
Run the script in the link to use the progra
An indicator of patterns #11 and #12 ("Diamond Tops" and "Diamond Bottoms") from Encyclopedia of Chart Patterns by Thomas N. Bulkowski. Parameters: Alerts - show alert when an arrow appears Push - send a push notification when an arrow appears (requires configuration in the terminal) PeriodBars - indicator period K - an additional parameter that influences the accuracy of pattern shape recognition ArrowType - a symbol from 1 to 17 ArrowVShift - vertical shift of arrows in pixels ShowLevels - s
An indicator of patterns #39 and #40 ("Rounding Tops" and "Rounding Bottoms") from Encyclopedia of Chart Patterns by Thomas N. Bulkowski. Parameters: Alerts - show alert when an arrow appears Push - send a push notification when an arrow appears (requires configuration in the terminal) PeriodBars - indicator period K - an additional parameter that influences the accuracy of pattern shape recognition. Changes from 0 to 1 ArrowType - a symbol from 1 to 17 ArrowVShift - vertical shift of arrows
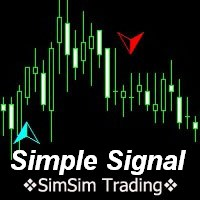
MT5 trend indicator works without redrawing. Provides signals for entering trades, works on charts of any instrument. Трендовый индикатор МТ5, работает без перерисовки. Выдает сигналы для входа в сделки, работает на графиках любого инструмента. Input parameters are for styling and messages only. / Входные параметры только для оформления и сообщений. All original signal calculations do not need additional parameters. / Все оригинальные расчеты сигнала, не нуждаются в дополнительных параметрах.

The robo t opens a buy or sell position using the signs.
Know our products
Position openings are based on the parameters identified as signals, if you activate all the robot will issue a trading order only if the number of signals is greater than the minimum stipulated by the user.
The filters are used to increase the accuracy of the signals and if activated and not met your criteria, the order is not sent.
EA also offers MOBILE STOP with the Parabolic SAR indicator and also by dis

Let the KING trades!!!
KING of TRADES is a trading system that can be optimized according to: - Trend indicator: Ichimoku Kinko Hyo (either in different timeframe) - Trigger system: Fractals - Filter - trade in: Stochastic Oscillator (values and upper and lower limits) - Stops definition: ATR (period and long and short takeprofit and stoploss) - General: magic number, autolot (% balance), symbol digits, max spread and max number of openned orders Default configuration on EURUSD, H1.
An indicator of pattern #49 ("Triangle, symmetrical") from Encyclopedia of Chart Patterns by Thomas N. Bulkowski. Parameters: Alerts - show alert when an arrow appears Push - send a push notification when an arrow appears (requires configuration in the terminal) PeriodBars - indicator period K - an additional parameter that influences the accuracy of pattern shape recognition ArrowType - a symbol from 1 to 17
ArrowVShift - vertical shift of arrows in pixels ShowLevels - show lines ColUp - c
All words I spent time to describe this EA trading system does not worth a download that you can do to test this expert advisor.
MC Datrix EA is a trading system that combines trend filter, trigger points with specific conditions, smart takeprofit and stoploss calculations, a break orders system based on smart reversal trend.
Trend filter was developed with TRIX indicator and also can be enabled or not.
Trigger points were specially projected with MACD indicators values and signals. Tr

The trend allows you to predict the price movement and determine the main directions of the conclusion of transactions. The construction of trend lines is possible using various methods suitable for the trader's trading style. This indicator calculates the parameters of the trend movement based on the von Mises distribution. Using this distribution makes it possible to obtain stable values of the trend equation. In addition to calculating the trend, the levels of possible deviations up and dow
An indicator of patterns #47 and #48 ("Triangle, ascending" and "Triangle, descending") from Encyclopedia of Chart Patterns by Thomas N. Bulkowski.
Parameters: Alerts - show alert when an arrow appears Push - send a push notification when an arrow appears (requires configuration in the terminal) PeriodBars - indicator period K1 - an additional parameter that influences the accuracy of pattern shape recognition K2 - an additional parameter that influences the accuracy of pattern shape recogn

This Expert Advisor is a Combination of Averaging & Martingale.
1. Trend : to define what position the EA should Trade - LONG SHORT ( EA will open both BUY and Sell ) - LONG ONLY ( EA will only open BUY ) - SHORT ONLY ( EA will only open SELL ) 2. Distance between Each Positions - Point value of each Positions 100 : - if 100 Points reached between the last position and current price, new Position will be open by EA - EA will set up a higher volume for this new Position - new TP calculated u
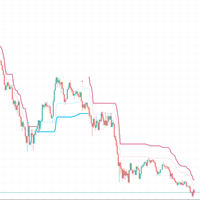
Using ATR to judge the trend, the dotted line is a short-term trend, and the solid line is a stable trend
Set different parameters according to different products. In most cases, please use the default parameters
Time cycle 5 minutes 15 minutes 1 hour
This indicator performs well in monetary products and gold
Index without future function
The entity part of the K line exceeds the entity trend part, which represents the trend conversion. Please wait for the K line to finish

Indicator works with two moving average, when this moving averages cross, then change of colors. You can change the color both moving average and chage all setup if you want, like a native moving average . If you want to put this indicator, all buffers are disponible and their are work fine. In case of doubt or any question don't exitate to write me, I'll read and aswer all the question.

" A successful trading means being able to master the art of timing, the art of execution and the art of protecting your capital in a very simple and faster way ". HermanGhost Manager is the most powerful tool that's actually designed to help you win in terms of executing different operations BUY,BUY STOP, BUY LIMIT, SELL,SELL STOP, SELL LIMIT, STOP LOSS, TAKE PROFIT, BREAKEVEN, TRAILING STOPS, all can be executed in seconds.
features : The intuitive interface One time configuration One click
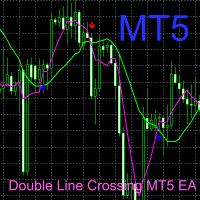
This is based on the double moving average cross and arrow mark under the preparation of custom indicators EA.
When the blue arrow appears, make a long order.
When the red arrow appears, short the order.
When the pink line crosses the green line upward, the pink line is above, the green line is below, the golden fork appears, and the blue arrow appears.
When the pink line crosses the green line downward, the pink line is below and the green line is above. There is a dead fork and a red
Arielfx Smart Money Imbalance Indicator
What is Imbalance? imbalance noun: Lack of proportion or relation between corresponding thing
We Use Imbalance as a part of our trading system. When an imbalance is filled or price comes into it we often see big reactions and moves from those areas!
How can you use it?
You can take a trade an scalp reactions off of imbalance zones

The indicator Supply Demand RSJ PRO calculates and plots the "Supply" and "Demand" zones on the graph, identifying the type of Zone (Weak, Strong, Verified, Proven) and in case of retests of the Zone it shows how many times it was retested. "Supply" Zones are the price zones where more supply than demand has occurred, driving prices down. "Demand" Zones are the price zones where more demand than supply has occurred, pushing prices up.
Classification of zones
Weak: Price region which, if re-te

Monkey Springs EA is an expert advisor that analysis two moving averages difference (stretch) . It´s possible to trade on trend or reversal. It´s possible to configure each moving average and its difference value - stretch, as soon as a stochastic and OBV filter . Takeprofit and stoploss are configured according to a percent of the moving averages difference. A trail system can also be configured, according to moving averages and stochastic. It´s also possible to configure a average

//////////////////////////////////////////////// ////////////////////////////////// This indicator uses polynomial regression to plot three channels and six lines accordingly. The first channel and its borders with a large period, the second with an average and the third with a small period. The setup is simple - you only need to specify the colors and enable / disable the display of price labels. It is also very easy to understand the readings of this indicator. Channel lines are used to set s

With my custom built formula, you can visualize the market similar to displaying a heat map; with color showing at a glance the strength of the current trend, and the bar length showing the intensity of current movement. In more detail: Length of the histogram bar shows the average bar size of the last period, and color (from red to blue) shows the strength of upward or downward movement. Purple zones can indicate a change into a new trend. Bar period is adjustable so as to measure larger or sm

ScalpJumping July 50% OFF Hey, haven't you tried it yet? What are you waiting for???? Try yoursef. It is a buy scalper robot with a recommended risk of 6%.This is not magic, it works well in a bullish context. you can do a back test yourself and check its operation. It is a multi-currency robot although it was tested with greater success on the EURUSD pair. Recommendations: currency EURUSD, timeframe 5M, Stop Loss 60, Take Proffit 60, Trailing Stop 0, Dynamic Lots true although you can tes

*** Comece a negociar AÇÕES na bolsa brasileira de forma automática ***
O Samurai Canarinho EA é um robô de negociação para Ações na B3 - bolsa brasileira Bovespa. O robô opera conforme tendência, com base no indicador Ichimoku Kinko Hyo , de acordo com sua dinâmica. Os alvos de Takeprofit e Stoploss podem ser configurados conforme a Banda de Bollinger . É possível configurar também um sistema de trail, conforme a dinâmica da Banda de Bollinger. Um percentual configurável pode ser esta

This scalper helper helps you manage your trader by placing AUTOMATIC stops and takes. When you enter a position and the market quickly turns against you, it's pretty boring isn't it? but with this helper your StopsLoss and TakeProfit will be AUTOMATIC, just configure how many pips you want and that's it. Besides, the helper has AUTOMATIC BreakEven, you just choose the amount of pips you want to place, and finally it contains a stop protector, whenever a candle closes in profit in your favor, it

*** NOVIDADE: Takeprofit e Stoploss com valores fixos em pontos ***
*** Comece a negociar na bolsa brasileira de forma automática ***
O Ichimoku Ninja EA é um robô de negociação para Mini-Índice (WIN) e Mini-Dólar (WDO) , negociados na bolsa brasileira Bovespa. O robô opera conforme tendência, com base no indicador Ichimoku Kinko Hyo , de acordo com sua dinâmica. Ainda, os alvos de Takeprofit e Stoploss podem ser configurados conforme valores fixos ou a Banda de Bollinger , de acordo com o

Markets really love round numbers and they often act as support in a falling market, or resistance as price rises. This indicator is designed to draw price levels at Round values. It does this automatically, but you also have the option to override that and determine the levels you wish to see. A round level can be as simple as steps of 10, so 10, 20, 30 etc or if you are working with Forex, maybe you want to see changes at 0.1 or 0.01. The indicator draws two classes of line, Major and Minor,

Find My Rules It is an fully custimizable Expert Advisor. You can choose multiple parameters that act as a trigger to execute a buy or sell order. The parameters available to configure to your liking are: lots, stop loss, take profit, dynamic lots, order type,timeframe. Indicator combinations for triggering orders and for preconditions (two factors) are: RSI, EMA1, EMA2, EMA3, EMA4,MACD. INPUTS PARAMETERS: OPERATION OPTIONS magic number = number for identification lots = lots for operati
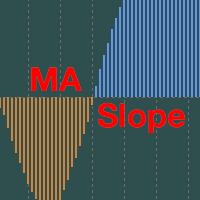
Moving Average Slope for MT5 is an indicator which displays the Slope of a Moving Average . Finding the Slope of a Moving Average is a great way to determine trends and ranges of the market. Moving Average Slope can be used for manual trading or built into an Expert Adviser for automated trading. It is presented as a histogram which you may change the colors for positive and negative results. Positive results indicate an upward trend of the market.
Negative results indicate a downward trend of

This indicator creates the perfect RENKO for you to work with timeless types of Candles! Due to RENKO characteristics of timeless, the indicator adjusts trading arrows (otherwise they would be lost) and leaves them exactly where the negotiation occurred in Renko Candles! In addition, this indicator shows exactly the division between days, in order to make it clear to user where each trading session started and ended! Furthermore, the following indicators were added, giving you bigger analysis p

A ‘Supertrend’ indicator is one, which can give you precise buy or sell signal in a trending market. As the name suggests, ‘Supertrend’ is a trend-following indicator just like moving averages and MACD (moving average convergence divergence). It is plotted on prices and their placement indicates the current trend. The Supertrend indicator is a trend following overlay on your trading chart, much like a moving average, that shows you the current trend direction. The indicator works well in a tren

Two Factor Customizer is an fully custimizable Expert Advisor. You can choose multiple parameters that act as a trigger to execute a buy or sell order. Additionally you can choose a previous step (Two Factor), where you can also combine multiple parameters previous to those configured for the buy and sell orders. The parameters available to configure to your liking are: lots, stop loss, take profit, dynamic lots, order type,timeframe. Indicator combinations for triggering orders and for precondi

Hello!
Tired of constantly subscribing to other people's signals and earning pennies?
Want to manage your own trading?
Then you are on the right page!
It's very simple ==> buy my indicator ==> put it on the chart ==> blue arrow - buy ==> red arrow - sell. Even an infant can do it!
A handy histogram to trace the market direction.
Are you still here? Then read the parameter descriptions and take a look at the screenshots: Stoch K period - period for calculating the% K oscillator line.
MAs Crossover Dashboard Pro uses the value of Moving Average indicator. The periods of 2 MAs can be adjusted via the Edit boxes of this dashboard. The monitoring pairs will be selected by adding to the Market Watch (no need to set prefixes or suffixes) , you can monitor many pairs as you like. This dashboard will check almost popular time frame (M1,M5,M15,M30,H1,H4 and D1). The colors can be customized. The parameter of MAs can be set at the input. Crossover signal can be sent to you screen, yo

Aggression Wave PRO is an indicator developed to monitor the divergence, strength, and continuity of the aggression volume of sell and buy negotiations. The Agrression Wave PRO has features that allow you to view beyond the accumulated delta volume of the day.
Note: This indicator DOES NOT WORK for Brokers and/or Markets WITHOUT the type of aggression (BUY or SELL). Cryptocurrencies and Forex do not provide this type of information, that is, it does not work with it.
Operation
It is pos

You can easily draw horizontal ray line for the open, high, low and close price levels of any candle with this indicator. Parameters Mode Key + click - you should press o, h, l or c keys on the keyboard first, then click on any candle. Mouse hover + click - just move your mouse and point to any candle, then press o, h, l or c keys on the keyboard. Note: in both modes, you should point the horizontal center of the candle for accurate selection. The vertical position of the pointer is irrelevant.

Put to work now Two brother AU11 this incredible EA was carefully made and tested for the AUD / USD market exclusively in the 5m time frame, the purpose of this EA is to keep your capital safely behind this incredible EA and your account never reaches to $ 0.
This EA can be used with little capital $ 100, I have tested it with $ 50 and it works perfectly but it is advisable to start with a minimum of $ 100, I recommend using a VPS. You can also work a higher capital, you just have to raise th

Put to work now Two brother EJ12 this incredible EA was carefully made and tested for the EUR / JPY market exclusively in the 5m time frame, the purpose of this EA is to keep your capital safely behind this incredible EA and your account never reaches to $ 0.
This EA can be used with little capital $ 100, I have tested it with $ 50 and it works perfectly but it is advisable to start with a minimum of $ 100, I recommend using a VPS. You can also work a higher capital, you just have to raise th

MACD Intraday Trend PRO is an Indicator developed through an adaptation made of the original MACD created by Gerald Appel in the 1960s. Through years of trading it was observed that by changing the parameters of the MACD with Fibonacci proportions we achieve a better presentation of the continuity of the trend movements, making that it is possible to more efficiently detect the beginning and end of a price trend. Due to its efficiency in detecting price trends, it is also possible to identify ve
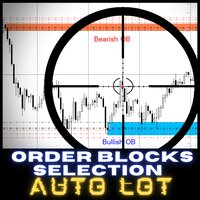
ONLY 4 COPIES FROM 10 TO $60 NEXT PRICE $95 Order Block Selection AUTOLOT is a great tool for all those traders who like to have control in their hands and especially to operate with high precision, thanks to our new control panel you will be able to select the candle where you want to choose the Bullicsh OB zone o Bearish OB
The objective of this Expert Advisor is that you can select Bullish Order Blocks (shopping area) or Bearish Order Block (sales areas) at any time, it will have 3 input

Pivot levels are a well established technical level that's recognised in every market. This indicator will draw the current Quarterly, Monthly, Weekly, Daily and four-hourly pivots on the chart, for any symbol. You can also show the Suppport and Resistance levels for each period and choose which to display from levels 1 to 4. Choose the type of Pivot from: Standard Camarilla DeMark Woodie Fibonacci Please note, DeMark pivots have a single Support and Resistance level as per the original specif

This expert is best when running on GBPUSD M30 and is designed to give consistent mid/long term revenues. It doesn't use any dangerous strategies as martingale or grid trading. All orders are protected by a stoploss and the money management feature allows to protect the account balance. This expert also includes a sophisticated time management system to target best times to trade. This EA is not a scalper and will be less affected by slippages and spreads from brokers. It will trade less than a
The ease of observing the market anytime, anywhere
Exchange chart is the software for the professional trader to follow what happens in the financial market in real time. Developed by those in the market, it keeps up with the latest research on successful traders who show that the best, the ones who get consistent results use few types of chart configurations, in several different symbols.
All market watch passing through your chart
Exchange chart makes all the symbols configured by you in
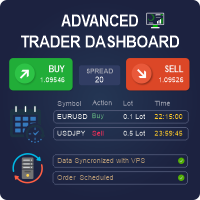
Powerful and beautiful trading panel helps you in scheduling or placing multiple trades based on your presets in a single click. It is designed to execute orders immediately or schedule trades in advance to be executed at certain time using multiple filters to avoid non favorable market conditions (wide spread, reduced leverage etc.). Additional functionality developed to sycnhronize two instances of the expert over the internet (Master - Slave Mode), which means trader can open the panel in loc

This indicator shows on the current day some lines of interest, such as maximum, minimum and closing of the previous day, as well as the opening, maximum and minimum price of the current day.
It can also show the GAP (closing of the previous day and opening of the current day) and projections of the amplitude of the previous day, according to the value you choose in the multiplier.
Oh, I was going to forget. It is also possible to determine the time frame, which is daily by default.
If th

Simple Schaff Trend Cycle System. Configurable number of trades openened on trigger. Choose to include a trade which has no Take Profit but closes with trailing candles high/lows. Trades are always opened above/below the prev. closing candle (see pending pips) RSI and EMA as a bias/confirmation. Use the strategy tester to get your own setup per market. Use of fixed fibnumbers won't let you over-optimize. Best to be used 1H / 4H depending on market. It will mark any trade with a vertical red/gre

Simple Ichimoku Cloud break system. Configurable number of trades openened on trigger. Choose to include a trade which has no Take Profit but closes with trailing candles high/lows. Trades are always opened above/below the prev. closing candle (see pending pips) RSI and EMA as a bias/confirmation. Use the strategy tester to get your own setup per market. Use of fixed fibnumbers won't let you over-optimize. Best to be used 1H / 4H depending on market. It will mark any trade with a vertical red/g

Rice Martingale is an EA, which uses the Martingale algorithm with a low DD rate (not for XAUUSD, not TimeFrame M1) Rice Martingale can open two sides: buy and sell at the same time. We can set the maximum number of orders, the number of Martingale, and the number of the first orders. Especially, if the number of orders reach the point that users want to start the risk parameters, Rice Martingale can manage risks. It will cut loss at the point of the nearest average price which users set befor

Túnel de Vegas, com até 20 níveis, permitindo plotar ou não cada nível com troca de cor, espessura das linhas e visualização ON/OFF para facilitar a utilização.
Recomendado a utilização para timeframes:
Original --> H1
Fractais --> M15, M30, H4, D1 e W1 Teste em Gráfico W1 apresentando consistência.: https://www.mql5.com/pt/signals/2211259 Acompanhe os resultados no meu sinal:
https://www.mql5.com/pt/signals/2211259
Tiago Lacerda Telegram: @tfmlacerda
E-mail: mediador@gmail.com
Yo

Indicator of trend deviation with a static level. The deviation coefficient is set for the trend histogram. Signals are the intersection of the level trend histogram in the direction of the trend or during a trend reversal - the option is selected in the indicator settings by the "Revers" parameter. There are all the necessary settings for the design of the indication and sending messages to mail or a mobile terminal. All input parameters have an intuitive name. Analog for MT4: https://www.mql5.
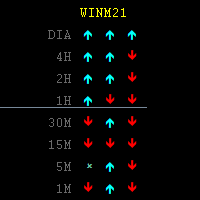
Indicador visual que mostra a direção de um ativo em diferentes times frames. Acompanhe em tempo real a variação de direção dos preços nos últimos 3 candles. É possível escolher o ativo a ser mostrado e quais times frames deseja acompanhar. Excelente para operações Day Trade. Facilita a visualização de vários times frames auxiliando assim na tomada de decisão rápida. Parâmetros de fácil configuração.
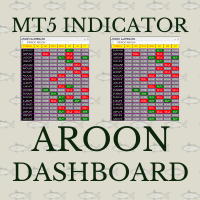
Aroon crossover Dashboard uses the value of Aroon indicator. The Aroon period can be adjusted via the Edit box of this dashboard. The monitoring pairs will be selected by adding to the Market Watch (no need to set prefixes or suffixes) , you can monitor many pairs as you like. This dashboard will check almost popular time frame (M1,M5,M15,M30,H1,H4 and D1). The colors can be customized. The Aroon indicator has been included in to this Dashboard, you do not need purchasing it. Crossover signal c

Entry and exit signals from the Double 7's Strategy by Larry Connors in his book "Short Term Trading Strategies That Work".
Larry claims this strategy predicted the market's direction over 80% of the time since 1995. Picking up the gains and being exposed in the market less than 25% of the time. Good for swing trading on Daily charts of SPY, Nasdaq, China's FXI, Brazil's EWZ and the majority of the equity ETFs and World Indices.
How does it work? The indicator activates the buy signal when

DYJ TradePanelMT5 allows you to perform trading operations ,opening market positions, placing pending orders, removing pending orders, and closing all positions When you use the "DYJ TradePanelMT5" to make a mistake in the direction of manual trading, you can cooperate with our remote order rescue service to turn the order back into profit. Parameters
Volume = 0.01 - - default volume; InpTP = 1200 -- default takeprofit POINTS; InpSL = 600 -- default stop loss POINTS; InpStep = 200 --

Binance is a world-renowned cryptocurrency exchange! In order to facilitate the real-time data analysis of the encrypted digital currency market, the program can automatically import the real-time transaction data of Binance Futures to MT5 for analysis. The main functions are:
1. Support the automatic creation of USD-M futures trading pairs of the Ministry of Currency Security, and the base currency can also be set separately. The base currency BaseCurrency is empty to indicate all currencies

Binance is a world-renowned cryptocurrency exchange! In order to facilitate real-time data analysis of the encrypted digital currency market, the program can automatically import Binance real-time transaction data to MT5 for analysis. The main functions are:
1. Support the automatic creation of spot trading pairs in the currency security department, and you can also set the profit currency and base currency separately. For example, if ProfitCurrency is empty, it means all trading areas, optio

Session Control session indicator. Depending on from which continent the trading activity takes place in a certain period, the entire daily routine is divided into several trading sessions.
Due to the fact that at each separate time interval exchange and banking platforms from different parts of the world are connected to the trading process, and the Forex market operates around the clock.
There are 4 main trading sessions:
Pacific. European. American. Asian.
This indicator allows you t

Binance is a world-renowned cryptocurrency exchange! In order to facilitate more accurate analysis of the encrypted digital currency market, the program can automatically import Binance’s futures K-line data to MT5 for analysis. The main functions are:
1. Support the automatic creation of all futures trading pairs on Binance USD-M, or you can set the base currency separately. For example, if the base currency BaseCurrency is empty, it means all currencies, and any cryptocurrency supported by

It's a DYNAMIC PERIOD indicator which identifies best ENTRY PRICE in the direction of main trend. It's completely non-repaint indicator and very simple to use.
Each arrow has a specific impact value from 1 to 10. Basically there is no important difference between impact numbers. The main point is: A higher impact value means that signal is generated from a bigger swing.
When it draws a Buy arrow on a bottom, It means that we had a Trend, A correction, And now this bottom is a reliable trigger

DESCRIPTION The ‘No Open Trades’ Expert Advisor is a dream come true to any mindful trader that knows that controlling risk is extremely vital to any successful trading plan. The ‘No Open Trades’ Expert Advisor closes all open trades in the account once the percentage loss you set is met. For example, if your account balance is $5,000 and you set the percentage loss to 5. This information has been passed to the Expert Advisor and it will close all open orders once the loss made is -$250 (which
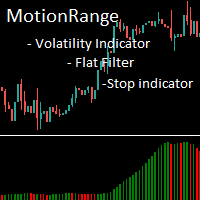
MotionRange - индикатор волатильности цены.
Индикатор не показывает направление движения цены и предназначен для наглядной демонстрации наличия трендового движения, силы тренда, ускорения и замедления трендового движения. Индикатор можно использовать для: - фильтрации флэтового состояния рынка, - открытия позиций в момент начала тренда, - закрытия позиций в момент замедления или остановки тренда.
У индикатора один входной параметр - Calculation Period. Это количество сравниваемых свечей
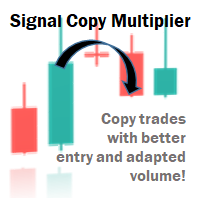
Signal Copy Multiplier automatically copies trades on the same account, for example, to get a better entry and adjusted volume on a subscribed signal. MT4-Version: https://www.mql5.com/de/market/product/67412 MT5-Version: https://www.mql5.com/de/market/product/67415 You have found a good signal, but the volume of the provider's trades is too small? With Signal Copy Multiplier you have the possibility to copy trades from any source (Expert Advisor, Signal, manual trades) and change the volume

TRADING STRATEGY
Keep It Simple and Smart (KISS principle) and not stupid! This automatic expert advisor enters a trade in the DOW JONES exactly at 9 a.m. EST i.e. 30 minutes before US market open to make 10 points in profit for a continuous income stream. This is a professional trading strategy and not a get-quick-rich scheme. The trade direction (long or short) is determined by a simple algorithm based on every day market observation and thorough backtesting. For all trades to win (since 1

目前全额购买折扣 中 ! 任何交易者的最佳伙伴! 该指标具有独有的支撑阻力计算方案, 是独一无二的交易系统 。 指标特性 想象一下,如果您能提前精确的判断出重要的交易支撑阻力区域以及点位, 您的交易将如何改善?基于独特的计算方式,我们可以看到波段走势中清晰的支撑和阻力。将过去重要的支撑阻力区域经过独特的计算,将关键位置在图表中显示. 本指标支持周期设置,可以设置其他周期. 大周期重要支撑阻力,以及小周期辅助判断可以在同一图表中完成.
基本显示 显示支撑阻力的价格标签。 显示实时的支撑和阻力。 显示历史的支撑和阻力.
基本设置 设置支撑阻力计算的周期 。
警报设置 接近报警 碰触报警 报警弹窗 报警邮件发送 发送推送警报 颜色设定 可以设置不用的实时支撑阻力颜色 可以设置不用的历史支撑阻力颜色 可以设置价格标签颜色 可以点击价格标签或者点击显示区域改变区域填充方式 任何问题,相互交流
Currency Chart is a MT5 overlay indicator for 8 major currencies including AUD, CAD, CHF, EUR, GBP, JPY, NZD and USD. The chart represents one currency average prices relative to the others. The currency chart makes us easy in evaluate direction, trend, strength, support and resistant levels or even a reversal level of the currency. Good for medium-term and long-term trading styles. Chart type: Candlestick chart, bar chart or line chart. Chart timeframe: Same as MT5 timeframe. Built-in indicator

Baze Zone is a configurable combination of tools/levels (MT4 version also available at MT4 section): - Fib levels, 14, 23,50 - Fib Extension 27,61 - Pivot Points - Adds boxes to indicate range 'breakout' - ATR Range - Prev Daily Candle Range - Shortcut keys to hide/show the lines (configurable) In short, use this tool to add some extra zones to you fib tool. And use the extra's in combination with the shortcut keys to keep your chart clean. You can drag the lines for the Fib Levels.
The name

The indicator - "ATR Line" determines the current trend and gives signals to buy (green arrow to the top) or sell (red arrow to the bottom). The indicator calculation is based on the deviation of the average price of the instrument from its average true range - ATR. The moving average of prices is used to reduce "market noise". If the main line of the indicator - "ATR Line" is lower the instrument price chart, then the market is in a "bullish" trend. If the main line of the indicator is higher t
The MetaTrader Market is the best place to sell trading robots and technical indicators.
You only need to develop an application for the MetaTrader platform with an attractive design and a good description. We will explain you how to publish your product on the Market to offer it to millions of MetaTrader users.
You are missing trading opportunities:
- Free trading apps
- Over 8,000 signals for copying
- Economic news for exploring financial markets
Registration
Log in
If you do not have an account, please register
Allow the use of cookies to log in to the MQL5.com website.
Please enable the necessary setting in your browser, otherwise you will not be able to log in.