Regardez les tutoriels vidéo de Market sur YouTube
Comment acheter un robot de trading ou un indicateur
Exécutez votre EA sur
hébergement virtuel
hébergement virtuel
Test un indicateur/robot de trading avant d'acheter
Vous voulez gagner de l'argent sur Market ?
Comment présenter un produit pour qu'il se vende bien
Indicateurs techniques pour MetaTrader 5 - 28

L'indicateur dessine automatiquement les niveaux de Fibonacci en fonction de l'indicateur ZigZag, des sessions de trading, des fractales ou des bougies (y compris les délais non standard : année, 6 mois, 4 mois, 3 mois, 2 mois) (Retracement Auto Fibo). Vous pouvez choisir n’importe quel délai plus élevé pour le calcul de Fibonachi. Les niveaux sont redessinés à chaque fermeture de la barre actuelle. Il est possible d'activer des alertes lors du franchissement des niveaux spécifiés.
Vous pouvez

Choose the best trading tool: The impact of news on the exchange rate of a currency pair! As a news source you can use: Terminal calendar or Investing.com website In the second case, you will additionally need the Get News5 utility. The indicator combines well with the Trade maker utility, providing multi-currency trading. Calculates: indices of the impact of current news on currency pairs, taking into account market expectations. actual trend directions for 5 customizable timeframes and levels

The Point-Percent Price Channel (PPPC or PP Price Channel) indicator is designed to display on the chart a channel whose width is specified both as a percentage of the current price and in points. Its appearance is presented on slide 1. When the market moves up, the upper border of the channel is built at the price of High candles. In this case, the lower boundary follows the upper one at a strictly specified distance. When the price touches the lower border of the channe
FREE

Modification multidevises et multitemporelles de l’indicateur Relative Strength Index (RSI). Vous pouvez spécifier les devises et les délais souhaités dans les paramètres. En outre, le panneau peut envoyer des notifications lors du franchissement des niveaux de surachat et de survente. En cliquant sur une cellule avec un point, ce symbole et ce point seront ouverts. Il s'agit du scanner MTF.
La clé pour masquer le tableau de bord du graphique est "D" par défaut.
Semblable au Currency Strength

Bonjour les traders, HiperCube, je suis heureux de vous présenter un nouvel indicateur MTF MA ! Code de réduction de 25% sur Darwinex Zero : DWZ2328770MGM HiperCube Multi-Timeframe Moving Average ou MTF MA est un indicateur qui vous permet d'afficher la MA d'une période de temps supérieure à une autre inférieure, si simple.
Caractéristiques : Sélectionnez la période dans un menu déroulant MA de période personnalisée Type de MA personnalisé (EMA, SMA...) Couleur personnalisée de MTF MA Chat gpt
FREE

Bienvenue sur HiperCube VIX Code de réduction de 25% sur Darwinex Zero : DWZ2328770MGM Cet indicateur vous fournit une information réelle sur le marché du volume de sp500 / us500
Définition HiperCube VIX connu sous le nom d'indice de volatilité CBOE, est une mesure largement reconnue de la peur ou du stress du marché. Il signale le niveau d'incertitude et de volatilité sur le marché boursier, en utilisant l'indice S&P 500 comme proxy pour le marché au sens large. L'indice VIX est calculé sur l
FREE
VolumeView – Индикатор тиковых объёмов Описание: VolumeView — это визуальный индикатор, отображающий тиковые объёмы непосредственно на графике в виде горизонтальных линий разной длины. Цвет линии указывает направление свечи: Зелёный — объём на бычьей свече (цена закрытия выше открытия) Красный — объём на медвежьей свече (цена закрытия ниже открытия) Особенности: Отображает объёмы за определённое количество последних дней Поддерживает настройку минимального порога отображаемого объёма Рабо
FREE

MultiTrend Detector: System Overview The MultiTrend Detector is a comprehensive trend analysis tool that combines multiple technical indicators to identify trend direction, strength, and potential reversal points. Here's how the system works and how it can benefit traders: How the System Works Multiple Indicator Approach The system analyzes market trends using five key technical indicators: Supertrend: A volatility-based indicator that identifies the current trend direction and potential suppo
FREE

Chaikin Money Indicator (CMF) – Free Trading Indicator
The Chaikin Flow Indicator (CMF) is a technical analysis tool based on the original Chaikin Money Flow (CMF) indicator, developed by Marc Chaikin in the 1980s. It is designed to track capital flows into an asset and helps identify buying and selling pressure. This indicator is useful for both intraday trading and medium-term analysis .
How CMF Works CMF analyzes price action and volume over a given period by calculating the Money Flow Mult
FREE

Kindly rate and comment about the product for upgradation & Support
The 5 EMA is plotted in green color ( Lime ).
The 14 EMA is plotted in red color ( Red ).
The 20 EMA is plotted in blue color ( Blue ).
The 200 EMA is plotted in yellow color ( Yellow ).
The Quarter EMA that provided calculates and plots four Exponential Moving Averages (EMAs) on the chart using different periods: 5, 14, 20, and 200. Each EMA is represented by a different color on the chart. Here's a description of each EMA:
FREE

L'indicateur Spread Pulse MT5 est un outil efficace qui fournit aux traders des informations sur le spread actuel sur le graphique. Le spread est la différence entre le prix d’achat et le prix de vente d’un instrument.
L'indicateur est présenté sous forme de texte affiché sur le graphique. Cela permet au trader de suivre facilement le spread actuel.
L'un des principaux avantages de l'indicateur Spread Pulse est sa visualisation des couleurs. En fonction de la taille de la page, la couleur
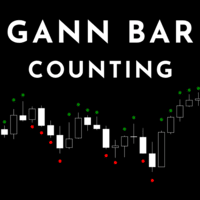
Gann Bar Counting - Identifies the Candle Sequence Description:
The "Gann Bar Counting" indicator is designed to identify bullish and bearish candle sequences according to the Gann counting methodology. This approach helps detect continuation or reversal patterns, providing a clear view of the market structure. Indicator Conditions: Bullish Sequence: A green dot is placed above the candle if: The current high is greater than the high of the previous candle. The current low is greater than the l
FREE

BinaWin NoTouch is an indicator that sends an alert signal when the trade is in the right position to wait for the breakdown of a side market.
It is specially designed to trade under the “No Touch” strategy of the Binary.Com platform with synthetic indexes N.10, N.25, N.50, N.75 and N.100
Similarly, trading can be done with the conventional CALL and PUT strategy of any Binary Options platform.
Requirements to use the indicator:
1. Have an account at Binary.Com
2. Configure the Binary.Com d
FREE
BBTrend is a powerful trend analysis tool designed to provide a clear overview of market volatility and trends at a glance.
This indicator calculates the difference between two Bollinger Bands of different periods,
visually indicating the strength of upward or downward trends to traders. Clear Trend Visualization: The upward trend is represented in green, and the downward trend in red,
allowing traders to intuitively grasp the direction and strength of the trend. Standardized Percentage Disp
FREE

ATR is a measure of volatility introduced by market technician J. Welles Wilder Jr. in his book, "New Concepts in Technical Trading Systems". In general, traders are accustomed to seeing the ATR in the form of a sub-window indicator. What I am presenting here is a simplified version of ATR - just the current ATR number - very useful for monitoring just the very moment of the current chart. If you want to monitor several timeframes in the same chart, just add the ATR Monitor indicator several tim
FREE
If you love this indicator, please leave a positive rating and comment, it will be a source of motivation to help me create more products <3 Key Takeaways Bulls Bears Eyes is another version of Laguerre RSI. Use Bull/Bear Power to calculate. One use of the Bulls Bears Eyes is to identify trends. This is done by looking for sustained periods when the indicator is above or below the 0.5 line. Also, a buy signal is generated when the Bulls Bears Eyes line crosses above the 0.15 level, while a s
FREE
The Boom300 Spike Indicator is a powerful tool designed to identify significant price spikes in the market.
Key Features: Real-time Spike Detection: The indicator continuously scans the market for sudden spikes in price action, providing timely alerts when significant spikes occur. And recommend to use the 1Min chart Customizable Alerts: Traders can customize alerts to suit their preferences, including audible alerts, email notifications, and push notifications to mobile devices. User-Friendly
FREE

This is an ordinary MACD indicator displayed in the main window according to the selected chart style, i.e. Bars, Candlesticks or Line. When you switch the chart type, the indicator display also changes. Unfortunately I could not improve the chart type switching speed. After switching, there are delays before the arrival of a new tick.
The indicator parameters Fast EMA period Slow EMA period Signal SMA period Applied price
FREE

For those traders and students who follow the famous brazilian trader Igor Rodrigues (Mago Trader) here it is another tool he uses: a 2-line MACD specially set with Phi ratios. This MACD is packed with a twist: a Filling Area , to easily and visually spot the corresponding trend on the chart. Obviously, you can turn On and Off this filling feature. If you don't know Igor Rodrigues and you are a brazilian trader and student, just google for him... Very simple and useful indicator.
If you are loo
FREE

Fractals ST Patterns Strategy is a modification of Bill Williams' Fractals indicator. It allows setting any number of bars to find a fractal. This simple indicator corresponds to the parameters specified in the ST Patterns Strategy ( https://stpatterns.com/ ) . Structural Target Patterns are essentially the market itself, which is consistently divided into components. To form ST Patterns , no trend lines, geometric proportions of the model itself, trading volume or open market interest are neede
FREE
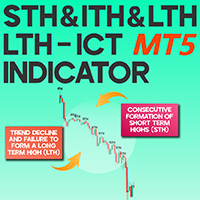
STH, ITH & LTH ICT Indicator for MT5 – Free Download The STH, ITH & LTH Indicator is a specialized ICT tool designed for MetaTrader 5 (MT5) , utilizing Advanced Market Structure to identify key price highs across multiple timeframes. This indicator pinpoints short-term (STH), mid-term (ITH), and long-term (LTH) highs , providing traders with a broader perspective on market movements and price action behavior. «Indicator Installation & User Guide» MT5 Indicator Installation | STH & ITH & LTH IC
FREE

This is Gekko's Channels Plus indicator. It extends the use of the famous Channels and calculates strong entry and exit signals using price action on the top, bottom and middle lines. You can set it up in many different ways, eg: pullback, pullback against trend, middle line crossing and middle line crossing against trend. Inputs Number of Bars to Plot Indicator: number of historical bars to plot the indicator, keep it low for better performance; Produces Signal Only When a Bar Closes: wait fo
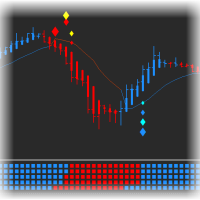
This indicator is a copy of the Gann Hi-Lo Activator SSL indicator which was rewritten in MQL5. The original indicator was one-colored, that is why for more visual definition of the trend direction it was necessary to make it colored. This version is Mutitimefame, now you can see multi-trends in a separate window and signals in the main chart. Alert mode and sending of emails has been also added.
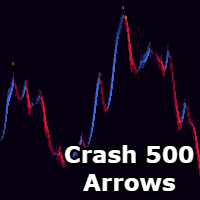
Sylvan Crash 500 Arrows!! MT5
*Only use this on Crash 500 Market. *Only for the 15M Chart. *Sells only. *This doesnt redraw or repaint but the candle needs to close for the arrow to print permanently, it does print on candle open. *It doesnt get you at the tip of highs but instead as soon as price slows down or drops from its overbought parameters. *Do not change input settings as this is already optimized.
This is the Super Trend Dashboard MT5. This dashboard will scan multiple timeframes in MT5 platform, from M1 chart to D1 chart. It will send the buy/sell signals by alert on the platform or sending notification to your phone or message you via a email.
The buy signal is generated when the super trend line flip from SELL to BUY. The sell signal is is generated when the super trend line flip from BUY to SELL.
The up trend color will be displayed depending on the current Super Trend value.
This is the Heiken Ashi Dashboard MT5. This dashboard will scan multiple timeframes and symbols in MT5 platform, from M1 chart to D1 chart. It will send the buy/sell signals by alert on the platform or sending notification to your phone or message you via a email.
The buy signal is generated when the heiken ashi bar changes its color from red to white. The sell signal is is generated when the heiken ashi bar changes its color from white to red. The up/down trend color will be displayed depend

SYSTEM INTRODUCTION: The Binary Options Conqueror System Is Specifically Designed For Binary Options Trading. Unlike Other Systems And Indicators That Were Adopted From Other Trading Environments For Binary Options. Little Wonder Why Many Of Such Systems Fail To Make Money . Many End Up Loosing Money For Their Users. Forward Testing Of The System Has Shown Remarkable Results . The Results Of Forward Testing On Live Trading Account Is Consistent With The Results Obtained By Back Testing .

O indicador Vwap Deviation Bands segue na mesma linha dos outros indicadores da White Trader, que buscam leveza, personalização e qualidade, para entregar o que há de melhor para o trader. Isto, além de combinar preço e volume (informações importantes para o trader) com uma medida estatística do desvio padrão.
Este indicador já foi utilizado e testado por outros traders que deram sugestões, inclusive, para chegarmos nesta versão final (embora ainda esteja aceitando sugestões, sempre :) ). O de

Cumulative delta indicator As most traders believe, the price moves under the pressure of market buying or selling. When someone redeems an offer standing in the cup, the deal is a "buy". If someone pours into the bid standing in the cup - the deal goes with the direction of "sale". The delta is the difference between purchases and sales. A cumulative delta - the difference between the cumulative sum of purchases and sales for a certain period of time. It allows you to see who is currently contr

Magic Finger can help you identify trends and trading opportunities clearly. The finger points to the open position signal, and the discoloration line is confirmed by the trend.
If you are a day trader, you can choose to trade during a period of active trading, referring to the discoloration line as the basis for the next order, finger signal as a filter. If you are a trend trader, you can choose a period above H1, wait for the appearance of the finger signal in the key price area, and enter th

Every indicator has its advantages and disadvantages. Trending ones show good signals during a trend, but lag during a flat. Flat ones thrive in the flat, but die off as soon as a trend comes. All this would not be a problem, if it was easy to predict when a flat changes to a trend and when a trend changes to a flat, but in practice it is an extremely serious task. What if you develop such an algorithm, which could eliminate an indicator's flaws and enhance its strengths? What if such an algorit

Market tops are characterized by Volume Climax Up bars, High Volume Churn and Low Volume Up bars (also called Testing). Market bottoms are characterized by Volume Climax Down bars, High Volume Churn and Low Volume Down bars (Testing). Pullbacks, in either up or down trends, are similar to market topping or bottoming patterns, but shorter in duration and with simpler volume patterns.
FREE

The 9-5 Count is designed to track a very powerful cycle that runs through all freely traded markets. This is not a time cycle but a price cycle. The time spent between two points is not as important as the price traveled between them. The 9-5 Count is called that because one complete upward cycle consists of measurement of 9 units plus 5 units of cycle time. This tool takes into account price and pattern together, so it’s more than just a simple cycle. The 9-5 theory classifies market movemen

Média Móvel que possui todos tipos de Cálculo comum: Simples Exponencial Suavizada Ponderada Conta com suporte para aplicação sob outros indicadores!
Seu principal diferencial é o esquema de cores em GRADIENTE que, de acordo com a mudança no ângulo da média, altera suas cores conforme demonstrado nas imagens abaixo. Com isso, espera-se que o usuário tenha uma percepção mais suavizada das pequenas alterações.
Bons trades!!
FREE

This MT5 version indicator is a unique, high quality and affordable trading tool. The calculation is made according to the author's formula for the beginning of a possible trend. MT4 version is here https://www.mql5.com/ru/market/product/98041 An accurate MT5 indicator that gives signals to enter trades without redrawing!
Ideal trade entry points for currencies, cryptocurrencies, metals, stocks, indices! The indicator builds buy/sell arrows and generates an alert. Use the standart B

The Session Volume Profile indicator displays the distribution of trade volume across price levels for a specific trading session. It visualizes areas of high and low trading activity, helping traders identify support and resistance zones. The profile's peak, known as the Point of Control (POC), represents the price with the highest traded volume.
The inputs of the indicator:
volumeBars(Row Size) : Determines the number of price bins or rows for the volume profile. A larger number results in fi

Are you ready to elevate your trading game and experience unparalleled accuracy in market predictions? The Scalping Range Grid Indicator is not just a tool—it’s your main weapon for pinpointing the next move in the financial markets. Designed for traders who demand the best, this cutting-edge indicator harnesses the power of grid-based analysis to scan future price transit zones with unmatched precision. Imagine having the foresight to know where the price is most likely to pause, consolidate,

Fast Trade Detector (FTD) - Самый правдивый индикатор, который показывает истинное
настроение Большого Игрока.
На бирже есть Игрок, у которого есть всё для того, чтобы быть в первых рядах в книге торговых
приказов (биржевом стакане). Эти сделки как индикатор рыночного настроения сильного игрока.
Вы поймёте, что всё не совсем так, как представляли раньше. Вам откроются алгоритмы и стратегии
крупного участника рынка. Исполнение индикатора в виде гистограммы в подвале графика. Гистограмма п

Are you a trend surfer like us? Do you use Moving Averages too? Ever wanted the are between them to be painted? Yeah, we solved this problem with the Filled MAs indicator! It is very simple, just puts two fully customizable Moving Averages on chart and fill the space between them, changing the color as they intersect. Thanks to gmbraz for the version 1.1 idea. Any questions os suggestions please contact me! Enjoy!
This is a free indicator, but it took hours to develop. If you want to pay me a
FREE

Description
Range Detector is an indicator that identifies ranges in the market and displays their presence on the price chart.
Recommendations
You can use this indicator to determine the flet and, accordingly, to determine the direction of opening a position or closing an opposite position.
Parameters
Maximum History Bars - maximum number of history bars for calculating the indicator. Average True Range Period - ATR indicator period (used to calculate the difference between moving a

Trading Signal for MetaTrader5 PC platform
The Signal is based on the Investologic EA trend strategy . Trend following indicator’s and oscillator’s, can work with any symbol or market in MT5 platform FOREX, GOLD, OIL, STOCKS, INDEXES, NASDAQ SPX500 The strategy
the strategy uses multi time frame combination of indicators and moving averages to find the best entry point wen the fast MA slow MA Crossover And Stochastic , RSI , Average Directional Movement Index ,combined together to
FREE
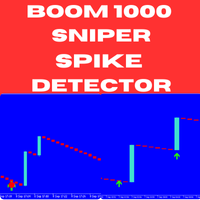
Boom and Crash Sniper Spike Detector - Boom 1000 The Boom and Crash Sniper Spike Detector is the ultimate tool for spike trading on Boom 1000, offering clear and reliable signals to help you capture high-probability trades. This advanced indicator is designed to enhance your trading strategy by simplifying spike detection and maximizing your profits. Key Features: Multi-Timeframe Compatibility : The indicator can be used on M1, M5, M15, M30, and H1 timeframes, but it works best on the M1 timefra

Long & Short Based on Cointegration Statistical and Quantitative Long-Short (Pair Trading) approach for long and short positions. Your CPU will always be safe and stable when using Multiple Linear Regression if you have a reliable indicator. Based on the results of this indicator, you can execute a long and short or a long and long/short and short trade between two separate assets. It can show you a Highly informative dashboard based on Cointegration Search you determine, with all statistical d

It predicts the most likely short-term price movement based on advanced mathematical calculations.
Features Estimation of immediate price movement; Calculation of the real market trend; Calculation of the most important support and resistance levels; Algorithms optimized for making complex mathematical calculations with a minimal drain of system resources; Self-adjusting for better performance, so it’s able to work properly at any symbol (no matter how exotic it is) and any timeframe; Compatibl

Media Band é um indicador que projeta 8 bandas paralelas a uma media movel de referencia. Podendo auxiliar na visualização da volatilidade do mercado financeiro. Este indicador foi inspirado na necessidade de avaliar melhor uma boa oportunidade de compra e venda dos ativos de acordo com o "seu" operacional. Não pode ser utilizado como recomendação e sim a fins de estudos do Mercado Financeiro.
FREE

Acceleration Points est un puissant outil de détection des points critiques du mouvement des prix, basé sur l'idée de calculer l'accélération des fluctuations des prix.
_________________________________
Comment utiliser les signaux de l'indicateur:
L'indicateur forme un signal après l'apparition d'une nouvelle barre de prix. Il est recommandé d'utiliser le signal généré après avoir franchi le point critique dans la direction spécifiée. L'indicateur ne redessine pas ses signaux.
___________
FREE
The Day Trading Price Pattern indicator is an indicator of entry points that searches for and displays Price Action system patterns on dozens of trading instruments and on all standard time frames: (m1, m5, m15, m30, H1, H4, D1, Wk, Mn). Show all the main Price Patterns are introduced in the Ebook Day Trading With Price Action - Galen Wood You won't never miss any potential trading setup.
Want to send all the signals to your Telegram Channel? Checkout this guide
Advantages
1. Patterns: Tre
FREE

PROMOTIONAL PERIOD - ONLY 2 COPIES LEFT OF FIRST 10 BUYERS AT PRICE 300,00$!!!
CHECK SCREENSHOTS AND COMMENTS FOR OUR STRATEGY RULES AND LIVE TRADES SIGNALS PULL IT BACK is a revolutionary trading system and a complete strategy with advanced algorithm developed to detect the trend direction after a PULLBACK , a RETREACEMENT or a KEY LEVEL BOUNCE . The goal of this indicator is to get as many pips as possible from market trend. Following strictly the rules of the strategy, you can become a

This multi time frame and multi symbol indicator scans for pin bars. Combined with your own rules and techniques, this indicator will allow you to create (or enhance) your own powerful system. Features Can monitor all symbols visible in your Market Watch window at the same time. Apply the indicator to just one chart and instantly monitor the entire market. Can monitors every time frame, from M1 to MN, and sends you a real-time alert when a pin bar is identified. All Metatrader native alert types

CET INDICATEUR FAIT PARTIE DE L'EA: HIPERCUBE PRO GALE BTC Code promo pour 25% de réduction sur Darwinex Zero: DWZ2328770MGM
Présentation de la nouvelle version de l'indicateur Donchian
Nous sommes ravis de présenter la nouvelle version de l'indicateur Donchian , conçue avec des améliorations de pointe et une précision accrue. Désormais entièrement adaptée à HiperCube Pro Gale , cet outil mis à jour offre une expérience fluide pour un trading plus efficace.
Pourquoi cette version est révo
FREE

Welcome to Propsense, the best solution for new and veteran traders with a simple FREE strategy! NEW to MT5! This indicator is a unique and affordable trading tool built on the teachings of a former bank trader. With this tool, you will be able to see inefficient points with ease. Additionally, traders will have a clean Heads Up Display which will show your running and closed P/L in pips AND currency units. As a highly requested option, a candle timer has been added which will allow you to j

MT5 Enveloping Pattern Detector: Your competitive advantage in trading Are you looking for a tool to help you accurately identify the best trading opportunities in the forex market? Our Engulfing Pattern Detector provides you with a highly reliable buy or sell signal, based on one of the most recognized and effective Japanese candlestick patterns: the engulfing pattern. With an average success rate of 70%, this indicator will allow you to make safer and more profitable investment decisions. Don'
FREE

Este indicador imprime 2 médias com distância de 1 ATR (Average True Range) da média principal. As demais médias móveis só são mostradas se estiverem fora desse intervalo. Parâmetros: mediaprincipal = Média que será criado o intervalo, não será mostrada. mediasec1, mediasec2, mediasec3 = médias secundárias. periodatr: periodos do ATR Este indicador faz parte do Trade System MarketStrengthRadar
FREE

Combining the best of Price Action , Directional Movement , and Divergence / Convergence analysis, the Candle Color Trend is the easy and reliable way to identify the direction of the trend. The indicator automatically paints the candles according to the premise that the upward trend is defined by prices that form a series of ascending tops and bottoms. On the other hand, the downward trend is defined by prices that form a series of descending tops and bottoms.
Color Trend is certainly one of
FREE

This indicator is designed according to the combination of WPR and Stoch indicators, when WPR goes up and Stoc goes up quickly too, the price may meet strong resistance, many times short order will take profit, but if the price break through it, Long positions are more likely to be profitable, and the reverse held true as well. You can adjust the parameters of WPR and Stoc to Adapt the symbol you operate. Click here to look the advanced edition: https://www.mql5.com/en/market/pro
FREE

El **Heiken Ashi Smoothed** es una versión suavizada del indicador técnico Heiken Ashi, que se utiliza en el análisis de gráficos de velas para identificar tendencias del mercado y pronosticar movimientos de precios. Este indicador se basa en el promedio de datos de precios para formar un gráfico de velas que ayuda a los traders a filtrar el ruido del mercado.
**¿Para qué sirve?** Este indicador se utiliza para identificar cuándo los traders deben permanecer en una operación y cuándo está por
FREE

Market Palette est un puissant outil de filtrage des décisions commerciales basé sur l'inertie et l'accélération des fluctuations des prix.
_________________________________
Comment utiliser les signaux de l'indicateur:
L'indicateur forme des signaux d'histogramme, trois couleurs différentes. Dans le schéma de couleurs standard, lorsque les colonnes bleues apparaissent, il est recommandé de garder uniquement les positions longues, lorsque les colonnes rouges apparaissent - seulement courtes,
FREE

This indicator identifies short-term, medium-term and long-term highs and lows of the market according to the method described by Larry Williams in the book "Long-term secrets to short-term trading".
Brief description of the principle of identifying the market highs and lows A short-term high is a high of a bar with lower highs on either side of it, and, conversely, a short-term low of a bar is a low with higher lows on either side of it. Medium-term highs and lows are determined similarly: a
FREE

The Zero-Lag MA Trend Levels indicator combines a Zero-Lag Moving Average (ZLMA) with a standard Exponential Moving Average (EMA) to provide a dynamic view of the market trend. This indicator automatically plots the EMA and ZLMA lines on the chart. The colors of the lines represent the market trend.
With EMA: ++ green (uptrend) when EMA > zlma ++ red (downtrend) when EMA < zlma With ZLMA: ++ green (uptrend) when the line is trending up ++ red (downtrend) when the line is trending down
When th

The VIX Fix is a volatility indicator developed by renowned trader Larry Williams. It's designed to measure volatility in assets that don't have options or futures, such as individual stocks and forex markets. Essentially, it acts as a synthetic VIX (Volatility Index) for any asset , providing a gauge of market uncertainty. This modified version of William's indicator helps you to find market bottoms and market tops. It comes with 2 styles: Stochastic and histogram style. Please see screenshots

Description: First of all Its worth emphasizing here that the Trend Breakout Catcher is Non-Repainting, Non-Redrawing and Non-Lagging Indicator, Which makes it ideal from both manual and robot trading. The Trend Breakout Catcher Indicator employs a sophisticated algorithm designed to predict trends early and generate timely Buy and Sell signals at the onset of a breakout. Utilizing a smart calculation based on numerous elements, the indicator forms a robust and redundant system to detec

Description: The Range Breakout Catcher Indicator is a powerful tool known for its non-repainting, non-redrawing, and non-lagging capabilities, making it suitable for both manual and robot trading. This indicator utilizes a smart algorithm to calculate ranges and generate early signals for Buy and Sell positions at the breakout of these ranges, facilitating the capture of trends during ranging consolidations. The range calculation involves a comprehensive system based on various elements, prov

Trap Play refers to a market situation where price initially makes a new high or low, luring traders into believing a strong trend is forming. However, the price quickly reverses and invalidates the breakout, trapping those traders who entered positions based on the initial move. This sudden reversal often results in a rapid exit of positions, leading to significant price movement in the opposite direction. Trap plays can occur in various financial markets and timeframes and are characterized

The indicator displays a matrix of indicators across multiple timeframes with a sum total and optional alert. Custom indicators can also be added to the matrix, in a highly configurable way. The alert threshold can be set to say what percentage of indicators need to be in agreement for an alert to happen. The alerts can turned on/off via on chart tick boxes and can be set to notify to mobile or sent to email, in addition to pop-up. The product offers a great way to create an alert when multiple

The indicator displays trend slowdown or possible end of trend and price reversal. The indicator has no parameters. When red bars appear and when they become shorter, we can talk about the approaching end of the downtrend. When green bars become shorter, we can expect the approaching end of the uptrend.
FREE

No Demand No Supply This indicator identifies No Demand –No Supply candles to your chart and plots volume bars colored according to the signal. It can be applied to all timeframes or to a specific one only. It can also be used as regular volume indicator with exceptional future of WEIGHTED VOLUME. Furthermore is has an alert notification, sound and email when a signals occurs. The indicator does not repaint but the alert will come on two candles back due to the definition of No Demand No Su

MA Crossover and Trend Alert Indicator Latest Updates: Fixed multiple buy and sell icons on each candle for cleaner signals. Optimized alert logic to prevent duplicate notifications. Enhanced compatibility – Now works with Heiken Ashi or regular candles. Updated print statement – Alerts now log directly to alerts.txt for future reference. Overview
The EMA Crossover and Trend Alert Indicator is a trend-following tool designed to assist traders in identifying moving average crossovers and short-
Special offer : ALL TOOLS , just $35 each! New tools will be $30 for the first week or the first 3 purchases ! Trading Tools Channel on MQL5 : Join my MQL5 channel to update the latest news from me Indicateur de Canal de Régression Linéaire est un puissant outil d'analyse technique qui aide les traders à capturer les tendances de prix et les points de retournement potentiels. En calculant et en affichant des canaux de régression linéaire, des bandes et des projections futures, cet

The indicator shows Jake Bernstein's MAC (Moving Average Channel) System signals ---------------------------------------- System assumes several types of entering in trade, in this indicator only one type implemented - on closing of second trigger bar. It is recommended to start using this indicator together with Jake Bernstein's free lessons https://www.youtube.com/@JakeatMBH/videos Arrow shows signal bar - enter on closing or on opening of the next bar, cross - stop level, dot - minimum profi
FREE

Помощник для торговой системы SystZ . Чертит трендовые линии по соседним экстремумам зигзага. Условие для линии сопротивления - правый должен быть ниже левого. Для линии поддержки - правый выше левого. Не допускается, чтобы между экстремумами, по которым проводится трендовая линии были другие. Экстремумы, удовлетворяющие этим условиям, отмечены символом фрактала. Закрытие свечи за линией - сигнал для открытия позиции.
FREE
Découvrez comment acheter un robot de trading sur le MetaTrader Market, le magasin d'applications de la plateforme MetaTrader.
e système de paiement de MQL5.community prend en charge les transactions via PayPal, les cartes bancaires et les systèmes de paiement populaires. Nous vous recommandons vivement de tester le robot de trading avant de l'acheter, pour une meilleure expérience client.
Vous manquez des opportunités de trading :
- Applications de trading gratuites
- Plus de 8 000 signaux à copier
- Actualités économiques pour explorer les marchés financiers
Inscription
Se connecter
Si vous n'avez pas de compte, veuillez vous inscrire
Autorisez l'utilisation de cookies pour vous connecter au site Web MQL5.com.
Veuillez activer les paramètres nécessaires dans votre navigateur, sinon vous ne pourrez pas vous connecter.