Regardez les tutoriels vidéo de Market sur YouTube
Comment acheter un robot de trading ou un indicateur
Exécutez votre EA sur
hébergement virtuel
hébergement virtuel
Test un indicateur/robot de trading avant d'acheter
Vous voulez gagner de l'argent sur Market ?
Comment présenter un produit pour qu'il se vende bien
Nouveaux indicateurs techniques pour MetaTrader 5 - 41

The Spots Indicator can be used for Entering and Exiting your trades based on the common candlestick patterns such as: engulfing, hanging man, doji etc. It is designed to publish desktop and mobile notification every time a signal is triggered. However, it is worth noting that this indicator is recommended to be used with other indicator for confirming the entries. It is best to use it with the Investment Castle Trend Lines indicator and the Supply and Demand indicator .
FREE

The idea behind this indicator is very simple , First it contains 2 mechanisms to place your trades:
1- Enter the Pips you want to duplicate to price levels. 2- Automatically let the indicator specify the largest Buy / Sell Volume Candle and place duplicated levels based on the candle itself.
How it works: 1- Enter the Pips you want to duplicate to price levels: 1- once the indicator is loaded you will need first to Specify the number of pips in the indicator Configuration window ,you can

Indicator alerts for Dual Relative strength index rsi. Large rsi preset at 14 is below 30 small rsi preset at 4 is below 10 for buy bullish signals .
Large rsi preset are 14 is above 70 small rsi preset at 4 is above 90 for sell bearish signals . Includes mobile and terminal alerts. draws lines when alerts.
This indicator can help identify extremes and then the tops or bottoms of those extremes .
FREE

A ideia do indicador é mudar de cores assim que o candle viole a banda; Caso o candle viole a banda superior, pinta o candle de vermelho, Caso o candle viole a banda inferior , pinta o candle de verde, Se o candle passar em algum momento pela média, ele assume uma cor acinzentada; Os candles que não passem pela média, nem violem a banda, apresentarão cor verde fraca, se for de alta e cor vermelha fraca se for de baixa. Projeto concebido no canal Aprenda a programar, keltner cores.
FREE

I always wondered if I can have multiple time frame Moving average on same chart , it is not possible , now with my Indicator is possible , As you know Moving average is lagging not leading indicator , but how can I predict future levels of it ?
I came with this idea , I hope you will like it , I made a Mirror of Moving average , the other side of specific time will be shown in the other side of the chart where the price didnt reach yet , that will help you to know the levels you can start sel
FREE
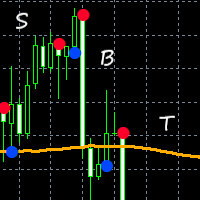
This indicator combines input from two trend filters and the ADX. You can change the trend line on chart to your preference. Great for scalping and channels. Features alert function and parameter TrendLinePeriod.
How to use: Simply attach to any chart. Sell on red bullets, with trend line above price. Enter on bullets closest to this line. Buy on blue bullets, with trend line below price. Enter on bullets closest to this line. Best results when checking the higher time frames before entering t

40% off. Original price: $50
Ichimoku Trend Finder is a multi symbol multi timeframe trend dashboard that helps traders to monitor and identify potential market trends from one chart. This panel scans the Ichimoku Kinko Hyo indicator in 28 configurable instruments and 9 timeframes for classic Ichimoku trend signals with a deep scan feature to scan all market watch symbols (up to 1000 instruments!).
Download Demo here (Scans only M1 and M6) Settings description here MT4 version here
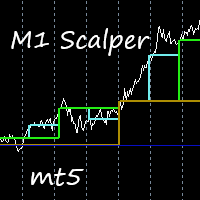
This indicator is excellent for scalping on the M1 or M5 chart. Uses a special algorithm for the lines. No need to set up the indicator. Does not feature any alerts and is best used manually after visually confirming the line displays. NB: Make sure to download M1 history before testing and use.
How to use: Simply attach to M1 or M5 chart. Zoom chart out completely. Sell when all lines above the white line (PriceLine). Sniper line crosses above white line. Buy when all lines below the white li

This indicator gives you arrows, two SR lines and a golden trend line. Uses a special trend algorithm to plot the arrows, combined with support and resistance inputs. Perfect for channel trading. Features alert functions.
Parameter TrendArrowPeriod. Parameter TrendLinePeriod. (Change to your preference) How to use: Simply attach to any chart with default settings. Zoom in the chart, to see the two blue SR lines and arrows more clearly. When the blue SR line is below the price, golden trend line

The Price Elevator indicator is developed to help you figure out the general long-term trend of the market. If the price is above the Green separator line, this is a clear indication the bulls are in control. Similarly, the bears are in control if the price continues to trend below the red separator line. Download Price Elevator MT4
Trend Re-entry In this case you would plan your buy entries above the green dotted box (make sure to set the Buy / Sell Retracement Floor=30). The SL should be
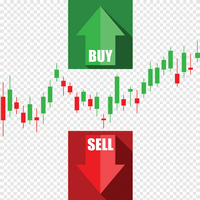
Cet indicateur utilise les hauts et les bas locaux de la série de prix. Après avoir mis en évidence les extrema, leurs valeurs sont lissées. Grâce à cela, deux canaux sont construits - externe et interne. Le canal interne montre les limites si le mouvement des prix suit strictement une tendance linéaire. Le canal externe montre les limites du mouvement des prix avec une tendance logarithmique. Après avoir calculé les canaux, l'indicateur analyse le mouvement des prix réels et propose des recomm

L'alerte d'histogramme de prix ROC est un indicateur technique basé sur le momentum qui mesure la variation en pourcentage du prix entre le prix actuel et le prix d'il y a un certain nombre de périodes. Le ROC est tracé avec un histogramme par rapport à zéro, l'indicateur se déplaçant vers le haut en territoire positif si les variations de prix sont à la hausse, et se déplaçant en territoire négatif si les variations de prix sont à la baisse.
L'étape principale du calcul de la période ROC est

L'indicateur TickCounter compte les ticks de haut en bas sur chaque nouvelle barre.
Le calcul commence à partir du moment où l'indicateur est placé sur le graphique.
Les barres d'histogramme représentent : Barres jaunes - nombre total de ticks ; Barres bleues - ticks UP ; Barres rouges - coches vers le BAS. Si la barre bleue n'est pas visible, il y a plus de graduations vers le bas et la barre rouge s'affiche au-dessus de la bleue (la couche rouge est au-dessus de la bleue). MT4 version: h

Filigrane centralisé
Ajoute un filigrane centré avec le nom de l'actif et la période choisie.
Il est possible de remplacer le type de police, la taille de police, la couleur de police et le caractère de séparation.
Le filigrane est positionné derrière les bougies, ne perturbant pas la visualisation.
Il a un recentrage automatique si la fenêtre est redimensionnée.
J'espère que cet indicateur vous aidera, bon trading ;)
FREE

The Market Entropy indicator was created to measure the order of price changes over time. consists of two lines and a histogram where the lines are responsible for measuring the price movement and the histogram measures the strength of the analyzed movement. It can be used to find a trend (Image 2) or price reversal (Image 3).
Blue Line: Buy Entropy Red Line: Sell Entropy Historgram: Market Entropy
Interpretation: Buy Line above the Sell Line indicates that in the analyzed period buyers wer

Informações Importantes sobre o ArrowHacker (Não repinta! Não gera sinais atrasados!)
Se você está procurando um indicador que cumpre aquilo que promete, você acabou de encontrar! O ArrowHacker irá superar todas as suas expectativas com certeza! E o melhor de tudo, é só colocar na sua conta, ligar e já começar a lucrar!
O ArrowHacker é um sistema profissional de trade criado para as plataformas MT4 & MT5 e otimizado para trabalhar com qualquer ativo na plataforma MetaTrader 5, sejam moeda

ImbaTrend Runner - is the trend following manual system for forex/crypto market. It defines medium-term trends and works with it in intraday mode. System shows enter points, profit and loss targets. As a rule profit targets are 2-3 X bigger than loss targets. Indicator is AutoAdaptive and it automatically updates it's settings during trading. Indicator is sensitive to market changes, regular updates helps to stay in relevant trend. Main Indicator's Features Signals are not repaint, late or disap
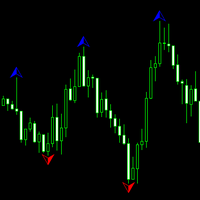
An indicator for all timeframes with a configurable number of bars for calculating fractals. Suitable for determining extremes of both lower and higher order, by which it is possible to determine the patterns of technical analysis, as well as divergences.
The indicator has one adjustable parameter - the number of bars for extremum calculation. It is also possible to change the color characteristics.

40% off. Original price: $50 Moving Average Trend Scanner is a multi symbol multi timeframe triple MA crossover dashboard that helps traders to monitor, and identify potential market trends from one chart. This panel scans 3 moving averages in up to 28 configurable instruments and 9 timeframes for triple moving average alignment and moving average crossover with a deep scan feature to scan all market watch symbols (up to 1000 instruments!).
Download Demo here (Scans only M1 and M6) Sett

40% off. Original price: $50
Advanced Bollinger Bands Scanner is a multi symbol multi timeframe Bollinger bands dashboard that monitors and analyzes the Bollinger Bands indicator from one chart. This panel scans the Bollinger bands indicator in up to 28 configurable instruments and 9 timeframes for price overbought/oversold, price consolidation (Bollinger bands squeeze), and consolidation breakout (squeeze break) with a deep scan feature to scan all market watch symbols (up to 1000 instrumen

Market Conditions indicators can provide support to the trader so that he can identify market trends over a given period. The purpose of this model is to allow traders to have a global vision on the exchange markets. And the formula that we develop allow to scan the major currencies in the exchange market. The model uses a purely statistical formula which is based on the historical data of the major currencies "eur, usd, gbp, jpy, aud, nzd, cad, chd". Of which 28 currency pairs are traded. It

Rejoignez le trading avec l'indicateur WolfeWaveBuilder ! Il s'agit d'un outil unique créé spécifiquement pour obtenir les décisions d'investissement les plus réussies et les plus rentables. Il est idéal pour les comptes réels et bénéficie d'une stratégie de trading soigneusement testée et pratiquement garantie. Ne manquez pas votre chance ! Commencez à gagner de l'argent avec l'indicateur WolfeWaveBuilder !
Version MT5 https://www.mql5.com/ru/market/product/8920
Caractéristiques de l'indic

Douze réseaux de neurones artificiels divisés en quatre ensembles essayer de prédire la direction du mouvement des prix à l'avenir : petit : 1 minute, moyen : 5 minutes, grand : 30 minutes, royale : 15 minutes. Cet indicateur pour le trading actif à haute fréquence est prêt à fonctionner avec une EA lancée séparément et recevant des signaux de l'indicateur sous la forme de variables globales publiées par l'indicateur. Cet indicateur ne fonctionne pas dans le testeur de stratégie, alors regardez

Avant d'installer l'indicateur HeatMap assurez vous d'utiliser un broker qui vous donne accès au Depth of market (DOM) !!
Cet indicateur crée sur votre graphiques une heatmap vous permettant de voir les ordres limites d'achat ou de vente facilement et en temps réel. Vous avez la possibilité de changer de réglage et les couleurs de la HeatMap afin de s'adapter à tous les marchés et à tous les graphiques. Voici un exemple de réglage que vous pouvez utiliser avec le SPX500 sur le broker AMPGlob

MetaBands uses powerful and unique algorithms to draw channels and detect trends so that it can provide traders with potential points for entering and exiting trades. It’s a channel indicator plus a powerful trend indicator. It includes different types of channels which can be merged to create new channels simply by using the input parameters. MetaBands uses all types of alerts to notify users about market events. Features Supports most of the channel algorithms Powerful trend detection algorith

Using the Stochastic Oscillator with a Moving Average is a simple but very efficient strategy to predict a trend reversal or continuation.
The indicator automatically merges both indicators into one. It also gives you visual and sound alerts.
It is ready to be used with our programmable EA, Sandbox, which you can find below: Our programmable EA: https://www.mql5.com/en/market/product/76714 Enjoy the indicator!
This is a free indicator, but it took hours to develop. If you want to pay me a c
FREE

PULLBACK HUNTER What is every trader's cherished dream? To see without delay the places where the reversal will happen. This, of course, is from the category of magic, though... nothing is impossible. But for now I've prepared for you an indicator that marks in real time the end of corrections to the current movement or in short - catches pullbacks.What is the main point? Many people practice rebounds when the price moves in the direction of the open position. And they do them on the formation o

Taking into account the difference in trading sessions, the indicator shows the trend direction and the resistance level. All events are marked on the chart and alerts are sent. Using SessionAlert, you can trade calmly, steadily. You just need to specify the start and end time of the sessions. The indicator displays the resistance level, the arrow indicates the trend change event and additionally marks the price touching the resistance level. The principle of operation of the indicator is very s

The indicator draws actual Fibonacci levels for your trading activity.
The levels are redrawn every time after the price touches the low (0%) or the 100% fibonacci level.
In the parameters, select the trading activity: Long term investor Medium term investor Medium-term investor active Short term investor Short-term investor active Speculator Speculator active Scalper Scalper active Try this indicator in action, and you will no longer have to look for coordinates for drawing fibonacci level
FREE

This simple indicator creates a ZigZag based on market frequency. It can be very useful for those who trade TapeReading. Switch between the various timeframes and note that the ZigZag will be maintained, this is due to the method used to create a timeless indicator. Set the main input parameter: nTicks: Number of ticks for frequency inversion The other parameters are for visual aspects only, try them.
FREE

Moving Average 4 TimeFrames
Display 4 moving averages of 4 different timeframes on the same chart. In order not to pollute the chart, the indicator will plot the complete average only in the current timeframe of one of the 4 registered averages, for the other timeframes of registered averages the indicator only displays a part of the average so that you know where it is at that time graphic.
Example:
Display on the 5-minute chart where the 200-period arithmetic moving average of the 5 min
FREE

Demand and supply zones Support and Resistance areas Show broken zones Show tested and untested zones Show weak zones Fractal factors Notifications when price reaches point of Interest with Push notifications and pop ups Customizable History Clickable Works on all Timeframes Works on all pairs.
Free for a while till further notice and changes. The demand and supply bot coming soon
FREE

Market Chopper Indicator - is the manual system for market scalping. Indicator uses most accurate points to enter, when current trend has lost it's power and new one starts. Indicator shows : Enter points(buy/sell arrows), Exit points(Stoploss/Takeprofit arrows). Indicator makes market analysis and adapts to any market, any timeframe showing most relevant strategy for exact conditions. Main Indicator's Features Signals are NOT repaint, late or disappear; Every signal comes at the open of new bar

Informações Importantes sobre o CryptoHacker (Não repinta! Não gera sinais atrasados!)
Se você está procurando um indicador que cumpre aquilo que promete, você acabou de encontrar! O CryptoHacker irá superar todas as suas expectativas com certeza! E o melhor de tudo, é só colocar na sua conta, ligar e já começar a lucrar!
O CryptoHacker é um sistema profissional de trade criado para as plataformas MT4 & MT5 e otimizado para trabalhar com CryptoMoedas.
Nosso sistema utiliza uma poderosa

3 Moving averages crossover , with customizable Notifications and pop ups. Comment for any ideas. Its a demo version , could use some work, hope you at least find it useful. Hit me up with anything or any ideas you feel might be helpful and i will try and add them in if i get the time. Thank you. This version is free as of now . I can't promise anything about the future. But enjoy and have fun. Truly PVRPLE BLVCK. PS don't forget to share and like.
FREE

Всем привет. Представляю Вашему вниманию Индикатор TRUE ATR. Так же есть данный индикатор для mt4 https://www.mql5.com/ru/market/product/82414 Данный индикатор работает на всех рынках. TRUE ATR высчитывает среднестатистическое движение инструмента за 1 день и показывает сколько в инструменте осталось энергии внутри дня. В отличие от классического индикатора АТР которые без разбора учитывает все бары(свечи), TRUE ATR при расчете среднестатистического движения инструмента использует ближайших 5

RSI divergence indicator finds divergences between price chart and RSI indicator and informs you with alerts (popup, mobile notification or email). Its main use is to find trend reversals in the chart. Always use the divergence indicators with other technical assets like support resistance zones, candlestick patterns and price action to have a higher possibility to find trend reversals. Three confirmation type for RSI divergences: RSI line cross 50 level Price returns to previous H/L C
FREE

Bollinger bands out/in strategy A strategy created by Joe Ross, and very useful for finding trades when the market is overloaded. Indicator You don't need to find where there are entries on the chart, this indicator shows them for you. The entrance The trade is confirmed when the price closes outside the bollinger bands on a candle and the candle after the price closes inside the bands. comment I want to improve this indicator, so you can help me sending me your reviews and comments, thanks :).
FREE
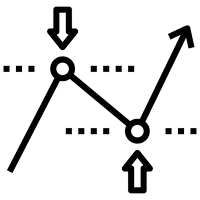
Cet indicateur affiche les niveaux optimaux de take profit et de stop loss. Ces niveaux sont calculés sur la base de données historiques. Au premier démarrage, l'indicateur est entraîné sur l'historique. Après cela, il évalue la probabilité que le prix dépasse tel ou tel niveau à l'avenir et sélectionne les options les plus optimales pour passer des ordres stop. Par exemple, les valeurs de take profit sont sélectionnées pour que le profit soit maximum et que la probabilité que le prix atteigne

Une approche sensée de l'observation des prix Achetez quand les prix montent et vendez quand les prix baissent La déclaration ci-dessus d'acheter lorsque les prix augmentent ou de vendre lorsque les prix baissent peut être trop large et, par conséquent, elle peut nécessiter des directives et des règles, c'est là que The 3 Duck's entre en jeu.
L'indicateur Price Average Mt5 vous aidera à identifier les opportunités d'achat dans le sens de la dernière tendance haussière et les opportunités de v
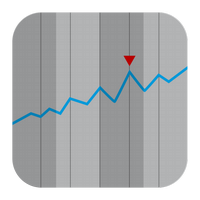
La série hypergéométrique est utilisée pour calculer les coefficients de poids de ce filtre. Cette approche permet d'obtenir un lissage assez intéressant de la série temporelle. Les poids de filtre hypergéométriques ne décroissent pas aussi vite que les moyennes mobiles pondérées exponentielles et linéaires, mais plus rapidement que les moyennes mobiles lissées. Pour cette raison, le comportement de ce filtre est à bien des égards similaire au comportement des moyennes mobiles. Cependant, il pr
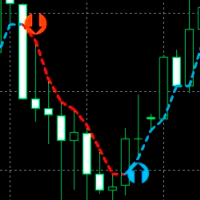
Un indicateur pour déterminer avec précision les points d'inversion des prix sur toutes les périodes et toutes les paires de devises. À l'aide d'une analyse technique du marché et de modèles de diagnostic mathématiques, cet indicateur détermine les points d'inversion des prix et la direction actuelle de la tendance avec une grande efficacité. L'indicateur affiche ces informations sur le graphique sous forme de flèches et de lignes. Les flèches indiquent les points d'inversion de tendance et les

HiLo Activator is a technical analysis indicator developed by Robert Krausz, a renowned hungarian trader with a career in the USA.
It is a trend indicator that helps you to predict the cange of the current trend. In an uptrend it is displayed at the bottom of the candles; in a downtrend it is displayed at the top.
Its only setting is the calculation period.
It is possible to have alerts when a new trend begin. Enjoy! This is a free indicator, but it took hours to develop. If you want to pay m
FREE

Donchian Channel is an indicator created by Richard Donchian. It is formed by taking the highest high and the lowest low of the last specified period in candles. The area between high and low is the channel for the chosen period.
Its configuration is simple. It is possible to have the average between the upper and lower lines, plus you have alerts when price hits one side. If you have any questions or find any bugs, please contact me. Enjoy!
FREE

Top level indicator of exact buy and sell prices. Suitable for all symbols, you just have to choose a convenient trading activity. The indicator shows price rebound levels with the targets for entering and exiting a position. The commentary at each level states: what to do at the level (BUY/SELL); entry price; target exit price. In the parameters you need to select your trading activity: Long term investor Medium term investor Medium-term investor active Short term investor Short-term investor a
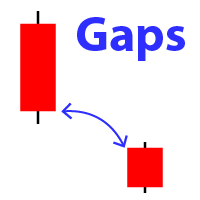
Displays the appearance of a gap on the chart (when the closing price of the previous bar differs from the opening price of the new bar). My #1 Utility: includes 65+ functions | Contact me if you have any questions In the initial settings you can configure: The gap size : gap that exceed this value will be displayed. Size type: pips / poitns / %; Arrow color : separate for up and down gaps. Terminal / Email / Push notifications When you hover the mouse over the gap arrows on the char

The " Stochastic Advanced " indicator displays the signals of the 'Stochastic" indicator directly on the chart without the presence of the indicator itself at the bottom of the screen. The indicator signals can be displayed not only on the current timeframe, but also on a timeframe one level higher. In addition, we have implemented a filter system based on the Moving Average indicator.
Manual (Be sure to read before purchasing) | Version for MT4 Advantages
1. Displaying the signals of the "Sto
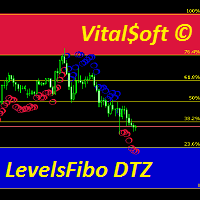
The combined Levels Ib DTZ indicator helps to determine the trend direction when trading. Displaying signals on the chart about a possible upcoming trend change. The indicator is a combination of Fibonacci levels with overbought and oversold zones and a trend indicator based on ZigZag and ATR indicators. The Levels Ib DTZ indicator helps traders predict future price movements and adjust their strategy accordingly. It works on all timeframes.

50% off. Original price: $60 Support and Resistance zones indicator for MT5 is a multi-timeframe panel and alert that finds support and resistance zones and pivot points for all timeframes of MetaTrader 5 and gives alert when price has interaction with them. Download demo version (works on GBPUSD, EURJPY and NZDUSD symbols) Read the full description of scanner parameters in the blog page . Many unique features in one indicator: Integrating support and resistance zones and pivot points in one in
The idea of this trading system from the EMA with a Mediante price from the EMA indicators is based exactly 100% from Ripster47 trading system, me is just the person to create it on the MT5 platform, but with alerts for your own buy/sell settings. Hereby I make a copy from Ripster47 explanation for using that system: " EMA Cloud By Ripster
EMA Cloud System is a Trading System Invented by Ripster where areas are shaded between two desired EMAs. The concept implies the EMA cloud area

Donchian Channel DC is the indicator of Donchian Channels, that plots maximum and minimum values of a specific period, besides mean value line. It´s possible to configure simple period for analysis and the indicator will plot all three values. You can trade with this indicator as trend or reversal, according to each strategy. Do not let to test others indicators as soon as others expert advisors.

VWAP Volume And Price is the indicator for Volume Weighted Average Price, designed according to regular calculation. The average price is calculated using typical price - (high + low + close) / 3 - and weighted by volume for each candle. So, the indicator can be used to trend trades, balanced with volume. Try other products and expert advisors too. Any doubt, PM.

Basato sull'indicatore RSI aiuta a capire quando il trend sta cambiando in base ai periodi impostati. E' possibile impostare intervalli di tempo personalizzati e colori delle frecce. Segui l'andamento e valuta anche in base alla volatilità dell'asset. Funziona con ogni coppia di valuta ed è da considerare come un'aiuto ad una valutazione. Puoi associarlo con altri indicatori.

SMARTMASS INDICATOR
This indicator is different from all known volume indicators. It has a significant distinction; it is an algorithm that relates price movement to volume, attempting to find proportionality and efficient movement while filtering out noise and other movements that are more random and do not follow a trend or reversal. Ultimately, it reveals the true strength of the movement, indicating whether it has genuine support from bulls or bears or if it's merely a high-volume movemen

Quantitative analysis software, this indicator came from another country and thanks to my network today I can share this software with you!
Russian Tool plots arrows on your asset, indicating the trend the asset will enter, easy to use and easy to install indicator
We have been working with robots and indicators since 2018! We came to MQL5 to be able to bring better benefits at the time of payment by our customers!,
our Instagram where we post daily stories of operations: https://www.inst

Dans de nombreuses stratégies, il est assez courant d'utiliser un ATR à l'échelle pour aider à définir un stop-loss, et il n'est pas rare de l'utiliser également pour des objectifs de profit. Bien qu'il soit possible d'utiliser l'indicateur ATR intégré et de calculer manuellement la valeur de décalage, ce n'est pas particulièrement intuitif ou efficace et peut entraîner des erreurs de calcul.
Caractéristiques Décalage ATR configurable Bande supérieure et inférieure. facteur de mise à l'échell
FREE

///XShea///
Basé sur la logique de l'indicateur (MFI) appliqué aux croisements de niveaux. Seulement Scalper
Après plusieurs mois de test et d'application en compte réel j'ai décidé de mettre à disposition
des acheteurs cet outil précieux avec lequel si les règles correspondantes sont respectées
Vous pourrez obtenir de très bons profits sur vos comptes forex.
Cet indicateur est programmé pour envoyer des alertes sonores et de

I'm sure after a lot of research on the internet, you haven't found any indicator that can help you with forex or binary trading in the latest probability strategy created by famous trader Ronald Cutrim. The strategy is based on a simple count of green and red candles, checking for a numerical imbalance between them over a certain period of time on an investment market chart. If this imbalance is confirmed and is equal to or greater than 16%, according to trader Ronald Cutrim, creator of the pro
FREE
Alerte aux tendances sur plusieurs horizons temporels
I. Vue d'ensemble
Analyse en temps réel des tendances sur neuf cadres temporels (M1, M5, M15, M30, H1, H4, D1, W1, MN1) basée sur le calcul des hauts et des bas en utilisant les swing highs and lows et la théorie de Dow. L'indicateur envoie des notifications (alertes) lorsque les tendances des cadres temporels spécifiés correspondent.
II. Avantage
Puisque cet indicateur vous notifie lorsqu'une tendance coïncide, vous pouvez saisir de
Daily Projection Levels , as the name implies, is an indicator that project the price changes in percentage above and below the opening of the day (or closing of the previous day.
These are "psychological" support and resistance areas where price tries to retrace or break out.
With this you have a powerful tool to predict what these zones will be! You can define which projection levels you want (up to 5 above and below), in addition to have alert messages and visual customization. If you want

The most sensitive indicator you've ever seen! And now with Alerts
POscillator Alert is a sensitive indicator that finds each trend direction change in every timeframe and then notifies you with the necessary alarms. It's a new version of the POscillator Indicator, with the addition of its alarm sending capability. The Indicator can send multiple alerts: email, mobile phone notification, alert window and alert sound. All of these different alarms are optional and you can choose the ones you

New Trend Alerts finds new trends at the changing bar very quickly. If the trend has enough power and a quality up/down angle, then the indicator sends multiple alarms to alert you: via email, mobile notification, alert window and alert sound. All of these different alarms are optional, and you can choose which ones you would like to use. The indicator calculates the derivative of the price chart to reveal the slope of price curve and its sign changes. Red bars indicate a positive sign or uptre

CHART OBJECTS: Blue box : Bullish Order Blocks (OB) Red box : Bearish OB Orange box : Mitigated OB. Price bounce from this area the made a new high/low Light gray box : Price bounced from this area but did not made a new high/low Dark gray box : Broken OB. Filled boxes : TimeFrame 1 Order Blocks
Unfilled boxes : TimeFrame 2 Order Blocks
INDICATOR SETTINGS: Order Block Required Length: Required number of subsequent candles in the same direction to identify Order Block. Default value: 5 Im

In this indicator, Heiken Ashi candles are calculated with the most optimal method. You can also customize the results by adjusting the amount of period and method input. But the most important advantage of this indicator is the adjustment of the time frame value. You can use this to calculate the Heiken Ashi chandels to See in time frames with lottery in the lower time chart. In this case, you get the best signal to buy or sell using two or more Heiken Ashi indicators with different timeframes
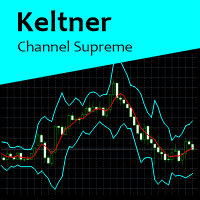
Keltner Channel Supreme is a indicator based on Keltner Channels, with some configuration besides period and Keltner multiplier factor. In this indicator, it is possible to change to an exponential moving average and if prices will be calculated according to close price or typical price. This indicator works on all graphics. If you have some doubt, please PM.
John Bollinger's normalized MFI (Fund Flow Index). Bollinger bands are used to calculate overbought/oversold areas. It takes three input parameters: MFI period - MFI calculation period MFI Applied Volume - Calculates the volume of MFI transactions BB period - Calculation period of the Bollinger band BB deviation - Brin deviation Calculation: NormMFI = (MFI-BL) / (TL-BL) Among them: TL = BBands(MFI, BB period, BB deviation, UPPER_BAND) BL = BBands(MFI, BB period, BB deviation, LOWER_BAND) MFI - M

Every indicator has its advantages and disadvantages. Trending ones show good signals during a trend, but lag during a flat. Flat ones thrive in the flat, but die off as soon as a trend comes. All this would not be a problem, if it was easy to predict when a flat changes to a trend and when a trend changes to a flat, but in practice it is an extremely serious task. What if you develop such an algorithm, which could eliminate an indicator's flaws and enhance its strengths? What if such an algorit
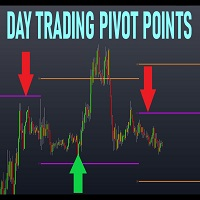
Novice ou expert, notre Turn Prof haut de gamme multi-temps améliorera votre échange et vous apportera des échanges extraordinaires, des portes ouvertes incroyables avec les niveaux d'aide et d'obstruction que les experts utilisent.
L'échange de tours est une technique simple et convaincante pour entrer et sortir du marché à des niveaux clés et est utilisé par des experts depuis assez longtemps et élimine toutes les images : Forex, Crypto, Actions, Indices, etc.
Turn Prof apporte des niveau

30% Discounted ONLY 10 COPIES HURRY UP! 8 LEFT COPIES MTF UPDATED IN NEW VERSION Note: If MTF Order Not Work just do one thing one, when you set Show_mtf to true then don't change otf timeframe instead you insert indicator and then again open setting and change current otftimeframe to other in this way it will work. It issue from Mql5 not refresh setting properly. Very precise patterns to detect High Accurate Order Blocks: It Draw zone after market Structure Breakout with a high Accuracy,
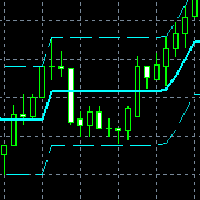
It is a new indicator that frames the price movement and tracks it. It consists of oscillation channel and its center line CL . For its calculation it is only necessary to introduce the amplitude of the channel. Because of this, it is a non-lagging indicator as it is not calculated based on a number of previous candlesticks. It removes any level of noise , showing the underlying price movement cleanly via the center line . It allows you to easily identify the beginnings a
Savez-vous pourquoi MetaTrader Market est le meilleur endroit pour vendre des stratégies de trading et des indicateurs techniques ? Pas besoin de publicité ou de protection logicielle, pas de problèmes de paiement. Tout est fourni dans le MetaTrader Market.
Vous manquez des opportunités de trading :
- Applications de trading gratuites
- Plus de 8 000 signaux à copier
- Actualités économiques pour explorer les marchés financiers
Inscription
Se connecter
Si vous n'avez pas de compte, veuillez vous inscrire
Autorisez l'utilisation de cookies pour vous connecter au site Web MQL5.com.
Veuillez activer les paramètres nécessaires dans votre navigateur, sinon vous ne pourrez pas vous connecter.