Regardez les tutoriels vidéo de Market sur YouTube
Comment acheter un robot de trading ou un indicateur
Exécutez votre EA sur
hébergement virtuel
hébergement virtuel
Test un indicateur/robot de trading avant d'acheter
Vous voulez gagner de l'argent sur Market ?
Comment présenter un produit pour qu'il se vende bien
Indicateurs techniques payants pour MetaTrader 4 - 2

L'indicateur d'inversion ADR vous montre en un coup d'œil où le prix se négocie actuellement par rapport à sa fourchette quotidienne moyenne normale. Vous recevrez des alertes instantanées par pop-up, e-mail ou push lorsque le prix dépasse sa fourchette moyenne et les niveaux supérieurs de votre choix afin que vous puissiez sauter rapidement dans les reculs et les inversions. L'indicateur trace des lignes horizontales sur le graphique aux extrêmes de la fourchette quotidienne moyenne ainsi que

PowerBall Signals est un indicateur de signaux d'ACHAT/VENTE basé sur l'idée d'utiliser des zones de support/résistance. L'indicateur détecte des modèles d'inversion spéciaux basés sur les zones de support/résistance et fournit ces signaux sur votre graphique. L'idée principale de l'indicateur est d'utiliser l'analyse MTF (Multi Time Frame) et de fournir des signaux basés sur les niveaux de votre période actuelle et suivante. Cette méthode permet de prédire d’éventuels retournements de prix sur
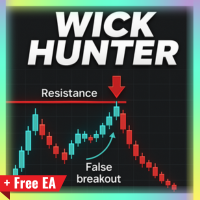
After purchase, you are eligible to receive EA Forex Proton and try it for 14 days completely FREE! This robot automates the alerts from Wick Hunter!
Tired of getting trapped by false breakouts? Wick Hunter is a powerful custom indicator designed to detect fakeouts and identify true reversals before the crowd catches on. Built on the proven False Breakout Strategy , Wick Hunter helps you: Spot liquidity grabs and stop-hunts Enter with precision near wicks Avoid fake breakouts that ruin trades
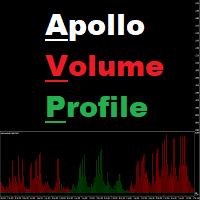
Apollo Volume Profile est un indicateur qui détermine la direction du mouvement du marché en utilisant l'analyse du volume. L'indicateur est très facile à utiliser. Cet indicateur montre clairement le ratio de vendeurs et d'acheteurs sur le marché, en fonction du laps de temps utilisé. L'indicateur peut être utilisé comme base pour tout système commercial. L'indicateur ne redessine pas ses signaux. Cet indicateur peut être utilisé pour négocier tous les instruments financiers tels que les devise

SENSE est un système automatisé qui combine des méthodes GANN sélectionnées avec des calculs fractals. Le système nous indique où ouvrir et fermer les transactions. Plus besoin de perdre du temps avec des calculs complexes - SENSE fait tout pour vous. Il suffit d'installer l'indicateur.
Principes de base :
Le marché est haussier lorsque le prix se situe au-dessus des lignes blanches.
Acheter au-dessus des lignes blanches, s'arrêter en dessous Les lignes vertes sont des objectifs de hausse L

L'indicateur ADX est utilisé pour déterminer la tendance et sa force. La direction du prix est indiquée par les valeurs +DI et -DI, et la valeur ADX montre la force de la tendance. Si +DI est supérieur à -DI, alors le marché est dans une tendance haussière, si au contraire, c'est une tendance baissière. Si l’ADX est inférieur à 20, il n’y a pas de direction définie. Dès que l'indicateur dépasse ce niveau, une tendance de force moyenne commence. Les valeurs supérieures à 40 indiquent une ten

Modification multidevises et multitemporelles de l'oscillateur stochastique. Vous pouvez spécifier les devises et les délais souhaités dans les paramètres. Le panneau affiche les valeurs actuelles et les intersections des lignes — Signal et Principal (croisement stochastique). En outre, l'indicateur peut envoyer des notifications lors du franchissement des niveaux de surachat et de survente. En cliquant sur une cellule avec un point, ce symbole et ce point seront ouverts. Il s'agit du scanner M

Forex Breath System est un système de trading basé sur les tendances qui peut être utilisé sur n'importe quel marché. Vous pouvez utiliser ce système avec des devises, des métaux, des matières premières, des indices, des cryptomonnaies et même des actions. Il peut également être utilisé à tout moment. Le système est universel. Il montre la tendance et fournit des signaux fléchés avec la tendance. L'indicateur peut également vous fournir un type spécial d'alertes lorsque les signaux apparaissent

Guide d'utilisation du Candle Probability Scalper Ce indicateur rend le scalping facile et 100% intuitif. Candle Probability Scalper vous montrera en un coup d'œil les pourcentages de force des acheteurs et des vendeurs en TEMPS RÉEL sur la bougie actuelle. Les pourcentages sont mis à jour à chaque tick, ce qui signifie que vous saurez, seconde après seconde, ce que fait la majorité des acheteurs et des vendeurs, sans aucun délai. Cela vous aidera énormément à déterminer ou à confirmer la force

Apollo BuySell Predictor est un système de trading professionnel qui comprend plusieurs modules de trading. Il fournit au trader des zones de cassure uniques, des niveaux de support et de résistance basés sur Fibonacci, une ligne de tendance pivot, des signaux de volume de retrait et d'autres fonctionnalités utiles dont tout trader a besoin au quotidien. Le système fonctionnera avec n'importe quelle paire. Les délais recommandés sont M30, H1, H4. Bien que l'indicateur puisse également fonctionne

Wave Synchronizer - indicateur visuel de l'analyse des vagues. Combine les séquences de mouvements de chandeliers et produit des modèles d'ondes directionnelles, produisant des mouvements synchrones avec le marché.
Le début de chaque vague commence par une flèche de signal, il y a aussi des notifications.
L'indicateur ne redessinera ni ne déplacera jamais les flèches sur l'historique passé.
Des flèches de signal apparaissent à la clôture de la bougie.
S'adapte pour fonctionner avec tous les ins

This indicator Super Channel Pro Pluss indicator.Indicator displays trend movement. Indicator calculates automatically line. Features
FiltPer - displays indicator channel period. deviation - displays indicator channel deviation. deviation2 - displays indicator channel deviation. deviation3 - displays indicator channel deviation. How to understand the status: If the arrow is up and line color Teal ;trend is up. If the arrow is down and line color Red; trend is down. If the arrow is Yellow close
Apollo Binary Options Indicator est un indicateur de signal pour le trading d'options binaires. Le signal arrive à l'ouverture de la bougie actuelle et est valable jusqu'à sa fermeture. Le signal est accompagné d'une flèche ainsi que d'un message de signal directement sur votre carte. Le délai d'expiration de l'option recommandé est d'une bougie. Autrement dit, si le graphique est H1, le délai d'expiration sera de 1 heure. Si le graphique est M5, le délai d'expiration de l'option sera de 5 minut
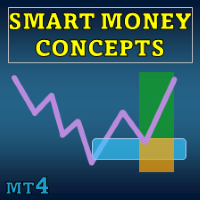
Special offer : ALL TOOLS , just $35 each! New tools will be $30 for the first week or the first 3 purchases ! Trading Tools Channel on MQL5 : Join my MQL5 channel to update the latest news from me SMC est une approche de trading qui aide les traders à identifier les zones de liquidité, les positions des ordres institutionnels et les points de retournement clés du marché. En utilisant les principes du SMC, les traders peuvent naviguer plus efficacement sur le marché, trouvant les m

Volume Break Oscillator est un indicateur qui fait correspondre le mouvement des prix aux tendances des volumes sous la forme d'un oscillateur.
Je souhaitais intégrer l'analyse des volumes dans mes stratégies mais j'ai toujours été déçu par la plupart des indicateurs de volume, tels que l'OBV, le Money Flow Index, l'A/D mais aussi le Volume Weighted Macd et bien d'autres. J'ai donc écrit cet indicateur pour moi-même, je suis satisfait de son utilité, et j'ai donc décidé de le publier sur le ma

Tout d'abord, il convient de souligner que cet outil de trading est un indicateur non repeint, non redessiné et non retardé, ce qui le rend idéal pour le trading professionnel. Cours en ligne, manuel utilisateur et démonstration. L'indicateur Smart Price Action Concepts est un outil très puissant à la fois pour les nouveaux et les traders expérimentés. Il regroupe plus de 20 indicateurs utiles en un seul, combinant des idées de trading avancées telles que l'analyse du trader Inner Circle et les

Universal Swing Arrows est un indicateur basé sur des flèches conçu pour fournir des signaux de swing trading. Il peut être utilisé pour n'importe quelle paire de trading et n'importe quelle période de trading. LES FLÈCHES APPARAISSENT SUR LA BOUGIE ACTUELLE (0). LES SIGNALISATIONS NE REPEIGNENT PAS ! L'indicateur peut être utilisé comme système de trading autonome ou dans le cadre de votre stratégie de trading personnelle. La flèche de l'indicateur n'est pas seulement un signal mais c'est aussi

Special offer - https://www.mql5.com/en/users/bossik2810/news Quantum Entry is a powerful price action trading system built on one of the most popular and widely known strategies among traders: the Breakout Strategy! This indicator produces crystal clear buy and sell signals based on breakouts of key support and resistance zones. Unlike typical breakout indicators, it uses advanced calculations to accurately confirm the breakout! When a breakout occurs, you receive instant alerts. No lag and n

Special offer : ALL TOOLS , just $35 each! New tools will be $30 for the first week or the first 3 purchases ! Trading Tools Channel on MQL5 : Join my MQL5 channel to update the latest news from me Découvrez la puissance du concept Inversion Fair Value Gap (IFVG) de l’ICT avec l’ Indicateur Inversion Fair Value Gaps ! Cet outil de pointe pousse les Fair Value Gaps (FVG) à un niveau supérieur en identifiant et affichant les zones de FVG inversées — des zones clés de support et de ré

Advanced Currency Strength Indicator
The Advanced Divergence Currency Strength Indicator. Not only it breaks down all 28 forex currency pairs and calculates the strength of individual currencies across all timeframes , but, You'll be analyzing the WHOLE forex market in 1 window (In just 1 minute) . This indicator is very powerful because it reveals the true movements of the market. It is highly recommended to analyze charts knowing the performance of individual currencies or the countries eco

Un modèle de graphique en triangle symétrique représente une période de contraction et de consolidation avant que le prix ne soit forcé de casser à la hausse ou de s'effondrer. Une cassure de la ligne de tendance inférieure marque le début d'une nouvelle tendance baissière, tandis qu'une cassure de la ligne de tendance supérieure indique le début d'une nouvelle tendance haussière. Obtenez le tableau de bord pour surveiller tous les instruments et les délais que vous échangez contre des modèles

VR Cub est un indicateur permettant d'obtenir des points d'entrée de haute qualité. L'indicateur a été développé pour faciliter les calculs mathématiques et simplifier la recherche de points d'entrée dans un poste. La stratégie de trading pour laquelle l'indicateur a été rédigé prouve son efficacité depuis de nombreuses années. La simplicité de la stratégie de trading est son grand avantage, qui permet même aux traders débutants de négocier avec succès avec elle. VR Cub calcule les points d'ouve

Currency Strength Wizard est un indicateur très puissant qui vous offre une solution tout-en-un pour un trading réussi. L'indicateur calcule la puissance de telle ou telle paire de devises en utilisant les données de toutes les devises sur plusieurs périodes. Ces données sont représentées sous la forme d'un indice de devise facile à utiliser et de lignes électriques de devise que vous pouvez utiliser pour voir la puissance de telle ou telle devise. Tout ce dont vous avez besoin est d'attacher l'

Dessine automatiquement les niveaux de support et de résistance PLUS les écarts des bougies de propulsion sur votre graphique, afin que vous puissiez voir où le prix est susceptible de se diriger ensuite et/ou de s'inverser potentiellement.
Cet indicateur est conçu pour être utilisé dans le cadre de la méthodologie de trading de position enseignée sur mon site web (The Market Structure Trader) et affiche des informations clés pour le ciblage et les entrées potentielles.
L'indicateur comporte

Le prix actuel du produit est de 49$ pour une durée limitée. Le prochain prix de Market Structure sera de 99$. Découvrez Market Structure Break Out pour MT4 – Votre indicateur professionnel MSB et Zone Non Brisée. La version MT5 de ce produit est disponible ici : https ://www .mql5 .com /en /market /product /124690 Cet indicateur est continuellement mis à jour.
Nous nous efforçons de fournir des points d'entrée et de sortie hautement précis basés sur la structure du marché. Nous en sommes maint

Multi-currency and multitimeframe Heikin Ashi indicator. Shows the current state of the market. On the scanner panel you can see the direction, strength and number of bars of the current trend. The Consolidation/Reversal candles are also shown using color. You can specify any desired currencies and periods in the parameters. Also, the indicator can send notifications when the trend changes or when reversal and consolidation candles (dojis) appear. By clicking on a cell, this symbol and period wi

Volume Profile, Footprint and Market Profile TPO (Time Price Opportunity). Volume and TPO histogram bar and line charts. Volume Footprint charts. TPO letter and block marker collapsed and split structure charts. Static, dynamic and flexible range segmentation and compositing methods with relative and absolute visualizations. Session hours filtering and segment concatenation with Market Watch and custom user specifications. Graphical layering, positioning and styling options to suit the user's a

ACTUELLEMENT 31% DE RÉDUCTION ! !
La meilleure solution pour tout débutant ou Expert Trader !
Cet indicateur est un outil de trading unique, de haute qualité et abordable car nous avons incorporé un certain nombre de caractéristiques exclusives et une formule secrète. Avec seulement UN graphique, il donne des alertes pour les 28 paires de devises. Imaginez comment votre trading s'améliorera parce que vous serez capable de repérer le point de déclenchement exact d'une nouvelle tendance ou d'un

Special offer : ALL TOOLS , just $35 each! New tools will be $30 for the first week or the first 3 purchases ! Trading Tools Channel on MQL5 : Join my MQL5 channel to update the latest news from me L'indicateur Volumetric Order Blocks Multi Timeframe est un outil puissant conçu pour les traders cherchant à obtenir des informations approfondies sur le comportement du marché en identifiant les zones clés de prix où les participants importants accumulent des ordres. Ces zones, connues

IQ FX Gann Levels a precision trading indicator based on W.D. Gann’s square root methods. It plots real-time, non-repainting support and resistance levels to help traders confidently spot intraday and scalping opportunities with high accuracy. William Delbert Gann (W.D. Gann) was an exceptional market analyst, whose trading technique was based on a complex blend of mathematics, geometry, astrology, and ancient mathematics which proved to be extremely accurate. Download the Metatrader 5 Version M
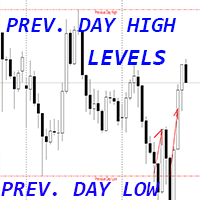
Indicateur Crypto_Forex "Niveaux haut et bas du jour précédent" pour MT4.
- L'indicateur "Niveaux haut et bas du jour précédent" est un indicateur auxiliaire très utile. - Les niveaux haut et bas d'hier sont très importants car le prix rebondit très souvent à partir d'eux. - Ces niveaux peuvent être considérés comme des supports et des résistances fiables - le prix les respecte beaucoup. - C'est un indicateur utile pour les traders intraday qui utilisent les méthodes de trading inversé et le s
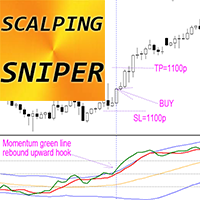
Indicateur Crypto_Forex SCALPING SNIPER pour MT4, système de trading sans repeinture. Scalping Sniper - est un système avancé (indicateur) montrant la dynamique précise des prix ! - Améliorez vos méthodes de trading avec l'indicateur professionnel Scalping Sniper pour MT4. - Ce système fournit des signaux de sniping très précis mais rares, avec un taux de gain allant jusqu'à 90 %. - Le système est censé utiliser de nombreuses paires pour rechercher des signaux afin de compenser le faible nombre

About:
Get Free Scanner and example Strategies
And understand detailed description here: https://www.mql5.com/en/blogs/post/759237
And also get example wrappers from above post. You can make your own wrappers if your indicators have complex conditions or for In-Built MT4 indicators.
Features:
- Specify your own Custom Indicator - Specify Buffer values and create Variables - Use those Variables to create your own Buy/Sell Conditions - Get Arrows Up/Down Signals - See Arrows Signals in Scanners

This is an indicator of trading sessions that can display all levels (Open-High-Low-Close) for four sessions. The indicator can also predict session levels. Sessions can be drawn with lines or rectangles (empty or filled), lines can be extended to the next session. You can easily hide/show each session by pressing hotkeys (by default '1', '2', '3', '4'). You can see ASR (Average Session Range) lines (default hotkey 'A'). This is similar to the ADR calculation, only it is calculated based on t

Supply Demand Analyzer is an advanced trading indicator meticulously designed for the precise identification, analysis, and management of supply and demand zones. By integrating real-time data and advanced algorithms, this tool enables traders to recognize market phases, price movements, and structural patterns with unparalleled accuracy. It simplifies complex market dynamics into actionable insights, empowering traders to anticipate market behavior, identify trading opportunities, and make info

** All Symbols x All Timeframes scan just by pressing scanner button ** *** Contact me to send you instruction and add you in "Market Structure group" for sharing or seeing experiences with other users. Introduction: Market structure is important for both new and professional traders since it can influence the liquidity and price action of a market (Breakout and Retest). It’s also one of the most commonly used techniques to understand trends, identify potential reversal points, and get a feel f

Indicateur cyclique pour le trading et la prévision de l'orientation du marché. Montre le comportement cyclique du prix sous la forme d'un oscillateur.
Donne des signaux pour l'ouverture des transactions lorsqu'il y a un rebond des limites supérieure et inférieure de l'oscillateur. Sous forme d'histogramme, il montre la force lissée de la tendance.
Complètera toute stratégie de trading, du scalping à l'intraday. L'indicateur n'est pas redessiné. Convient pour une utilisation sur tous les sym

M1 EASY SCALPER est un indicateur de scalping conçu spécifiquement pour l'unité de temps de 1 minute (M1), compatible avec toutes les paires de devises ou instruments disponibles sur votre terminal MT4. Bien sûr, il peut également être utilisé sur n'importe quelle autre unité de temps, mais il fonctionne particulièrement bien en M1 (ce qui est complexe !) pour le scalping. Note : si vous faites du scalping, assurez-vous d’avoir un compte adapté à cet effet. Évitez les comptes Cent ou Standard ca

Gold Trend - il s'agit d'un bon indicateur technique boursier. L'algorithme de l'indicateur analyse le mouvement du prix d'un actif et reflète la volatilité et les zones d'entrée potentielles.
Les meilleurs signaux de l'indicateur:
- Pour la VENTE = histogramme rouge + pointeur SHORT rouge + flèche de signalisation jaune dans la même direction. - Pour l'ACHETER = histogramme bleu + pointeur LONG bleu + flèche de signalisation aqua dans la même direction.
Avantages de l'indicateur:
1. L'
Special offer : ALL TOOLS , just $35 each! New tools will be $30 for the first week or the first 3 purchases ! Trading Tools Channel on MQL5 : Join my MQL5 channel to update the latest news from me I. Introduction
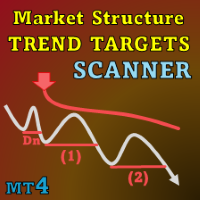
Market Structure Trend Targets Scanner est un outil puissant pour analyser les tendances du marché, identifier les points de rupture et gérer les risques grâce à un stop loss dynamique. En suivant les hauts et les bas précédents pour identifier les ruptures, cet outil ai

NEW YEAR SALE PRICE FOR LIMITED TIME!!! Please contact us after your purchase and we will send you the complimentary indicators to complete the system Cycle Sniper is not a holy grail but when you use it in a system which is explained in the videos, you will feel the difference. If you are not willing to focus on the charts designed with Cycle Sniper and other free tools we provide, we recommend not buying this indicator. We recommend watching the videos about the indiactor and system before pu

L' indicateur ICT Asian Range est un outil puissant conçu pour aider les traders à identifier les structures de marché clés et les zones de liquidité grâce à la stratégie de trading ICT Asian Range. Il indique les niveaux de prix les plus élevés et les plus bas de la séance asiatique (de 19h à minuit, heure de New York) et fournit des informations essentielles sur les mouvements de marché pour les séances suivantes. Cet indicateur améliore la précision des transactions en mettant en évidence

Introduction to X3 Chart Pattern Scanner X3 Cherart Pattern Scanner is the non-repainting and non-lagging indicator detecting X3 chart patterns including Harmonic pattern, Elliott Wave pattern, X3 patterns, and Japanese Candlestick patterns. Historical patterns match with signal patterns. Hence, you can readily develop the solid trading strategy in your chart. More importantly, this superb pattern scanner can detect the optimal pattern of its kind. In addition, you can switch on and off individu
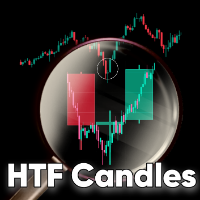
HTF Candles MT4 est un indicateur pour MT4 qui trace le contour des bougies de période supérieure (HTF) directement sur les bougies de période inférieure, y compris toute période HTF de MT5 choisie. L'indicateur vous offre la possibilité d'afficher ou non la bougie HTF actuelle en temps réel, sans décalage ni repainting. Fonctionnalités Bougies des Périodes MT5 : Trace les bougies de n'importe quelle période MT5 (ex : m3, m5, m12, m15, m20...) sur la période inférieure. Option Heiken Ashi

Multicurrency and multitimeframe modification of the indicator Bollinger Bands. On the dashboard you can see breakouts and touches of the Bollinger Bands. In the parameters you can specify any desired currencies and timeframes. The indicator can also send notifications when the price touches the Bollinger Bands, when the current volatility changes (expands or falls), and when the price touches all the bands. By clicking on a cell with a period, this symbol and period will be opened. This is MTF

French Indicateur Speed Scalp – Sans Repaint
Parfait pour le trading rapide sur l’or et les unités de temps courtes L’ indicateur Speed Scalp est conçu pour un scalping rapide et précis sur des graphiques de 30 minutes et moins . Il est particulièrement efficace sur l’ or (XAUUSD) . Meilleurs timeframes : 30M, 15M, 5M, 1M
Optimisé pour XAUUSD
Alertes de signaux instantanées
Sans repaint – signaux fiables
Parfait pour les entrées rapides
Système d’alerte intégré

[ MT5 Version ] [ Kill Zones ] [ SMT Divergences ] How to trade using Order Blocks: Click here
User Interface Performance: During testing in the strategy tester, the UI may experience lag. Rest assured, this issue is specific to the testing environment and does not affect the indicator's performance in live trading. Elevate your trading strategy with the Order Blocks ICT Multi TF indicator, a cutting-edge tool designed to enhance your trading decisions through advanced order block analys

WaveTrend Momentum Oscillator is an upgrade to the popular and easy-to-use WaveTrend Oscillator. The WaveTrend Momentum Oscillator adds a momentum component to the original WaveTrend calculation, in order to provide faster and more accurate entry points during trendy market conditions. Do you prefer the original WaveTrend Oscillator? The WaveTrend Momentum Oscillator allows you to switch between momentum and original WT versions. Both provide valuable information depending on the market conditio

Oscillateur de Tendance : Identification Fluide et Fiable des Tendances de Marché L’Oscillateur de Tendance est un indicateur avancé pour MT4, conçu pour aider les traders à identifier avec précision la direction de la tendance et les points de retournement potentiels. Avec une représentation visuelle intuitive, cet indicateur montre clairement quand le marché est en tendance haussière ou baissière, simplifiant ainsi l’analyse et améliorant la lisibilité du graphique. Adapté à une grande variété
Économisez du temps et prenez des décisions plus précises avec Sweet VWAP Aux Si vous n'avez pas encore téléchargé notre indicateur VWAP gratuit pour Metatrader 4 , faites-le maintenant et découvrez ses incroyables capacités de visualisation de VWAP ancrées. Ensuite, revenez ici et découvrez Sweet VWAP Aux - l'extension parfaite pour votre indicateur Sweet VWAP. Avec un simple clic, Sweet VWAP vous permet de fixer cet indicateur VWAP au point de votre choix, en économisant du temps et en élimina
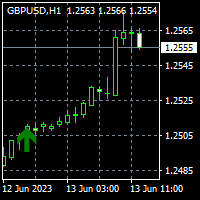
To get access to MT5 version please click here . This is the exact conversion from TradingView: "UT Bot Alerts" by "QuantNomad". The screenshot shows 95% similar results from tradingview and Metatrader when tested on ICMarkets on both platforms. It should be 100%. However I realized there are small difference between quotes even if brokers are the same. This is strange... I think the indicator logic is very data dependent. I have done quite a lot of conversions from tradingview and do not see an

Enjoy a 50% OFF Christmas holiday sale!
You can visually backtest Elliot Wave Impulse to see how it behaved in the past! Manual guide: Click here This indicator is unstoppable when combined with our other indicator called Katana . After purchase, send us a message and you could get it for FREE as a BONUS! The Elliot Wave Impulse is a pattern identified in the Elliott Wave Theory, a form of technical analysis used to analyze financial market cycles. The Impulse Wave is consider

Volatility Master for MetaTrader is a real-time dashboard tool that scans up to 30 symbols to identify high-volatility, trending markets instantly. With clear bullish/bearish signals, customizable alerts, and a user-friendly interface, it helps you avoid range-bound conditions and focus on high-probability trades. Clarity leads to confidence. This is your chance to trade confidently and protect your capital effectively, don't miss the opportunity that you might regret later! Download Metatrader

Available for MT4 and MT5 . Join the Market Structure Patterns channel to download materials available for study and/or additional informations.
Related posts: Market Structure Patterns - Introduction Market Structure Patterns is an indicator based on smart money concepts that displays SMC/ICT elements that can take your trading decisions to the next level. Take advantage of the alerts , push notifications and email messages to keep informed from when an element is fo

RSI Divergence Full +10 other divergence indicators
Contact me after payment to send you the User-Manual PDF File. Download the MT5 version here. Also you can download the >>> Hybrid Trading EA <<< that is designed and implemented based on RSI Divergence Indicator. RSI is a pretty useful indicator in itself but it's even more effective when you trade divergence patterns with that. Because the divergence signal of the RSI indicator is one of the most powerful signals among the indicators. Di

Early reversals made easy A personal implementation of Order Blocks, a simple yet effective position trading strategy. The trader should enter the market or look for trades in the direction of the last order block, if the price range has not been breached in the opposite direction of the breakout. Open blocks are not drawn for clarity.
[ Installation Guide | Update Guide | Troubleshooting | FAQ | All Products ] A bullish open block is the first bullish bar after a fresh market low A bearish ope

L'indicateur KT Asian Breakout analyse une partie clé de la session asiatique afin de générer des signaux d'achat et de vente dans les deux directions en fonction de la cassure du prix. Un signal d'achat est déclenché lorsque le prix dépasse le plus haut de la session, tandis qu'un signal de vente est déclenché lorsque le prix casse le plus bas de la session.
Points importants à retenir
Si la boîte de session est trop large verticalement, il est préférable d’éviter une nouvelle entrée, car la m

note: this indicator is for METATRADER4, if you want the version for METATRADER5 this is the link: https://www.mql5.com/it/market/product/108106 TRENDMAESTRO ver 2.4 TRENDMAESTRO recognizes a new TREND in the bud, he never makes mistakes. The certainty of identifying a new TREND is priceless. DESCRIPTION TRENDMAESTRO identifies a new TREND in the bud, this indicator examines the volatility, volumes and momentum to identify the moment in which there is an explosion of one or more of these data a

IQ Gold Gann Levels a non-repainting, precision tool designed exclusively for XAUUSD/Gold intraday trading. It uses W.D. Gann’s square root method to plot real-time support and resistance levels, helping traders spot high-probability entries with confidence and clarity. William Delbert Gann (W.D. Gann) was an exceptional market analyst, whose trading technique was based on a complex blend of mathematics, geometry, astrology, and ancient mathematics which proved to be extremely accurate. Download

"SOLVE ALL YOUR PROBLEMS FOREVER WITH THIS UNIQUE TRADING INDICATOR!" Additional Bonus: You get the ProTrading Arrow indicator for FREE! The one who makes money from the forex market, wins by doing something very simple, he wins 6 out of every 10 trades. Of course you need a good indicator and proper money management, if you ever hope to become a profitable trader. Trend Reversing PRO indicator tells you when it is time to trade giving you perfect arrows along the trend to always be on the winni

Support And Resistance Screener est dans un indicateur de niveau pour MetaTrader qui fournit plusieurs outils à l'intérieur d'un indicateur. Les outils disponibles sont : 1. Filtre de structure de marché. 2. Zone de repli haussier. 3. Zone de recul baissier. 4. Points pivots quotidiens 5. points pivots hebdomadaires 6. Points pivots mensuels 7. Support et résistance forts basés sur le modèle harmonique et le volume. 8. Zones au niveau de la banque. OFFRE D'UNE DURÉE LIMITÉE : L'indicateur de sup

Ultimate Divergence Scanner (Multi Pair And Multi Time Frame) : ---LIMITED TIME OFFER: NEXT 25 CLIENTS ONLY ---46% OFF REGULAR PRICE AND 2 FREE BONUSES ---SEE BELOW FOR FULL DETAILS It is a widely known market principle that momentum generally precedes price.
Making divergence patterns a clear indication that price and momentum are not in agreement.
Divergence patterns are widely used by institutional traders around the world. As they allow you to manage
your trades within strictly defin
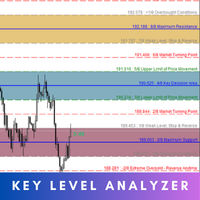
Key Level Analyzer – Know Better, Trade Smarter Key Level Analyzer is a powerful trading tool designed to provide precise market insights by identifying high-probability price zones , market turning points , and key decision areas . Unlike traditional indicators, it uses a smart algorithm to dynamically calculate support, resistance, and balance zones, helping traders make informed, data-driven decisions . MT5 Version - https://www.mql5.com/en/market/product/132810/ With real-time updates, mul

Ce tableau de bord est un outil d'alerte à utiliser avec l'indicateur d'inversion de structure de marché. Son objectif principal est de vous alerter des opportunités d'inversion sur des périodes spécifiques et également des nouveaux tests des alertes (confirmation) comme le fait l'indicateur. Le tableau de bord est conçu pour s'asseoir sur un graphique et fonctionner en arrière-plan pour vous envoyer des alertes sur les paires et les délais que vous avez choisis. Il a été développé après que de

un indicateur de trading binaire basé sur le croisement 3ma avec macd, il donne des signaux d'achat et de vente à l'ouverture de la barre et il ne repeint ni ne peint en arrière
l'indicateur ne se concentre pas sur un taux de victoire élevé car il est conçu pour le trading de martingale, l'indicateur se concentre sur le nombre de signaux perdants le plus bas d'affilée.
Stratégie :
Le dépôt minimum est de 1 000 unités, nous commençons le trading avec 1 unité (la taille de la transaction est de 1
Indicateur Big Candle Scanner Dashboard MT4 Aperçu Le Big Candle Scanner Dashboard MT4 est un outil puissant permettant d'analyser plusieurs paires de devises et unités de temps afin de détecter les grandes bougies haussières et baissières. Cet indicateur aide les traders à identifier rapidement les points potentiels de cassure ou de retournement. Le scanner prend en charge toutes les paires de devises majeures, mineures et exotiques, y compris les actifs populaires tels que BTCUSD et XAUUSD. Il

This Simple Smart Money Concepts indicator displays real-time market structure (internal & swing BOS / CHoCH), order blocks, premium & discount zones, equal highs & lows, and much more...allowing traders to automatically mark up their charts with widely used price action methodologies.
"Smart Money Concepts" (SMC) is used term amongst price action traders looking to more accurately navigate liquidity & find more optimal points of interest in the market. Trying to determine where institutional

** All Symbols x All Time frames scan just by pressing scanner button ** *** Contact me to send you instruction and add you in "Harmonic Scanner group" for sharing or seeing experiences with other users. Introduction Harmonic Patterns are best used to predict turning point. Harmonic Patterns give you high win rate and high opportunities for trade in during one day. This indicator detects the best and successful patterns base on Harmonic Trading books . The Harmonic Patterns Scanner Scans All ch

MT4 Multi-timeframe Order Blocks detection indicator. Features - Fully customizable on chart control panel, provides complete interaction. - Hide and show control panel wherever you want. - Detect OBs on multiple timeframes. - Select OBs quantity to display. - Different OBs user interface. - Different filters on OBs. - OB proximity alert. - ADR High and Low lines. - Notification service (Screen alerts | Push notifications). Summary Order block is a market behavior that indicates order collection

Enjoy a 50% OFF Christmas holiday sale!
This indicator is unstoppable when combined with our other indicator called Katana. After purchase, send us a message and you could get Katana for FREE as a BONUS After purchase, send us a private message for your instructions. The Trend Forecasting indicator is a very unique & easy tool that is able to make prediction about future price movement based on the signals generated by MACD . It helps you have an estimation on the areas that the price ma
Le MetaTrader Market est un site simple et pratique où les développeurs peuvent vendre leurs applications de trading.
Nous vous aiderons à publier votre produit et vous expliquerons comment préparer la description de votre produit pour le marché. Toutes les applications de Market sont protégées par un cryptage et ne peuvent être exécutées que sur l'ordinateur de l'acheteur. La copie illégale est impossible.
Vous manquez des opportunités de trading :
- Applications de trading gratuites
- Plus de 8 000 signaux à copier
- Actualités économiques pour explorer les marchés financiers
Inscription
Se connecter
Si vous n'avez pas de compte, veuillez vous inscrire
Autorisez l'utilisation de cookies pour vous connecter au site Web MQL5.com.
Veuillez activer les paramètres nécessaires dans votre navigateur, sinon vous ne pourrez pas vous connecter.