Regardez les tutoriels vidéo de Market sur YouTube
Comment acheter un robot de trading ou un indicateur
Exécutez votre EA sur
hébergement virtuel
hébergement virtuel
Test un indicateur/robot de trading avant d'acheter
Vous voulez gagner de l'argent sur Market ?
Comment présenter un produit pour qu'il se vende bien
Indicateurs techniques pour MetaTrader 4 - 38

This indicator is a tool to measure the relative strength of different currency pairs. It present major currencies strength value base on their relative strength/weakness in custom period of time.
Indicator parameters Strength Period - Change the strength period in the settings affects the number of bars used for calculation. The higher the period value, the smoother the indicator lines and the result will represent longer term strength of each currencies, rather than recent strength. Display O
FREE
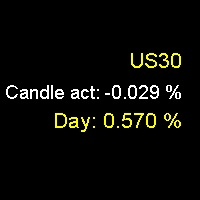
Daily Percentage and Current Candle Would you like to know how much an asset has risen or fallen in a day or in the last candle? Do you want a numerical reference for the strength and direction of price movement? Then, the Daily Percentage and Current Candle indicator is the tool you need. The Daily Percentage and Current Candle indicator shows you the percentage increase or decrease of an asset in the current day or in the last candle, depending on the timeframe you choose. The indicator allows
FREE
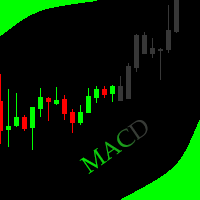
This indicator allows to hide MACD oscillator (on all MT4 timeframes) from a date define by the user, with a vertical line (Alone) or a panel (with "Hidden Candles"). Indicator Inputs: Fast EMA Period Slow EMA Period Signal SMA Period Apply To Information on "MACD" indicator is available here: https://www.metatrader4.com/en/trading-platform/help/analytics/tech_indicators/macd ************************************************************* Hey traders!! Give me your feeds! We are a community h
FREE

Here is the most unpretentious indicator to use, but one of the most useful. It signals the near reversal of the growing volatility. It is volatility that gives income to the trader. The indicator is especially useful for those who do not want to wait for the right moment in front of the monitor. The indicator is installed on the charts M15 and M30. According to the observations on these timeframes, it best fixes the approach of wide price waves. Well-established on the USDZAR currency pair (Att
FREE

A BB indicator with MA options
You're no longer limited to the built in default of using BB off a SMA method, now you can choose from SMA-EMA-SMMA-LWMA. You now also have up to 3 standard deviation levels, with price labels.
Options: - MTF - moving average type SMA-EMA-SMMA-LWMA - 3 adjustable deviation levels
- separate coloring to lines and texts
Troubleshooting: - If there are any issues or suggestions for the indicator, please comment and let me know. The feedback will be noted and consid
FREE

(traduction Google) Cet indicateur implémente l'original " Average True Range (ATR) " développé par John Welles Wilder Jr. , tel que décrit dans son livre— Nouveaux concepts dans les systèmes techniques de trading [1978] . Il utilise la moyenne mobile de Wilder , également connue sous le nom de moyenne mobile lissée (SMMA) , au lieu d'une moyenne mobile simple (SMA) tel qu'utilisé sur l'indicateur ATR intégré de MetaTrader . La période par défaut appliquée est de 7, au lieu de 14, selon la descr
FREE

Trend indicator. The indicator identifies the major price movement trends and market them with different colors. It filters out and ignores the noise and short-term movements of the price against the main trend. This indicator is a tool that identifies the current trend in the market. With the default settings, the ascending ("bullish") trends are marked with green lines and the descending ("bearish") trends are marked with red lines. The indicator ignored sideways or flat movements, when the pr
FREE
NOTE : This Free version only works for the EURUSD & AUDUSD Symbol !
MT4 Version Available Here: https://www.mql5.com/en/market/product/43438
MT5 Version Available Here: https://www.mql5.com/en/market/product/50255
Telegram Channel & Group : https://t.me/bluedigitsfx
V.I.P Group Access: Send Payment Proof to our Inbox
Recommended Broker: https://eb4.app/BDFXOsprey
* Breakthrough Solution For Reversal Trading And Filtering With All Important Features Built Inside One Tool! BlueDi
FREE
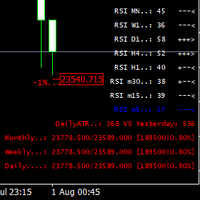
This indicator was created most for personal use. I decided to look up the last 3 bars of RSI, it is good for scalping or for weekly trading and looks as universal fx-toy. In menu you can turn on daily percentage gain info, it is good for crypto as for me, weekly and monthly gains also included as informers. Short ATR helps to determine when price was stopped and entry for pulse pump/dump. The filter of numbers of RSI can be tuned for overbought/oversold values with colors you needed. Exam
FREE

This classic "old school" MAGIC MACD indicator gives you the cross of the parameters you set. Standart setting is (12,26,9) . The arrows give you a possible change of trend. Be careful and do not use this indicator as a single signal source.
FREE version Please feel free to check out our other REX indicator series. We do have other free indicators.
"OLD BUT GOLD"
FREE

This indicator idea comes from Tushar Chande called Qstick.
Technical indicators quantify trend direction and strength in different ways.
One way is to use the difference between close and open for each bar and to sum it up over a period of time.
The formual is:
Qstick (period ) = Average ((close-open ), period )
In this indicator, we can choose how to calculate body by two famous chart types. The first and default indicator settings are based on Heiken Ashi chart, and the second is based
FREE

O Afastamento da Média Móvel, é uma poderosa ferramenta de análise técnica projetada para fornecer uma representação visual do afastamento entre o preço atual e uma média móvel específica. Este indicador, desenvolvido para o MetaTrader, oferece aos traders uma perspectiva clara das mudanças na dinâmica de preço em relação à tendência de médio prazo. Versão MT5: https://www.mql5.com/pt/market/product/111704
FREE

As the title says, this is an indicator that shows the current open market (session). It has 4 sessions with customizable schedule : 1. London session, 2. New York session, 3. Sydney session, 4. Tokyo session.
Indicator inputs: - The color of each session. - The open time and close time of the sessions. - The line width.
The objective of the indicator, is to follow each sessions, observe at what times are multiple sessions open, and thus take the chance of the high market movements.
FREE

Relative Strength Index Cross [RSI Cross] A combination of 2 RSI to create a crossover trading setup Input parameters: signal mode: set it to true if you want to plug it into STAT (Signal Tester and Trader) arrow shift: distance between fast EMA line to arrow on chart price line filter fast RSI period slow RSI period RSI price method price upper level price lower level You can find the best setting for 4 hour EURUSD on this video
FREE

Traditional Moving Average (SMA, EMA, SMMA, LWMA...) is very useful for identifying trends, but what will you do when you want to trade on lower timeframe, and you need to identify the bigger trend by a higher timeframe; Of course, you can make it by dividing your chart in separated windows, but your analytics will not be clear and intuitive ... That's why we build the Multi Timeframe Moving Average indicator.
With Multi Timeframe Moving Average ( MTF_Moving Average ), you can determine the Mo
FREE

Индикатор сглаженного Stochastic Oscillator (xStoh)
Входные параметры: xK Period - K период xD Period - D период xSlowing - замедление xMethod - метод усреднения (0-SMA | 1-EMA | 2-SMMA | 3 - LWMA) xPrice field - тип цены (0 - Low/High | 1 - Close/Close) Принцип работы
Индикатор перерассчитывает стандартный технический индикатор Stochastic Oscillator (дважды усредняет получаемые значения iStochastic).
FREE
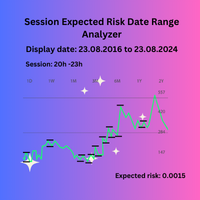
Session Expected Risk Date Range Analyzer: Analyzes price data across specified date ranges to provide detailed insights into financial risk and volatility, using each bar's price metrics for accurate risk assessment.
The Session Expected Risk Date Range Analyzer is a sophisticated tool designed to offer traders and analysts detailed insights into the expected financial risk across specific date ranges. Unlike traditional session-based analysis, this indicator focuses on calculating risk metr
FREE

The purpose of this new version of the MT4 standard indicator provided in your platform is to display in a sub-window multiple timeframes of the same indicator. See the example shown in the picture below. But the display isn’t like a simple MTF indicator. This is the real display of the indicator on its timeframe. Here's the options available in the FFx indicator: Select the timeframes to be displayed (M1 to Monthly) Define the width (number of bars) for each timeframe box Alert pop up/sound/ema
FREE
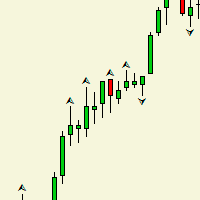
Индикатор рисует на графике фрактал, и в чем отличие между обычным фракталом? спросите вы. Ответ таково,_ после формирования второго бара фрактал рисуется и не удаляется в отличие от обычного. Данный индикатор создан в целях расширения Торгового робота. Она составляет одним из важнейших частью робота. Таким как выход из торгов. У индикатора нет входных параметров.
FREE

This indicators when combine with its slave version can help you a better view in backtesting visual mode. https://www.mql5.com/en/market/product/61574 They will help you in developing a multi time frame trading strategy. 1) Run backtest in visual mode 2) Add the master indicator to the backtesting chart 3) Add the slave indicators to other charts of the same symbol with different time frames. Run the backtest and you will see all the charts auto scrolling.
FREE
红黄绿简明指示趋势与震荡指标升级版。 使用红黄绿三色来标示上升趋势 、震荡、下跌趋势。 红色表示空头趋势(下跌)。 绿色表示多头趋势(上涨)。 黄色表示震荡区域。 从黄色转变为红色时,行情可能从震荡转变为下跌趋势。一段连续的红色,说明下跌趋势很强。 从黄色转变为绿色时,行情可能从震荡转变为上升趋势。一段连续的绿色,说明上升趋势很强。 指标的上半部分区域和下半部分区域若同步为红色,表明下跌趋势已经形成共振,接下来大概率走出一段空头趋势。 同时,红绿黄分为上下两部分:
若上下部分同时为绿色,表明上涨趋势已经形成共振,接下来大概率走出一段多头趋势。 若上下部分同时为红色,表明下跌趋势已经形成共振,接下来大概率走出一段空头趋势。
若上下同时为黄色,表明当前行情为震荡。 升级版2.0: 新增两条快慢线。 当慢线(Blue/Red线)为蓝色时,视为多头行情。当慢线为红色时,视为空头行情。 当快线(DarkGray线)从下方向上穿过慢线时,作为参考做多信号,激进交易者可进场做多。反之亦然。
参数可调。 //+---------------------------------------------
FREE

This indicator resolves an unrecognised defect in the Commodity Channel Index Oscillator (CCI). The CCI is based on a high pass filter calculated by subtracting the p-period simple moving average of a price signal (usually typical value) from the price signal itself. Then, the result is divided by the absolute mean deviation of the same period. The frequency response of a signal minus its simple moving average is shown in the first screen shot (in Blue). (see my free indicator : Q n D Frequency
FREE

Индикатор "INFO Spread Swaзp Info Panel" для MT4, вспомогательный инструмент для торговли.
- Индикатор показывает текущий спред и свопы валютной пары, к которой он прикреплен. Также идикатор показывает: 1. Дату и время сервера 2. Название сервера 3. Название влютной пары. 4. Спред 5. Своп 6. Открытые позиции 7. Отложенные ордера 8. Максимальная просадка после открытия индикатора 9. 30% от депозита. (можно менять) Можно менять положение, размер, цвет шрифта, расстояние между строками.
FREE

Êtes-vous fatigué d'être un Wall Street wanna-be, de remettre en question constamment vos échanges ? Eh bien, mettez la boule de cristal de côté et entrez dans le 21ème siècle avec l'indicateur "Current Support and Resistance" pour MT4 ! Ce mauvais garçon sera votre fidèle acolyte, analysant le marché avec une profondeur qui rendrait jaloux Sherlock Holmes. Mais ce n'est pas juste un tour de poney, oh non. Il a des options, bébé ! Vous voulez voir les niveaux de résistance et de support sur le g
FREE
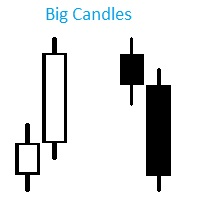
Индикатор Big Candles показывает кратное превышение размера свечи относительно среднего показателя рассчитанного за определенный период. Индикатор отмечает размер свечи на графике в пипсах и сигнализирует о появлении “большой” свечи. Описание параметров: HistoryBars - Количество баров для отображения индикатора countN - Период расчета среднего размера свечи f actor - Во сколько раз длина свечи превышает средннее значение, для отображения сигнала
FREE

The purpose of this new version of the MT4 standard indicator provided in your platform is to display in a sub-window multiple timeframes of the same indicator. See the example shown in the picture below. But the display isn’t like a simple MTF indicator. This is the real display of the indicator on its timeframe. Here's the options available in the FFx indicator: Select the timeframes to be displayed (M1 to Monthly) Define the width (number of bars) for each timeframe box Alert pop up/sound/ema
FREE

Active Price Lines
Indicator gives you full custom control over the Bid and Ask price lines, both color and style. Color control is also customizable based on increased or decreased price by the tick.
Options include: Show both the Bid line and the Ask line Set unique color for each Set unique line style for each Set unique color for increased price (by the tick) Show only Bid line Show only Ask line
Rider Capital Group
FREE

Introduction and Description
The indicator displays an arrow whenever a " Bearish Engulfing " is detected. The latter usually indicates the beginning of a downward trend. A bearish engulfing pattern is a technical chart pattern that signals lower prices to come. The pattern consists of an up candlestick followed by a large down candlestick that eclipses or "engulfs" the smaller up candle. The pattern can be important because it shows sellers have overtaken the buyers and are pushing the price mo
FREE

The indicator is based on the materials taken from the book: Bill Williams. Trading Chaos: Applying Expert Techniques to Maximize Your Profit. The indicator values at the top of each bar are calculated based on the location of the Open and Close relative to a third of the bar. The bar is divided into three parts. The lower third of the bar is the number three (3), the middle third of the bar is the number two (2), the upper third of the bar is the number one (1). The first number in the indicato
FREE

Purpose: The function of this indicator is to draw 3 moving averages (MA's) lines on the main MT4 price chart. The MA's are from 3 different timeframes specified by the user independent of the chart that is currently displayed. When you toggle your chart view through different time frames, the 3 MA's will continue to display the MA lines for the time frames specified in the properties. Example: The default settings map out three 50 bars MA's for H4, D1 and W1 time frames. During intraday tradi
FREE

Indicator is converted from another programming language code by programmer " sbtnc ". MQL version is simplified to be more useful by less settings complexity. There is some clues from programmer about indicator: The indicator tracks and reports the percentage of occurrence of daily tops and bottoms by the time of the day. At certain times during the trading day, the market reverses and marks the high or low of the day. Tops and bottoms are vital when entering a trade, as they will decide if y
FREE

You've probably heard about the Dow trend Theory, where higher highs and lows indicate an uptrend, and lower highs and lows indicate a downtrend. This indicator determines this trend based on the Dow Theory. You just need to enter a number representing the number of candles between extremes. The optimal solution is the number 3, unless you want to have the trend from M5 but you're on M1, then you need to multiply this number by 5. Check various combinations to trade with the trend. In the scree
FREE

Индикатор показывает максимальное отклонение от скользящей средней за заданный период. Границы канала могут послужить своего рода зонами перекупленности/перепроданности, от которых может произойти откат цены к центру канала. За этими уровнями и стоит искать дополнительные сигналы для входа в сделку. В настройках индикатора всего 2 параметра - период, за который будет расчитываться индикатор и метод усреднения скользящей средней.
FREE
This indicator show all history orders on chart with the same symbol. It help you see time and price that orders opened and closed. 1) Show all history 2) Open chart with symbol that you need to watch 3) Attach the indicator 4) Press key "h" -Downwards line Blue: sell with profit -Downwards line Red: buy with loss -Upwards line Blue: buy with profit -Upwards line Red: sell with loss.
FREE

There is a very simple and surprisingly effective indicator called Pi Cycle, which starts to give the first warning. It is worth a look, so as not to miss the giant elephant in the living room!))
What is Pi Cycle?
Pi Cycle is a very simple indicator created by analyst Philip Swift . It takes into account two (DMA biased moving averages ): 350-day average x 2 111-day average Both can be considered long-term indicators. The second one is obviously more sensitive to current market changes, since
FREE

Description This scanner uses 3LZZ TRO ex4 and scans for Semafors at given “Shift” bar.
Scanner Detailed Settings: https://www.mql5.com/en/blogs/post/747456
Other Settings: Set Periods for Semafor 1,2,3 Set alerts on/off for Semafor 1,2,3 Shift bar (Bar on which semafor is scanned) Refresh After Ticks (Number of ticks when dash is refreshed) This scanner is pretty simplistic version. And a more detailed version with a different strategy is available here: https://www.mql5.com/en/market/product
FREE

Panelux - информационная панель показывающая актуальную информацию для трейдера, такую как: Номер торгового аккаунта и торговое плечо; Символ, период, последнюю цену, время до закрытия бара и спред; Отдельный блок для мани менеджмента; Данные свопа инструмента; Блок информации о депозите, балансе, профите, позициях, equity и margin; Блок о прибылях и убытках за год, квартал, месяц, неделю и по последним пяти дням. Имеется опция для включения отображения совершенных сделок на графике цены. Что уд
FREE

Introduction This Indicator Is Based On Average Price/Maximum Price Moves, And Using Moving Bollinger Bands And Moving Averages.
The Advantage Of Using It With YOUR own Analysis Will Confirm Potential Supports And Resistances While it Compliments With Your Analysis
The Indicator Is Non-Repainting
AND Along With Our Special Trend METRE that Changes With The Conditions OF A Bullish Or Bearish Trend....
Recommend Time-Frames: H1 H4 M15
Usage: The Indicator Is Very Profitable If Use
FREE

What is a tool ? This indicator use for comparison of 8 major currency from 28 pairs and multiple timeframes and calculates a score of strength from 0-100. How to use Place the indicator on any pair any timeframe, And entering only the value of X Y position to be displayed in the graph. Pair : Any Timeframe : Any Input Parameter Start X Position : Value of X on chart Start Y Position : Value of Y on chart Visit my products Target Profit Magic Target Profit All The Profit Tracker Currency
FREE

P R I C E F O R C E A N A L Y Z E R This is a complex indicator that calculates the force of the price direction.
V E R Y I M P O R T A N T This is not a stand alone indicator. Use it together with your own strategy. This indicator only confirms your possible position. You can run it in any charts and timeframes but H1 is recommended. Make sure that the pair is volatile at the time of trading. If you don't have a solid volatility-based strategy yet, y
FREE
Highly configurable Relative Vigor Index (RVI) indicator.
Features: Highly customizable alert functions (at levels, crosses, direction changes via email, push, sound, popup) Multi timeframe ability Color customization (at levels, crosses, direction changes) Linear interpolation and histogram mode options Works on strategy tester in multi timeframe mode (at weekend without ticks also) Adjustable Levels Parameters:
RVI Timeframe: You can set the lower/higher timeframes for RVI. RVI Bar Shift: yo
FREE

Pattern Finder is a MULTICURRENCY indicator that scans the entire market seeking for up to 62 candlestick patterns in 15 different pairs/currencies all in one chart! You can also filter the scanning by following the trend by a function based on exponential moving average.
Indicator parameters Alerts ON/OFF: Alert on screen ON/OFF : enables or disable screen alters. Notification by email ON/OFF : enable or disable email alerts. Push notification ON/OFF : enable or disable push notification on mo

The Netsrac Correlation Trade Indicator (NCTI) was created to trade correlations between different assets. NCTI offers five different strategies to do this. Five different correlation trading strategies with two or three assets Fast access your assets with one click via asset buttons Your profit/loss at a glance Configurable alerts via screen or mobile You can use the indicator with every timeframe. Higher timeframes give fewer but better signals. If you have some questions or suggestions - plea
FREE
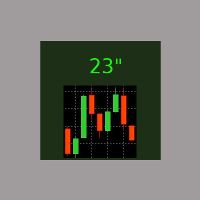
It is the simplest indicator in existence. It has only one function: report the seconds elapsed since the last minute end in a very convenient way, with a label that can be moved in the chart, so that the trader does not have to take his eye off the forming candle. It is used on M1, but also on larger intervals, for those interested in opening/closing positions at the best time. Sometimes an intense movement in the last 10" of the minute gives indications of future trend, and can be used for sc
FREE
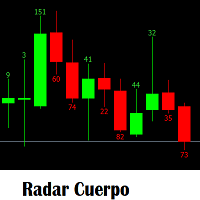
Indicador que sirve mirar el tamaño de velas segun el tamaño te genere alerta para hacer entradas manuales. Aprovechenlo al maximo que una plantea estrategia a vaces del tamñao de la vela anterior o de la misma vela actual. para entran a comprar y vender. Es un indicador que es necesario para cualquier analisis que se tome para una entrada nueva. Sera su herramienta preferida.
FREE

Harrow Band is an indicator based on support and resistance values. This indicator provides six bands that indicate the nearest of support or resistance position. With this indicator, it will be easier to see where entry and exit points of a trade are located.
Pairs and Timeframes This indicator can be used in any pairs and timeframes, but it is recommended to use it in XAUUSD H1.
Parameters NumCandle - number of candles used to calculate the support and resistance position. BandColor - color
FREE

Currency Explorer is the absolute tool for traders that want to know with quantified certainty the currency strength & weakness of each currency and to trade these by using applicable strategies. Our machine learning models run and provide the strength/weakness of each currency based on multiple factors besides price action. It provides the trader with a QUANTIFIED result for the strength of the 8 most popular and major currencies (EUR, USD, JPY, GBP, AUD, NZD, CAD and CHF) with a scale from 0-1
FREE

Slow T3 MA Trend indicator derived from T3 moving averages. This indicator is part of the T3 Cloud MA indicator and is posted here on its own. Buying/Selling opportunities above/below line. The MA line can also be used as dynamic support/resistance for more aggressive entries. Use default values for best settings. The number of look back bars is user defined. This indicator can be used in combination with other strategies such as price action. Suitable for all time frames.
FREE

It's a simple but useful tool for creating a grid based on Bollinger Bands .
Only 2 parameters can be set: 1) "Period" - the period of all visible Bollinger Bands (i.e. 4) and 1 Moving Average (axis of all Bollinger Bands), 2) "Deviations Distance" - the distance between Bollinger Bands.
Naturally, the colors of all 9 lines can be changed as desired. It works with everything that is available in your Market Watch.
Good luck!
FREE
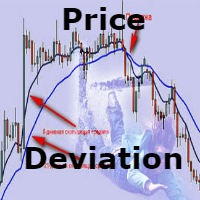
A very simple and intuitive indicator that shows the deviations from the moving average in percent. The default is a 50-day moving average. Just throw on the chart and the indicator build in a separate window under the graph.
This can be very convenient if your strategy implies a certain deviation in percentage of the moving average. It is not very convenient to calculate it manually. The method of averaging, the period of the moving average and at what prices to build all this is selected in t
FREE

Having to check constantly if your CCI has reached a specific level can be tedious and draining at times, especially if you have to monitor different asset classes at a time. The Alert CCI indicator will assist in this task, ensuring that you get the most with little effort. When the CCI values get to a specified level, the alerts will go off, on the chart, on the MT4 phone app or via email (You can receive text messages to your phone if you activate texts on your Gmail account). The indicator d
FREE

Индикатор вычисляет наиболее вероятные уровни возврата цены. Может быть использован для установки уровня тейк профит. Рекомендуемый таймфрейм - любой, при соответствующей настройке. Настройки.
Period - количество свечей для анализа. Accuracy - точность расчёта уровня в пунктах. Width - размер ценовой метки. Отработка уровней как правило не занимает много времени, уровни достаточно точны при касании и процент возврата цены к ним достаточно высок. Но следует учитывать риск продаж на локальных мин
FREE
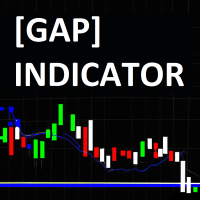
The JagzFX Gap Indicator acts as your vigilant companion, scanning the market with precision and alerting you to the presence of gaps as soon as a new candle is formed. Set your desired gap size, and the indicator will highlight both filled and unfilled gaps, on any symbol and on any timeframe. By analysing the presence of unfilled gaps, you gain valuable insights into market behaviour, allowing for more informed trading decisions. Combine JagzFX Gap Indicator with JagzFX OnePin to create a ma
FREE
Lord Info est un indicateur du marché financier sur la plateforme META TRADER 4.
Vous pouvez placer Lord Info sur n’importe quelle paire action/devise de votre plateforme.
Lord Info est en mesure de nous montrer le rapport ATR des (10) derniers jours ou configurable, où nous pouvons voir la volatilité de base de la paire et ses conséquences.
L'ATR (Average True Range) est un indicateur de la volatilité du marché utilisé dans l'analyse technique. Il est généralement dérivé de la moyenne mobil
FREE

Introducing the “Symbol Cost Info MT4” indicator – your ultimate tool for staying ahead in the forex market! This innovative indicator is designed to empower traders with real-time cost information, directly on their charts. Here’s why every trader needs the “Symbol Cost Info MT4” in their arsenal: Real-Time Spread Monitoring : Keep a close eye on the spread for any currency pair, ensuring you enter the market at the most cost-effective times. Pip Value at Your Fingertips : Instantly know t
FREE

Supply and Demand indicator does not repaint as it counts the number of tests/retests occurred in the past x number of times. As a trader you need a path to be able to place your buy and sell trades such as: Supply and Demand, Falling & raising channels . Experienced trades will draw the key levels and channels around the timeframes. But, they will not be able to draw them on the small time frames as the price changes too frequent. This indicator is based on Shved supply and demand indicator, b
FREE
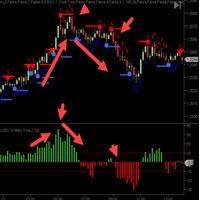
The C ycleTraderPro Close Strength Value Indicator measures the distance from the OPEN of a new bar to the CLOSE of that bar. Input - length = 10 default We add these values together going back the the length setting. If the 1st bar was plus 10 ticks and then the next bar was minus 7 ticks, then this would register +3
There are 2 ways to trade Close Strength Value: 1. Trading in the direction of lower highs and lower lows and vice versa for buys, higher highs, and higher lows. 2. Trade when the
FREE
Become a constantly profitable 5-star forex trader!
We offer a few indicators to support you understand and analyse the market! With our strategies you will improve your trading system and bacome an expert...
We have indicators for trend direction, market direction and others.. for multi-time frames and that covers all majors or your favorite trading symbols! Some of them offer a customizable calculation parameters... or Graph features!
See how powerful they are! The are also easy-to-use tr
FREE

Follow the trail of the comet to know the development of the trend. This indicator helps you to determine the evolution of the price depending on how these astronomical objects are shown in the chart. When the comet seems to stop, it opens its tails considerably and warns us of a possible change in trend. On the contrary, when it seems to get speed (looks thin because lines of tail are grouped) demonstrates safety and continuity in trend. The head or comet nucleus will show red or green accordin
FREE
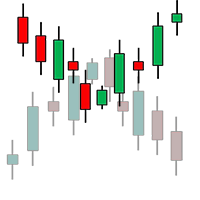
Th3Eng Chart shadow indicator is a tool helps you to display another symbol on the current symbol in candles style or line. You can type the second symbol name in the setting and select the drawing mode { candles or line }. Also, the indicator displays the spread and current price of both pairs on the left top side corner of the chart.
setting: 1- Symbol: Insert The second symbol name. 2- Drawing mode: Choose the draw mode from (Candles or line). 3- Show spreads: true\false to display the pric
FREE

Trend indicator with oscillator. Displays price area between two moving averages and an oscillator. An uptrend is indicated in red, a downtrend in blue. Settings: Slow MA Period - Slow MA period Fast MA Period - Fast MA period Smoothed Data - Smoothing data Show Area MA - Display MA price areas Show Oscillation - Display MA oscillation Move Oscillation to Slow MA - Display an oscillator on a slow MA Color Up - Uptrend color Color Down - Downtrend color Size Arrow - The size of the oscillator ic
FREE

This simple information indicator shows the name of the current day and past working days, months and years.
On the concept of time and timeframe It is common knowledge that a timeframe is a time interval considered in technical analysis of free financial markets, during which the price and other market data changes occur when the price charts are plotted. In the MetaTrader 4 trading terminal, these periods are separated by vertical dashed line, which can be enabled or disabled by simply pressi
FREE

This indicator identifies short-term, medium-term and long-term highs and lows of the market according to the method described by Larry Williams in the book "Long-term secrets to short-term trading".
Brief description of the principle of identifying the market highs and lows A short-term high is a high of a bar with lower highs on either side of it, and, conversely, a short-term low of a bar is a low with higher lows on either side of it. Medium-term highs and lows are determined similarly: a
FREE
This indicator is a tool to measure the relative strength of different currency pairs. It used a user selected base currency as a comparing standard, and evaluate all other major currencies base on their relative strength/weakness. the stronger one currency compare to the base currency, the higher its value. Base currency has a fix strength value of 50.
Indicator parameters Strength Period - Change the strength period in the settings affects the number of bars used for calculation. The higher t
FREE

Precision Channel Indicator: Master the Market with Ease! Description : The Precision Channel Indicator is a powerful tool designed to help you better understand market trends and identify the optimal entry and exit points. With its intuitive channel visualization, you can easily spot price ranges and make smarter trading decisions. Key Features : Clear Channel Visualization: Instantly identify key support and resistance areas in the market. Efficient Trading Signals: Pinpoint critical buy and s
FREE

This indicator helps the trader to make the final decision. When you have already decided in which direction the price will unfold, it remains as accurate as possible to determine the reversal itself. This is the task performed by the Konkov indicator. The indicator is installed on M1 and M5 charts. Indicator parameters: for M1 chart time_frame1 5 time_frame2
FREE
This indicator show the collision points of moving averages in a separate window. so we will have a solitude chart. "Contact support for assistance and Download ALL PRODUCTS FREE TRAIL VERSION"
Features indicator: Show alert in Meta Trade Send notification to mobile Adjustable 3 MA (Fast-Middle-Slow) Can be used on all symbols Can be used in all time frames
Attention, the application does not work in the strategy tester
You can download the Demo version on the comments page : https://www.mql
FREE

Break Even Line by MMD
The Break Even line is a useful indicator for people using strategies that allow simultaneous trades in both directions, such as the MMD methodology. This indicator is useful when playing statistical models and averaging positions in accumulation and distribution zones. The indicator draws levels by summing positions in three groups: positions included in BUY, positions included in SELL and all positions included.
Functionality description:
Show BUY BELine - shows or
FREE

TIRED OF HAVING TO CALCULATE THE LOTSIZE EVERY TIME?
This indicator will do it for you, WHATEVER ASSET YOU CHOOSE in 10 seconds !!!
INSTRUCTIONS
The things to do in order to activate this indicator will take around 10 seconds once you understand how to use this indicator properly.
Here are the steps to follow:
Place the indicator on the chart of the asset you want to trade on.
Go to " Inputs ".
Enter where you want to set the stop loss .
Choose risk in $ .
You can also choose whethe
FREE

Candlestick Oscillator is a truly unique Oscillator that uses the concepts of within candlestick trading called the Record Session High. This is a method of analysing candlesticks to gauge when a trend might be wearing out and therefore ready for reversal or pause. We call it a record session high when we get 8 or more previous candles that have higher closes. We call it a record session low when we get 8 or more previous candles that have lower closes.
We don't rely on the typical Oscillation
FREE
MetaTrader Market - les robots de trading et les indicateurs techniques pour les traders sont disponibles directement dans votre terminal de trading.
Le système de paiement MQL5.community est disponible pour tous les utilisateurs enregistrés du site MQL5.com pour les transactions sur les Services MetaTrader. Vous pouvez déposer et retirer de l'argent en utilisant WebMoney, PayPal ou une carte bancaire.
Vous manquez des opportunités de trading :
- Applications de trading gratuites
- Plus de 8 000 signaux à copier
- Actualités économiques pour explorer les marchés financiers
Inscription
Se connecter
Si vous n'avez pas de compte, veuillez vous inscrire
Autorisez l'utilisation de cookies pour vous connecter au site Web MQL5.com.
Veuillez activer les paramètres nécessaires dans votre navigateur, sinon vous ne pourrez pas vous connecter.