Regardez les tutoriels vidéo de Market sur YouTube
Comment acheter un robot de trading ou un indicateur
Exécutez votre EA sur
hébergement virtuel
hébergement virtuel
Test un indicateur/robot de trading avant d'acheter
Vous voulez gagner de l'argent sur Market ?
Comment présenter un produit pour qu'il se vende bien
Indicateurs techniques gratuits pour MetaTrader 4 - 12
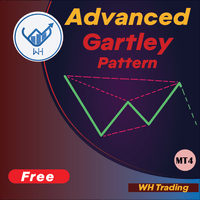
Bienvenue dans l'indicateur de reconnaissance avancée du motif Gartley Cet indicateur détecte le modèle de Gartley basé sur HH et LL de la structure des prix et des niveaux de Fibonacci, et lorsque certains niveaux de fib sont atteints, l'indicateur affichera le modèle sur le graphique. Version MT5 : WH Advanced Gartley Pattern MT5
**Cet indicateur fait partie du combo WH Ultimate Harmonic Patterns MT4 , qui inclut toute la reconnaissance de formes.** Caractéristiques : Algorithme ava
FREE

Investment Castle Indicator has the following features: 1. Dictates the direction of the trend in different Timeframes . 2. Shows the hit rate and winning rate on the chart. 3. This indicator does not repaint the chart. 4. This indicator is built-in the Support & Resistance based Investment Castle EA which works with Psychological Key Levels "Support & Resistance" Indicator.
FREE

Check my p a id tools they work perfect please r ate Adjustable PIN BAR indicator is usefull tool alowing to search for pin bars you wish to find on the price chart, it has 2 parameters to filter out what type of pin bars you wish to search for: 1) MinTailProc 75% (default) which means to show pin bars that has minimum size of the Nose (Tail) as 75% of full candle size. If Upper Nose (Tail) size of the candle is minimum 75% of the candle size fully than candle is painted in RED. If Lower Nose
FREE
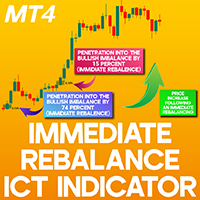
Immediate Rebalance ICT Indicator for MT4 The Immediate Rebalance Indicator for MetaTrader 4 is built to identify and emphasize instant price equilibrium levels. In ICT trading strategies, price balance is a crucial factor, and imbalances arise when a sequence of three candles leaves a gap between the wicks of the first and third candles, indicating a disruption in supply and demand dynamics. When the third candle promptly fills this gap by making contact with the wick of the first candle, it cr
FREE

L'algorithme est basé sur l'idée de l'indicateur Currency Power Meter. Dans cette version, le nombre de valeurs affichées est illimité, son code est plus compact et rapide, les valeurs de la barre courante peuvent être obtenues grâce aux tampons indicateurs. Ce que l'indicateur montre : une bande fine et le chiffre supérieur devant la devise montrent l'indice de force relative pour les N dernières heures (N est défini dans les paramètres de la variable 'Heures'), une bande plus large montre l'
FREE

The BinaryFortune indicator has been developed and adapted specifically for trading short-term binary options. The algorithm of the indicator analyzes numerous factors before generating a signal. The indicator is installed in the conventional way. The indicator consists of an information window, which displays the name of the trading instrument, support and resistance levels, and the signal itself ( BUY , SELL or WAIT ). A signal is accompanied by a sound and a pop-up Alert. Advantages of the in
FREE
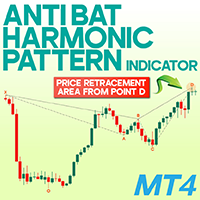
Anti Bat Harmonic Pattern Indicator MT4 The Anti Bat Harmonic Pattern Indicator automatically identifies and draws patterns using price structure analysis algorithms combined with Fibonacci ratios. This harmonic pattern is essentially the inverse of the traditional Bat pattern. While the Bat pattern is designed to pinpoint a strong reversal zone after a significant retracement, the Anti Bat pattern represents a shallower correction, with price reversals occurring at different Fibonacci ratios co
FREE

This tools is design to easily forecast the projection of the current trend through the inputs of Zigzag and get out of the market when the trend do not the ability to maintain it's volatility to go further... the indicator gets the initial and final price from the value of zigzag automatically by adjusting the intdepth of zigzag. You can also switch from Projection to Extension from the inputs tab of indicator.
FREE

The three white soldiers and the three black crows candlestick patterns are reversal patterns that predict a change in the direction of a trend. The pattern consists of three consecutive long-bodied candlesticks that open within the previous candle's real body and a close that exceeds the previous candle's. It's important to note that both formations are only valid when they appear after a strong uptrend or a downtrend, while their efficiency decreases in choppy markets.
Inputs AlertOn - en
FREE

This indicator lets you easily mark the daily open levels on a chart with several possibilities of customization. For many trading strategies, the daily open level is an important level to base trading decisions on. That is why I chose to create this indicator that is designed to assist you with trading these strategies, as well as further optimizing them and getting a general understanding of the markets movements. With this tools help, you can easily take a look at the previous price action ar
FREE

This indicator mostly inspired from BW-ZoneTrade custom indicator from MT5. How To Use:
BUY when both dots colored Green. SELL when both dots colored Red. In addition to original one, MACD-OsMA-generated signal also can be drawn. Input Description:
MA_period_short: Faster EMA period for MACD. Applied when drawMACD is true. MA_period_long: Slower EMA period for MACD. Applied when drawMACD is true. MACDperiod: MA period for MACD. Applied when drawMACD is true. drawMACD: When true, draw an additi
FREE

Signals and Alerts for AMA (Adaptive Moving Average) indicator based on these MQL5 posts: Adaptive Moving Average (AMA) and Signals of the Indicator Adaptive Moving Average . Note : this tool is based on the code of AMA indicator developed by MetaQuotes Software Corp.
Features The signals are triggered at closing of last bar/opening of a new bar; Any kind of alerts can be enabled: Dialog Box, Email message, SMS notifications for smartphones and tablets, and Sound alerts; Customizable
FREE

YOU CAN NOW DOWNLOAD FREE VERSIONS OF OUR PAID INDICATORS . IT'S OUR WAY OF GIVING BACK TO THE COMMUNITY ! >>> GO HERE TO DOWNLOAD
Camarilla Pivots Historical plots the historical data of the camarilla pivot point levels on the chart. The Camarilla Pivot levels was originated in 1989 by Nick Scott. The levels are used as primary support and resistance levels by Intraday traders. The levels are calculated with the following formula: R4 = C + RANGE * 1.1/2 R3 = C + RANGE * 1.1/4 R2 = C + RANG
FREE
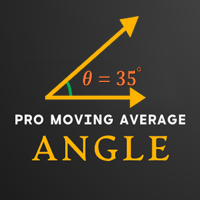
This indicator is a professional Trend identifier, it measures the angle or slope of moving averages with different methods. As this indicator calculate angles you can identify the strength of trend by magnitude of angle. It also shows if angle is increasing or decreasing which gives you the opportunity to make more information about current trend. You can combine this indicator with your strategy as a filter or you can use it alone to make your trading system. This is not a repainting indicator
FREE

Trend Graf - это инструмент позволяющий видеть тренд текущего момента,имея стартовые диапозоны которые появляются каждые шесть часов ,способен давать нам уровень предела коррекции как по тренду так и на смену ему.Работает на всех валютных парах!В настройках мы имеем смещение для проекции стартового диапозона от текущей установки ,для каждой валютной пары можно подобрать то смещение, которое лучшим образом будет показывать предел коррекции.Следующее обновление будет включать сигнальные указатели!
FREE

If you trade or wish to trade the popular HLHB Trend-Catcher System, then this indicator is for you! It detects when the HLHB system entry rules are met and sends out an alert in the form of notifications to your mobile phone and to your pc. By automatically sending you notifications, this indicator lessens your trading work load as you don't have to sit in from of your pc all day checking all the chats for when the entry rules are met. This indicator does all the dirty work for you. When the si
FREE

Your swiss army knife to ancipate price reversals
This indicator anticipates price reversals analyzing bullish and bearish pressure in the market. The buying pressure is the sum of all the accumulation bars over a certain number of days, multiplied by the volume. The selling pressure is the sum of all of the distribution over the same number of bars, multiplied by the volume. It gives you a measure of the buying pressure as a percentage of the total activity, which value should fluctuate from 0
FREE
For those who have followed my FCK Quantum Scalping thread know about the FCK Quantum Scalping indicator and have taken the indicator to different levels (Mastermind) to suit his or her trading style. In this system, the Quantum indicator is only for showing us trading entries, and that’s it. Targets and stop levels are a little later. For those who don’t know what the FCK Quantum Scalping indicator is, I’ll tell you. The FCK Quantum Scalping indicator is basically a modified Wave indicator i
FREE
L'indicateur présenté est un développement original basé sur l'indicateur d'analyse technique classique - RSI. Pour atténuer les fortes fluctuations des valeurs des indicateurs, un filtre est utilisé qui coupe les changements faibles et concentre l'attention du trader sur les fortes fluctuations des valeurs. L'indicateur ne repeint pas sur les barres formées. Pour une plus grande efficacité de cet indicateur, il doit être utilisé en conjonction avec des indicateurs qui identifient la direction d
FREE
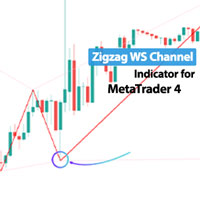
Zigzag WS Channel Indicator MetaTrader 4 The Zigzag WS Channel Indicator is an advanced tool available in MetaTrader that merges the Zigzag algorithm with dynamic trendlines to form a technical channel, helping traders identify and confirm price movement structures. This indicator highlights price turning points (peaks and troughs) and clearly illustrates the primary market trend using red lines. «Indicator Installation & User Guide»
MT4 Indicator Installation | Zigzag WS Channel Indicator MT
FREE

Этот индикатор основан на концепции "Дивергентных баров" из торговой системы "Торговый Хаос" Билла Вильямса. Он предназначен для автоматического выявления на графике специфических ценовых паттернов, которые могут указывать на потенциальные точки входа или смены тренда. Что такое Дивергентный бар (BDB)? Дивергентный бар - это свеча или бар на графике, который имеет определенные характеристики относительно предыдущего бара и линий индикатора Alligator (Челюсть, Зубы, Губы). В системе Билла Уильямс
FREE
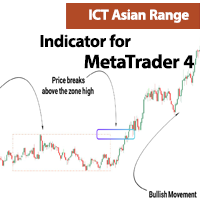
ICT Asian Range Indicator MetaTrader 4 The ICT Asian Range Indicator is developed to display price consolidation zones based on the ICT trading methodology. During the Asian session, the Forex market often remains in a tight range, followed by increased volatility and stronger movements during the London and New York sessions. This session and kill zone indicator for MT4 highlights the Asian session range using red boxes drawn directly on the chart. «Indicator Installation & User Guide» MT4 Indi
FREE

MQLTA Candle Timer is an indicator that can show you the details about a symbol/pair and alert you before the close of a candle. Used in swing trading and not only, it can help your strategies knowing and be ready before the close of a candle.
How does it work Simply add the indicator to the chart and set the notifications options. You can load a minimalistic interface or a full interface. The alert will be sent once per candle.
Parameters All the parameters, that you can see in the picture, a
FREE
Price Action Indicator gives you reverse or even continous trend signals depending on your timeframe and Strategy used. !!!This is not a holy grail indicator and it will not give 100% winning rate!!! As you can see, it is not giving a lot of signals because of the price movements in side way (flat) trend. You can use it on every major currency pairs and even on indices. Please be aware of using this indicator with other strategies and indicators. Use MM and Risk Management properly. Sometimes
FREE

This indicator is the basis for an Expert Advisor that can be categorized as "almost Grail". See details below. This indicator displays the projection of the Renko chart on the price chart. This projection is displayed as a stepped line, not as "bricks" (rectangles). See slides 1 and 2. Abbreviated name of the indicator: LRC – L ine of R enko on the price C hart. The principle of its construction is very simple. First, a grid of horizontal lines (levels) is bu
FREE
Smart Liquidity Zones (SLZ) — Your All‑in‑One SMC/ICT Radar for MT4
Why SLZ? Tired of squinting at charts trying to spot liquidity grabs, break‑of‑structure candles and Fair Value Gaps before the smart‑money sharks do? SLZ turns your chart into a tactical map —drawing every high‑probability zone and screaming (politely) when price dives in. Core Edge Powered by a rule‑set distilled from Smart Money Concepts (SMC) and ICT mentorship material, SLZ auto‑marks: Component What it shows Why it
FREE

Th indicator is a technical analysis tool that helps identify significant changes in price trends and filter out minor price fluctuations. It is used to highlight price swings and provide a clearer picture of market movements. The Pivots are found by checking if a certain candle is the highest/lowest in a given number of candles that come before and after it. This indicator has only one input, its period. The Higher the period, the more strict the indicator is about what constitutes a Pivot. Th
FREE

This indicator compares the price changes during the specified period for the current symbol and other reference symbol. It allows to analyze the similar movements of highly correlated symbols, such as XAUUSD and XAGUSD, and find their occasional convergences and divergences for trading opportunities. The indicator displays the following buffers: light-green thick line - price changes of the current symbol for TimeGap bars; light-blue thin line - price changes of the reference symbol ( LeadSymbo
FREE
TrendRange Indicator works on M1, M5, M15, M30, H1 and H4 timeframes. It indicates real market trend, support and resistance levels. In other words, it confirms trade directions. Scalpers especially, Intraday, swing, intermediate and long term traders will especially find this indicator useful. It uses customized show/hide buttons namely: "DRAW", "HILO", and "LEVEL" lines crossings and histograms ("AWOS" for Awesome Oscillator, "BUBE" for Bull Power and Bear Power & "GATO" for Gator Oscilla
FREE

L'indicateur montre les niveaux pivot classiques sur le graphique, calculés sur la base du jour précédent. Vous pouvez choisir l'heure à partir de laquelle la formule sera calculée. Négociez dans un marché plat en vue d'un renversement. Dans un marché en tendance, utilisez-les comme cible. Combinez-les avec vos stratégies pour un trading réussi. Les niveaux sont construits à l'aide de tampons et affichés sur l'ensemble de l'historique des cotations disponibles.
Paramètres d'entrée.
Start Hour
FREE

TMA Classic is a simple and lightweight indicator that displays the Triangular Moving Average (TMA) as a single line on the chart.
It helps traders visualize the core movement of price by smoothing out excessive short-term noise, making it ideal for identifying trend direction and range-bound conditions. Since it only displays one line, it ensures excellent chart visibility without overlapping or interfering with candles or other indicators. Key Features Displays a real-time Triangular Moving
FREE

THE PRICE ACTION INDICATOR! This program finds candlestick absorption patterns and a false breakdown, after which it draws the entry points with arrows.
Input parameters:
1. PPR_Arrow The On parameter/Off display of the absorption model arrows. By default, it is set to true.
2. FB_Arrow Everything is the same as the first parameter, only for false breakdown models. By default, it is set to true.
Sincerely, Novak Production.
FREE

Nous vous présentons un indicateur qui non seulement améliore l'aspect visuel du graphique, mais lui confère également un caractère vivant et dynamique. Notre indicateur est une combinaison d'un ou plusieurs indicateurs de moyenne mobile (MA), qui changent constamment de couleur, créant ainsi un aspect intéressant et coloré.
Ce produit est une solution graphique, il est donc difficile de décrire ce qu'il fait dans un texte, il est plus facile de le voir en le téléchargeant, de plus le produit
FREE

Ce produit est conçu pour afficher les sessions de trading de 15 pays en fonction du fuseau horaire de votre serveur de courtier et de divers modes d'affichage en fonction des paramètres souhaités pour éviter la congestion des graphiques et la possibilité de définir une session avec l'heure souhaitée par l'utilisateur.
Le soleil ne se couche jamais sur le marché des changes, mais son rythme danse au rythme de séances de trading distinctes. Comprendre ces sessions, leurs chevauchements et leurs
FREE
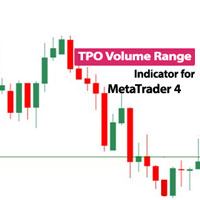
TPO Volume Range Indicator MetaTrader 4 The TPO Volume Range Indicator is developed for MetaTrader 4 to visualize how volume is distributed within specific price ranges. This tool utilizes two vertical lines along with color-coded histograms displayed on the right side of the chart to represent volume levels. The vertical lines can be moved freely, allowing traders to set the desired analysis range. Additionally, green horizontal lines indicate high-volume areas, which act as key support and
FREE

!!!Version free ne fonctionne que sur "EURUSD"!!! WaPreviousCandleLevelsMT4 affiche les niveaux de bougies précédents, il affiche les niveaux d'ouverture (Open), du prix le plus haut (High), du prix le plus bas (Low) et du prix de clôture (Close) de la bougie précédente sur différentes périodes. Ces niveaux sont souvent appelés OHLC. Il est conçu pour aider le trader à analyser le marché et à faire attention aux niveaux OHLC de la bougie précédente sur différentes unités de temps. Nous savons
FREE
This indicator analyzes how efficient is the current market movement based on the true high-low ratio of a certain number of bars. [ Installation Guide | Update Guide | Troubleshooting | FAQ | All Products ] The ratio is the effectiveness of the market movement A ratio below 1 means the market is going nowhere A ratio above 1 means the market is starting to show directionality A ratio above 2 means the market is showing effective movement A ratio above 3 means the market moved too much: it will
FREE
Daily Volatility Tracker is a practical and lightweight indicator designed to help traders monitor and analyze market volatility based on historical daily price movements. Whether you're a day trader, swing trader, or scalper, understanding how much a market moves per day is critical for: Choosing the right pairs to trade Setting accurate stop-loss and take-profit levels Adapting to changing market conditions MT5 Version - https://www.mql5.com/en/market/product/134960/ Join To Learn Market Dept
FREE

Master the market: harness the power of statistical arbitrage
This indicator showcases the price action of multiple instruments on a single chart, enabling you to compare the fluctuations of different assets and seamlessly implement statistical arbitrage strategies. Its main usage is to find correlated symbols which are temporarily out of whack.
[ Installation Guide | Update Guide | Troubleshooting | FAQ | All Products ]
Find overbought or oversold currency pairs easily Plot up to six currency
FREE

SX Price Action Patterns is a comprehensive indicator which shows various price action patterns on the chart for those who are interested in price action trading. These patterns are as follows: A Pin Bar is a candlestick price bar, which has a long wick on one side and a small body. It is a powerful signal of price reversal in a currency trading strategy. An Inside Bar is characterized by a bar or candle that is entirely ‘inside’ the range of the preceding one and represents the consolidation o
FREE
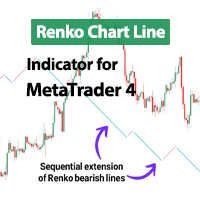
Renko Chart Line Indicator MT4 The Renko Chart Line Indicator is developed to highlight clear and distinct price movements on the MetaTrader 4 platform. It filters out market noise and utilizes diagonal lines to represent trend direction in a Renko-style format. Pink lines indicate bullish momentum, while blue lines represent bearish movement. «Indicator Installation & User Guide»
MT4 Indicator Installation | Renko Chart Line Indicator MT5 | ALL Products By TradingFinderLab | Best MT4 Indic
FREE
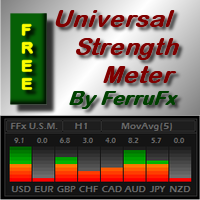
PRO version is available here: https://www.mql5.com/en/market/product/12648 FFx Universal Strength Meter is more than a basic strength meter. Instead of limiting the calculation to price, it can be based on any of the 19 integrated strength modes + 9 timeframes. With the FFx USM, you are able to define any period for any timeframe. For example, you can set the dashboard for the last 10 candles for M15… Full flexibility! Very easy to interpret... It gives a great idea about which currency is weak
FREE

(Google Traduction) La représentation standard de la bougie Heikin Ashi a une valeur ouverte qui équivaut à une exponentielle Moyenne Mobile (EMA) du Prix Total , dont la valeur alpha de l' EMA est fixe à 0,5 (équivalent à une période EMA de 3,0). Dans cette version dynamique, la période peut être modifiée selon la valeur que l'on souhaite utiliser, ce qui permet également de analyse approximative sur plusieurs périodes de temps, ou utilisez la valeur basse ou haute comme une sorte de stop-loss
FREE

CISD High and Low ICT Indicator for MetaTrader 4 The CISD – CSD + High and Low Indicator is a liquidity-based tool for MetaTrader 4, designed following ICT trading principles to identify potential market reversals. This indicator utilizes the CISD (Critical Institutional Supply and Demand) methodology, marking trade entry points by tracking key high and low-price levels across various timeframes, such as daily, weekly, and monthly charts. CISD + High & Low Indicator Features Below is a breakdo
FREE

This indicator identifies swing highs and swing lows in the price chart by comparing the Highs and lows of each candle to a specified number of candle before and after it. Once it has identified the swing highs and swing lows, it can use them to determine potential support and resistance levels. A support level is formed when the price drops and bounces back up from a swing low, indicating that there is buying pressure at that level. A resistance level is formed when the price rises and reve
FREE

Developed by Etienne Botes and Douglas Siepman, the Vortex Indicator consists of two oscillators that capture positive and negative trend movement. In creating this indicator, Botes and Seipman drew on the work of Welles Wilder and Viktor Schauberger, who is considered the father of implosion technology. Despite a rather involved formula, the indicator is quite straightforward to understand and easy to interpret. A bullish signal triggers when the positive trend indicator (VI+ green line) crosse
FREE

FREE TopClock Indicator: This indicator is an Analog Clock That Shows: Local Time Of Pc or Time Of Broker Server or sessions(Sydney -Tokyo London -NewYork)Time or custom Time( with GMT -Base) this can shows Candle Time Remainer with Spread live. You can run this indicator several times for different times and move it to different places on the chart. If you would like, this indicator can be customized for brokers and their IB based on customer needs. For more information contact us if you
FREE

Supply and Demand indicator does not repaint as it counts the number of tests/retests occurred in the past x number of times. As a trader you need a path to be able to place your buy and sell trades such as: Supply and Demand, Falling & raising channels . Experienced trades will draw the key levels and channels around the timeframes. But, they will not be able to draw them on the small time frames as the price changes too frequent. This indicator is based on Shved supply and demand indicator, b
FREE
The MA in Color_PRT Indicator offers valuable insights into market trends by displaying moving averages in different colors based on their direction. Green indicates an uptrend, red for a downtrend, and yellow for a consolidation phase. Traders can use this indicator to easily identify potential entry and exit points in their forex trades. When the lines change color, it can signal a change in market direction, giving traders an opportunity to adjust their strategy accordingly. Additionally, th
FREE

MT5 Version Most indicators draw lines.
This one draws the battlefield. If you ever bought an EA or indicator based on a perfect equity curve — and then watched it bleed out live — you’re not alone.
The problem? Static logic in a dynamic market. Fibonacci Bollinger Bands adapts.
It combines Bollinger structure with customizable Fibonacci levels to mark zones of control — where price reacts, pauses, or reverses. No magic. Just logic that follows volatility. Why this tool matters It shows yo
FREE

CandleStick Countdown – Indicateur MT4 pour afficher le temps restant de la bougie en cours CandleStick Countdown est un indicateur simple et efficace pour MetaTrader 4 qui affiche en temps réel le temps restant avant la clôture de la bougie actuelle, au format “minutes:secondes”. Fonctionnalités principales Compte à rebours de la bougie actuelle en temps réel Affichage textuel directement sur le graphique Positionnement automatique près du prix actuel Police et couleur du texte personnalis
FREE
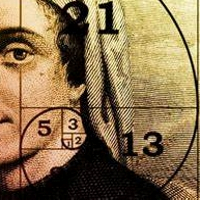
FTU Fibonacci Cet indicateur trace les niveaux de Fib pour les systèmes d'entrée de type retracement ** regardez la vidéo pour une suggestion de stratégie Caractéristiques : Plusieurs niveaux de Fib réglables Modifiez la couleur et le nombre de barres de la plage 2 lignes pour 50 barres avant le retracement haut-bas et 2 lignes pour 20 barres Les lignes affichent les niveaux de Fib 38 et 61 Utilisation : L'objectif est d'étudier ou de mesurer le retracement des prix Modifiez la couleur et le no
FREE

How To Trade
Execute your trades in 3 Easy Steps!
Step 1: Trade Setup Entry Buy in Line color Blue Touch on line color Red. Entry Sell in Line color Blue Touch on line color Green. Success Rate ≥ 80% 100:20 depend your experience and fast your take. Step 2: Set Stop Loss Stop loss BUY ----> You can not put stoploss with a fixed price, your speed in determining the closing request------>Line color Blue Touch on line color Green. Stop loss SELL ----> You can not put stoploss with a fixed price, yo
FREE
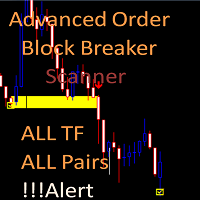
Advanced Order Block Breaker Scanner
This Scanner is free to download but is dependent on you owning the advance order block breaker indicator. Need to purchase the indicator here: https://www.mql5.com/en/market/product/59127
MT5 version: https://www.mql5.com/en/market/product/62769
The Scanner will show you on a single chart all the timeframes (M1 to Monthly) with their own status for the indicator: advance order block breaker Scan all time frame and all symbol: breaker's smart algor
FREE
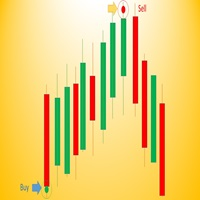
Wave Entry Alerts In Gold is a custom indicator developed by Azad Gorgis for MetaTrader 4. This indicator is designed to provide alerts based on ZigZag patterns, specifically tailored for trading on the Gold (XAU/USD) symbol.
Key Features: - Chart Window Indicator: The indicator is designed to be displayed on the main chart window. - Arrow Signals: The indicator generates arrow signals on the chart, indicating potential reversal points based on ZigZag patterns. - Customizable Parameters: Trade
FREE

FIBO ALERT https://www.mql5.com/en/market/product/34921
This indicator draws a fibonacci retracement (high and low) of a candle. It alerts and notifies the user whenever price touches or crosses the fibonacci levels. INPUTS ON Alert: set to true will alert pop up whenever price crosses levels at chart time frame. ON Push: set to true will send push notification to phone whenever price crosses levels at chart time frame. ===== FIBO (High & Low) ===== Time Frame: indicator draws fibonacci leve
FREE
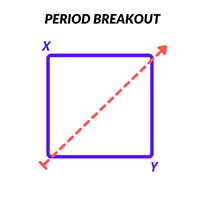
Overview
The Period Breakout Indicator is a versatile tool designed for traders seeking to identify breakout opportunities based on customizable time periods. This indicator automatically determines the highest and lowest prices within a user-defined period, allowing you to tailor it precisely to your trading strategy. Key Features
Customizable Time Periods: Define the start and end times based on your preferred trading hours or any specific period. The indicator will then calculate the highest
FREE

TILLSON MOVING AVERAGE Également appelé indicateur TMA ou T3. Il s'agit d'une moyenne mobile qui utilise EMA et DEMA dans sa formule et est calculée avec une expansion binomiale du 3e degré. Avantages; 1- signaux erronés rencontrés dans d'autres moyennes mobiles ( zig continu zag ) a été réduit autant que possible. 2- a empêché les retards observés dans les moyennes mobiles classiques . 3- Très réussi dans les tendances Les inconvénients 1- Il n'est pas efficace sur les ma
FREE

Suitable for multi time frame market direction prediction. Green and red color indicate the buy and sell call respectively. Green indicator is denote buy call and Red indicator denote the sell call. push notification is available to send instant message to you when green or red indicator will be appear. you have to activate the option at the time of mapping this indicator to you chart
FREE
Darvas Flow Indicator
is a revolutionary trading indicator that combines the classic Darvas Box method with modern market flow analysis. Developed for serious traders, Darvas Flow offers a powerful and intuitive tool for identifying trading opportunities. Key Features
Darvas Box Method Implementation : Darvas Flow automatically identifies Darvas boxes, allowing you to see crucial support and resistance levels. This helps in pinpointing optimal entry and exit points in your trades. Dynamic Flow
FREE

Multi timeframe fractal indicator which shows the higher timeframe's fractal point on lower timeframes.
Parameters Fractal_Timeframe : You can set the higher timeframes for fractals. Maxbar : You can set the maximum number of candles for the calculations. Up_Fractal_Color, Up_Fractal_Symbol, Down_Fractal_Color, Down_Fractal_Symbol : Color and style settings of the fractal points. Extend_Line : Draws a horizontal line from the previous fractal point until a candle closes it over or a user-specif
FREE

Resistance and Support is an easy to use indicator to apply horizontal lines of resistance and support. There are two windows for adding levels. When you press the button, a line appears on the price chart. It is possible to double-click this line with the mouse to activate and move it, thereby changing the indicator readings. In the indicator menu there is a choice of possible alerts - no alert, alert on touching the level an alert for closing the candle after the level.
FREE

This indicator integrates the Bollinger Band strategy in calculation with a volume-over-MA
calculation to further narrow down "Areas of Interest" levels for a potential re-test zone to the right of the chart.
We added a Moving Average calculation for a multi-level cloud and further broke down more conditions to highlight both
volume flow crossover on the High and Extreme High MA's and also high and extreme high volume spikes on set period average
without bull\bear conditions. Original Bull/Bear
FREE

Features:
This is a slope indicator for TMA Bands indicator. It calculates slope of the center line. It supports 3 types of TMA Bands: TMA True (Non-repaint) Fast Line TMA (Repaints) TMA+CG (Repaints) It will help you determine whether price is Trending or Ranging based on the Threshold you set. Download extra TMA Indicators for strategy here: https://www.mql5.com/en/blogs/post/758718
How It Works: You can set the Slope Threshold for indicating Buy/Sell heightened levels. Suppose we set Thresh
FREE

This indicator is the converted Metatrader 4 version of the TradingView indicator "ATR Based Trendlines - JD" by Duyck. This indicator works by automatically and continuously drawing trendlines not based exclusively on price, but also based on the volatility perceived by the ATR. So, the angle of the trendlines is determined by (a percentage of) the ATR. The angle of the trendlines follows the change in price, dictated by the ATR at the moment where the pivot point is detected. The ATR percentag
FREE

The Pivot Point indicator automatically calculates and displays the pivot point line and support and resistance levels. Pivot can be calculated according to the Classic, Floor, Fibonacci, Woodie, Camarilla or DeMark formula. It is also possible to select the period for calculating the indicator. A trader can choose from daily, weekly, monthly, or user-defined periods.
Types of pivots Classic Floor Fibonacci Woodie Camarilla DeMark
Main features The indicator shows the current and historic
FREE
L'indicateur présenté évalue la volatilité d'un instrument financier et donne avec une grande efficacité des signaux sur les moments de changements significatifs dans la direction du mouvement des prix. L'indicateur est intuitif et facile à utiliser. Le signal indicateur est généré après l'achèvement de la formation de la barre, sur laquelle l'indicateur change sa position par rapport à zéro. L'indicateur ne redessine jamais le signal. Les signaux de l'indicateur doivent être confirmés par le pr
FREE

"Capture the sleeping and waking alligator." Detect trend entrance/exit conditions - this indicator can also be tuned according to your trading style. You can adjust a confidence parameter to reduce false positives (but capture less of the trend). This is based on a modification of the Alligator indicator by Bill Williams, an early pioneer of market psychology. 2 main strategies: either the " conservative" approach to more frequently make profitable trades (at a lower profit), or the " high r
FREE

This indicator is designed to detect high probability reversal patterns: Double Tops/Bottoms with fake breakouts . This is the FREE version of the indicator: https://www.mql5.com/en/market/product/26371 The free version works only on EURUSD and GBPUSD! Please read also the blog post " Professional Trading With Double Tops/Bottoms And Divergences! " which explains the concepts behind the ULTIMATE Double Top/Bottom indicator and how you can use a professional top-down approach. The provided video
FREE
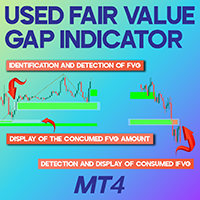
Used FVG (Used FVG-iFVG) indicator
is a valuable tool designed for ICT and Smart Money traders, aiding them in detecting price imbalances and Fair Value Gaps (FVG) on the MetaTrader 4 (MT4) platform. This indicator highlights bullish FVG zones in green and bearish FVG areas in brown, allowing traders to pinpoint crucial market levels. As these zones are gradually filled, the rectangular markers shrink and eventually vanish from the chart, providing a clear representation of market shifts and
FREE
Le MetaTrader Market offre un lieu pratique et sécurisé pour acheter des applications pour la plateforme MetaTrader. Téléchargez des versions démo gratuites de Expert Advisors et des indicateurs directement depuis votre terminal pour les tester dans le testeur de stratégie.
Testez les applications dans différents modes pour surveiller les performances et effectuez un paiement pour le produit que vous souhaitez en utilisant le système de paiement MQL5.community.
Vous manquez des opportunités de trading :
- Applications de trading gratuites
- Plus de 8 000 signaux à copier
- Actualités économiques pour explorer les marchés financiers
Inscription
Se connecter
Si vous n'avez pas de compte, veuillez vous inscrire
Autorisez l'utilisation de cookies pour vous connecter au site Web MQL5.com.
Veuillez activer les paramètres nécessaires dans votre navigateur, sinon vous ne pourrez pas vous connecter.