Regardez les tutoriels vidéo de Market sur YouTube
Comment acheter un robot de trading ou un indicateur
Exécutez votre EA sur
hébergement virtuel
hébergement virtuel
Test un indicateur/robot de trading avant d'acheter
Vous voulez gagner de l'argent sur Market ?
Comment présenter un produit pour qu'il se vende bien
Expert Advisors et indicateurs gratuits pour MetaTrader 4 - 9

A forward-looking EA that combines a Bollinger band and a parabolic indicator. Simple trading based on day trading. The maximum drawdown is a single digit, and the balance forms a clean upward trend. The stop loss value is larger than the take profit, but the winning percentage is profitable.
The maximum number of lots is 0.1. The maximum number of positions is 1. The usage time is 30M.
FREE

AD Trend line draws trend lines on the basis of A/D indicator (Accumulation/Distribution). When A/D indicator breaks a trend line, the probability of the trend reversal is very high. This is a multitimeframe indicator which can display values from higher timeframes. Parameters Time-frame — Select a timeframe; zero is the current timeframe of the chart; Trend Line — Display lines on the chart; Apply to — Apply lines to close the candle's highest/lowest value; Width line — Width of the line; Style
FREE

Variable Index Dynamic Average (VIDYA) developed by Tushar Chande by default is contained in MT5 but not in MT4 platform and it is a dynamic EMA (Exponential Moving Average) that adjusts its Length (LB Period) automatically in response to Market Volatility originally measured through the Chande Momentum Oscillator(CMO). CMO value is used as the ratio to the smoothing factor of EMA ( The New Technical Trader by Tushar Chande and Stanley Kroll, John Wiley and Sons, New York, 1994). The higher th
FREE
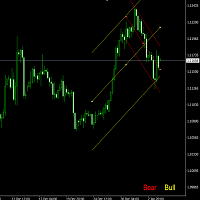
This indicator judges current trend, with Linear regression and the angle. Each parameters setting contents below. Period Period from current
Angle The angle of judging the trend
Width of Lines Width of Linear regression lines* Font size Font size of display text
Lines&Text colour Colour of display lines and test
* This parameter judges that if lines spreads too wide, there is no trend.
FREE

FZR indicator determines fractal zigzag reversal pattern of all the time frames of the chosen symbol and shows the information in the Info label. Indicator draws the detected pattern in the chosen time frame and also you can select in the menu to draw the trend line according to FZR peaks. What it is FZR? See the first picture in the screenshots. As you can see for every peak of FZR the AO indicator must cross zero line. FZR indicator determines the trend direction.
How to use FZR for trading?
FREE

The FxSProMT indicator shows the current market trend and trend change.
Indicator Parameters Ind_Period - the number of previous bars used to calculate actual values. Number_Bars - the number of bars to display the indicator.. Too many bars may significantly slow down the operation of the trading terminal. Signal_Sound - sound alert to notify of trend change. The sound can be played multiple times until the signal is confirmed (the bar closes). Default is disabled. Signal_Alert - an alert to n
FREE

NOTE!: The trend vote and the buy sell option shall match to the same direction before you put a trade!!
Indicator that uses Kalman filters (same as used on autonomous vehicles for data fusion between different sensors / technologies such as RADAR, LIDAR and Camera with Artificial Intelligence for object detection) by using the high and low price in order to identify buy and sell signals as indicated on the graph.
This indicator can be used on any timeframe with any currency or symbol.
Thi
FREE

Double Exponential Moving Average (DEMA) is a well-known trend indicator. DEMA was developed by Patrick Mulloy and published in February 1994 in the "Technical Analysis of Stocks & Commodities" magazine. It is used for smoothing price series and is applied directly on a price chart of a financial security. Besides, it can be used for smoothing values of other indicators. The advantage of this indicator is that it eliminates false signals at the saw-toothed price movement and allows saving a posi
FREE

This Dashboard is free to download but is dependent on you owning the Advanced Trend Breaker . Get the indicator here: https://www.mql5.com/en/market/product/66335
The Dashboard will show you on a single chart all the timeframes (M1 to Monthly) with their own status for the indicator: Advanced Trend Breaker
all time frame and all symbol: smart algorithm detects the trend,Support and resistance, filters out market noise and find breaker of entry signals!!!
!!!
How to unders
FREE

Hallo!
Ich bin Tatsuron, ein japanischer Privatanleger. Wir verwalten über 1 Milliarde Yen in Forex.
Lassen Sie mich einen sehr nützlichen Indikator vorstellen, den ich verwende.
The indicator that is the basis of the market price. ThreeLine has improved the Moving Average (SMA) to answer the long-term SMA numerical settings. The more you repeat daily trades and verifications, the more credible the Three Line will be. If the angle of ThreeLine is upward, it will be white. If it faces down
FREE

The Fisher Transform is a technical indicator created by John F. Ehlers that converts prices into a Gaussian normal distribution. The indicator highlights when prices have moved to an extreme, based on recent prices. This may help in spotting turning points in the price of an asset. It also helps show the trend and isolate the price waves within a trend. The Fisher Transform is a technical indicator that normalizes asset prices, thus making turning points in price clearer. Takeaways Turning poi
FREE

Introducing MACD Jurik—an advanced indicator designed to enhance your forex trading strategy by integrating custom moving averages based on the Moving Average Convergence Divergence (MACD) with the MetaTrader 4 indicator, MACD.
Jurik moving averages are renowned for their accuracy and reliability in analyzing price movements in the forex market. They offer traders smoother representations of price action, reducing noise and providing clearer signals for identifying trends and potential revers
FREE

This Expert Advisor is our latest trading system and it is designed to work with EURUSD and GBPUSD . This EA produces good results with medium spreads. It opens a market order following the market trend and then it opens Market Orders with different amount of lots to close all orders or single order in profit with small amounts. To close trades, it uses a cumulated closing function or a closing function for each trade opened. It works with all time frames, better with lower TF, and you can us
FREE
StarkerFX EA is a martingale and trend following robot with trailing stop . This expert advisor is using MACD and Parabolic SAR indicators. There are no complicated settings. The only one input is the equity multiplier for automatic lot calculation. If you want to change it, please backtest it before using on real account. higher equity multiplier = higher lots = higher risk (recommended setting is: 1.0) This EA has been optimized for EUR/USD currency pair and for M5 timeframe. Feel free to ba
FREE

LOOK AT THE FOLLOWING STRATEGY WITH THIS INDICATOR. Triple RSI is a tool that uses the classic Relative Strength Indicator, but in several timeframes to find market reversals. 1. ️ Idea behind the indicator and its strategy: In Trading, be it Forex or any other asset, the ideal is to keep it simple, the simpler the better . The triple RSI strategy is one of the simple strategies that seek market returns. In our experience, where there is more money to always be won, is in the marke
FREE

This powerful tool helps you to easily access Fibonacci tools at different times and in different markets. This tool has the ability to send signals based on Fibonacci as well as setting alarms to be aware of broken Fibonacci levels. Among the capabilities of this tool are the following:
Identifies market trends Fibonacci auto design If Fibonacci levels are broken, it sends a message Send Fibonacci signal
Manuals: After selecting the target market, run the tool In the input settings accordi
FREE

Th3Eng Panda trend is a powerful indicator that works perfectly for scalping trades as well as swing trades. Th3Eng Panda trend is not just an indicator, but a very good trend filter. You can setup it on H4/H1 to Find the main trend and start scalping on M5/m15/m30 Time Frames. Works with all pairs and all Time Frames.
Inputs:
Section #1 History : Maximum number or bars to draw the last signals. (Default 5000) Draw Candles : Draw red candle when sell signal and green when buy signal. (tr
FREE

T-Explorer is a Real Time Optimized MetaTrader 4 tool that provides tradable information based on the 10 of the most popular and reliable technical indicators in many timeframes. Our machine learning models calculate the optimum rules and configuration for each indicator in order to provide high probability signals of success. Users are able to customize T-Explorer by selecting suitable timeframes and mode ( FAST, MEDIUM, SLOW ) for the indicators to be used. T-Explorer aggregates and combines o
FREE

This indicator is a useful tool for visualising cyclic components in price. It calculates the Discrete Fourier Transform (DFT) of a price chart data segment selected by the user. It displays the cycles, the spectrum and the synthesised signal in a separate window. The indicator is intended as a learning tool only, being unsuitable for providing actual trade signals. Download the file - it is a free toy. Play with it to understand how signals can be transformed by controlling their cyclic comp
FREE

1. Make sure you trade only with GBP/USD on an 1h chart as this model is built specifically for the hourly Cable trading. 2. If you are backtesting the EA during weekends, make sure to specify a reasonable spread (such as 30 or 50) instead of using current spread because the market is not trading and the current spread may be some awkward number. During weekdays, feel free to use current spread as it is the correct current spread value. 3. If you want to have an even more stable-performing EA,
FREE

After 7 years I decided to release some of my own indicators and EAs for free.
If you find them useful please Show support with a 5-star rating! Your feedback keeps the free tools coming! See other my free tools as well here
_________________________________ Bollinger Bandwidth Indicator for Advanced Market Volatility Analysis The Bollinger Bandwidth Indicator, meticulously developed in MQL4, is a sophisticated tool designed to elevate forex trading analysis. It harnesses th
FREE

Suitable for Beginners and Satisfying for Experienced Traders
Are you an experienced trader? I don't have to explain anything to you. You know what a reliable backtest and a long time in the market are worth. Have fun with all the informations at your disposal. Are you a beginner? You don't have to worry about setting any operational parameters or doing a lot of backtesting to find the ideal setting. Just look at the statistics and assess the risk you want to take.
Do a backtest to ensure the
FREE

This indicator displays Point & Figure charts (PnF charts) in the indicator window. PnF charts show only price movements that are bigger than the specified box size. It helps to eliminate noise and allows focusing on main trends. Time is not a factor here. Only price movements are taken into account. That is why PnF chart is not synchronized with the main chart it is attached to. More about PnF charts: http://stockcharts.com/school/doku.php?id=chart_school:chart_analysis:pnf_charts Indicator wor
FREE
This indicator is an oscillator built on the principle of the classic Momentum. The indicator is part of a series of indicators - Hull Line AM, Hull Momentum AM, Hull Candles AM, Hull Signal AM . The indicator represents the difference between the current price and the price some number of periods ago. The difference from the classic indicator Momentum is the preliminary smoothing of prices according to the method proposed by Alan Hull.
Using the indicator: It should be taken into account tha
FREE

This SMART Expert Advisor trades SAFE and STEADY a nd manages all position's risk.
This is why we call it Smart Safe Steady .
Features Scalper: It is Scalper EA, but does not accept risk a lot to trade over sized, although you can bypass it's default setting in your own risk. Conservative: It is not going to keep trades open in high volatile market so it is SAFE and would close the trades even in zero profit. Martingale: This is not loss accepting so in case of loss, it runs special type of M
FREE

This indicator shows us the trend or direction of the market and a possible stop loss
This indicator works with two parameters, period and multiplier. Buy and sell signals are generated when the indicator crosses the closing price and it changes color.
This indicator is used in all types of markets such as stocks, futures, forex, cryptos, additionally it can be used in different time periods: hours, daily, weekly, etc.
It is recommended not to use it while the market is sideways, this can
FREE
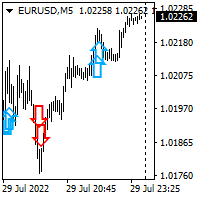
Hello all. This indicator helps you to open a trade, when break out occurred, also you can add to your position and ride it if trend continued. I use it on 1-5 min chart, as you can use short stop loss. Also profit target should be small as well. It is better to enter few small position, so you can book some profit early and ride the rest for bigger gains. Look at the past to have a plan. Enjoy.
FREE

A simple script that can delete all the drawing objects on a chart, or just the objects of a specific type.
Settings:
DeleteObjectsOfType By default the value will be blank which means ALL drawing objects on the chart will be deleted. If you only wish to delete specific types of drawing object, change this setting to the type of object to delete. For example, Fibonacci Retracement, Text, Label or Trend Line.
Please see the demonstration video for more information.
FREE

*This is tradingview indicator converted to mql5*
The Trend Magic Indicator is a popular technical analysis tool used to identify the direction of a market trend and potential trend reversals. It is a versatile indicator that can be applied to various financial instruments and timeframes. The Trend Magic Indicator consists of a combination of moving averages and a volatility-based filter. It aims to smooth out price fluctuations and provide a clearer visualization of the underlying trend. He
FREE

Double Price Channel Price channel indicator for a certain number of bars specified in the settings.
Indicator lines represent dynamic support or resistance levels. The upper limit is the price maximum for a certain number of periods, the lower one is the minimum. Unlike moving averages, which are based on close prices, the indicator is not “distracted” by small fluctuations. It will be recalculated only if the boundaries change. If the latter happens, then it is worth seriously thinking abou
FREE

PREVIOUS INDICATOR’S DATA MA CROSSOVER https://www.mql5.com/en/users/earobotkk/seller#products P/S: If you like this indicator, please rate it with 5 stars in the review section, this will increase its popularity so that other users will be benefited from using it.
This indicator notifies and draws an arrow on the chart whenever the MA line has crossed over its previous indicator’s data MA filtered by MA Trend. It also displays total pips gained from all the entry set-ups. Setting · You
FREE

This EA has been designed to achieve stable trades regardless of market fluctuations. The optimal time frame for this EA is M5. It calculates the price changes in higher time frames, such as H1 and H4, and looks for entry points after a significant trend has occurred and the price starts to retrace.
It is recommended to set wider take profit and stop loss levels. This setup works well for one trade per day. If a trade ends in a loss, the EA waits for an opportunity to re-enter with double the
FREE

Dear Friend ... I hope and Wish a happy new year to all of you .. as i told you < this is a simple Utility EA can helps you in your trading . he helps you to ensure that your decision is correct to enter the market . it is work on all currency pairs , stocks ,indices and crypto . its easy to install . no complicated inputs. this EA works as follows : it's main work is to detect the highest price and the lowest price on H4 & H1 time frame and draw resistance and support and trend every line has
FREE

After 7 years I decided to release some of my own indicators and EAs for free.
If you find them useful please Show support with a 5-star rating! Your feedback keeps the free tools coming! See other my free tools as well here
_________________________________ Bollinger %B Indicator for Enhanced Forex Trading Analysis The Bollinger %B Indicator, expertly crafted in MQL4, is a dynamic tool designed to revolutionize forex trading analysis. Leveraging the power of Bollinger Bands
FREE

Free parabolic SAR expert advisor is a completely free expert advisor that trades using Parabolic SAR dots. It opens and closes trades based on the first dots of a new trend. The various settings are explained below.
Parameters NOTE: The default settings are just place holders and not necessarily the best. Use the settings that best suites you or your strategy. Lots - This is the lot size of the EAs trades. 0.1 is the default setting. StopLoss - Stop loss setting. AllowBuy - Set to true to all
FREE
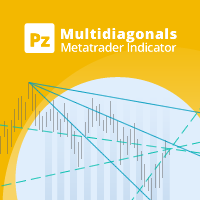
This indicator connects past price points drawing diagonals and trend lines, which converge in the future creating hidden reversal points. [ Installation Guide | Update Guide | Troubleshooting | FAQ | All Products ] Find hidden reversal points Spot convergence zones easily Dense criss-cross zones are reversal points Configurable amount of lines and price points Configurable colors
How to use the indicator The indicator draws several lines on the chart, and where many of these lines converge a
FREE

This indicator is an addition to "Trend Edges."
The "Trend Edges histogram" indicator determines whether the trend is rising or falling. It is suitable for any time frame (tested on DAX).
Find a trending pair, index or CFD. Additionally :
-Sound alert on trend change.
-Alert Notification
-Alert Notification on your mobile phone Check my other indicators.
FREE
Strong and weak Pairs is a trend following indicator to help you choosing the pairs to trade based on the currency score. Strong and weak Pairs is comparing currencies position to the moving average for all major pairs then display the position score from Zero (0) to Seven (7) with two lines on the chart. 7 is the strongest currency and zero is the weakest currency. Additionally there is a dashboard displaying all the currencies score to choose the pair you will trade. Strong and Weak Indicator
FREE

This Indicator is based on Mr. Dan Valcu ideas.
Bodies of candles(open-close) are the main component used to indicate and assess trend direction, strength, and reversals.
The indicator measures difference between Heikin Ashi close and open.
Measuring the height of candle bodies leads to extreme values that point to trend slowdowns. Thus quantifies Heikin Ashi to get earlier signals.
I used this indicator on Heiken Ashi charts but, it's possible to choose to calculate Body size based on
FREE

This indicator is a histogram showing the trend based on 3 different moving averages. When all averages are set in ascending order, the indicator is green, and when in descending order, it is red. If the averages do not show a trend, the color is yellow. Additionally, each average can have different settings, such as Mode MA and Price MA. You can also set an alert and receive notifications on your phone.
To enable the alert and push notification, you need to activate them first in the MT4 setti
FREE

The "Trend Edges" indicator determines whether the trend is rising or falling. It is suitable for any time frame (tested on DAX).
The indicator should be treated like Bollinger Bands, meaning that if it breaks out upwards, you can buy with a stop loss below the lower edge.
Find a trending pair, index or CFD. Additionally :
-Sound alert on trend change.
-Alert Notification
-Alert Notification on your mobile phone Check my other indicator "Trend Edges histogram"
FREE

Simple EA based on bottom trend and down impulse to open a buy trade. Include a trailing stop for each trade. Best results on EURUSD in H1 timeframe. Open only buys order for the moment. Wait for the next update to get more profitable features. Open a moderate quantity of trades every period Find other offers, reductions and more at https://gestionbb.com/boutique/ --- Recommendations --- Pairs : EURUSD Timeframe : H1 Minimum deposit : 500 USD
Have fun!
FREE

Based on the trend-following principle of CCI, it has been improved to become an indicator that can identify the reversal of the trend and its development direction, that is, it can identify the top and bottom attenuation of the oscillating trend in the trend market. feature The red and green columns represent the trend of bullish or bearish development under the current cycle. The blue line shows the position and attenuation of the current price trend in the current cycle. The upper and lower r
FREE
This indicator helps you to Scan symbols which are in the Market Watch Window (in demo Max 15 Symbol) and filter out trends with alerts. It works based on the most popular indicator "Bollinger Bands" which is used by many traders for trading: When box color changes to " Green " or " Red " color, it indicates you for trend change for long and short entry. And also you will get alerted on screen. When it changes to " Green ", it indicates you that trend is going upwards, and you can take the long
FREE
Indicator Rua Alert Trend Line. This indicator will notify when the price breaks any trendline on the chart. Notifications will be sent to the phone and on MT4. Custom parameters: in_NumbersAlert: The number of notifications that will be sent when the price breaks the trendline. A product of Ruacoder Provide code indicator and EA services upon request. Contact: Telegram : https://t.me/Ruacoder
FREE
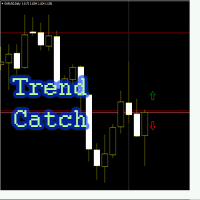
Советник "Trend_Catch" входит в рынок по средним скользящим и фракталам. Средние скользящие определяют направление тренда, фрактал - момент входа входа в рынок. В советнике прописан безубыток, трейлинг стоп, мантингейл по желанию Пользователя
Настройки советника: Close_by_Reverse_MA_Signal = false; закрыть ордер на покупку, если быстрая МА находится выше медленной, закрыть ордер на продажу, если быстрая МА находится ниже медленной, если параметр Invert_sig включен (инвертирован сигнал), сигнал
FREE

The MT4 indicator that we are describing is designed to provide traders with an alert, notification, and email when Fibonacci levels are crossed. The Fibonacci levels are calculated based on the zigzag indicator, which helps to identify potential trend reversals in the market. When the indicator detects that a price has crossed a Fibonacci level, it will trigger an alert and send a notification to the trader's MT4 mobile app. Additionally, the indicator can be configured to send an email to the
FREE

STOCHASTIC Dashboard Panel This indicator helps you to scan symbols which are in the Market Watch window and filter out a trend according to STOCHASTIC .
In technical analysis of securities trading, the stochastic oscillator is a momentum indicator that uses support and resistance levels. Dr. George Lane developed this indicator in the late 1950s.[1] The term stochastic refers to the point of a current price in relation to its price range over a period of time.[2] This method attempts to pr
FREE

Version History Date Version Changes 07/08/2022 1.00 Initial Release Description The Aroon indicator is a technical indicator that is used to identify trend changes in the price of an asset, as well as the strength of that trend. In essence, the indicator measures the time between highs and the time between lows over a time period. The idea is that strong uptrends will regularly see new highs, and strong downtrends will regularly see new lows. The indicator signals when this is happening, and
FREE

Simple indicator that shows external ( outside ) bars. In certain cases, external bars can be seen as strong trend bars instead of range bars. This can be observed when a with-trend external bar occurs at a reversal from a strong trend. It will help you notice more easily different patterns like - Inside-outside-inside, Inside- Inside -inside, outside - Inside -outside, etc. Works perfectly with my other free indicators Internal bar and Shadows
Inputs: How many history bars to calculate on l
FREE

YOU CAN NOW DOWNLOAD FREE VERSIONS OF OUR PAID INDICATORS . IT'S OUR WAY OF GIVING BACK TO THE COMMUNITY ! >>> GO HERE TO DOWNLOAD
Momentum channel is a simple momentum based system yet with a great degree of accuracy in detecting turning points. The market momentum are defined by Average True Range Channels . When price breaks these channels most times , it is an indication of a shift in market momentum and thus a possible new trend formation. The system can be traded on any time frame an
FREE

Free Scalping is a comprehensive manual system developed for the most efficient trading at any market conditions and time scale.
The system is based on two main blocks:
1. The block of trend determination that calculates dynamic support and resistance. The function of auto-optimization is available for this block.
2. The block of price deviation from its median based on the big set of regressions to get the statistically-valid result. Entry rules For buys:
1. The trend goes up
2. The pr
FREE

Necessary for traders: tools and indicators Waves automatically calculate indicators, channel trend trading Perfect trend-wave automatic calculation channel calculation , MT4 Perfect trend-wave automatic calculation channel calculation , MT5 Local Trading copying Easy And Fast Copy , MT4 Easy And Fast Copy , MT5 Local Trading copying For DEMO Easy And Fast Copy , MT4 DEMO Easy And Fast Copy , MT5 DEMO MACD is called Convergence and Divergence Moving Average, which is developed from the double e
FREE

Key Features: Type of Indicator: Line Break Chart Indicator Usage: Identifying trend reversals and potential market turning points. Input Parameters: The primary input parameter is 'Lines_Break,' which represents the number of lines the price needs to move to create a new line in the opposite direction. How it works: The indicator draws green and red histogram bars to represent the line break chart. Green bars indicate an upward trend, and red bars indicate a downward trend. The indicator calcul
FREE

Moving Average Rainbow Stack: Free: Single Currency & Single Timeframe MA Stack Very useful for finding current and higher timeframe trends. Best suited for long term trend based trading. Use fewer MAs for quick scalping. And not suitable during low volatility. Only use during high volatility and steady trending markets. Use this to enhance your existing Trend based strategies to find best trends.
Read detailed description https://abiroid.com/product/abiroid-ma-stack Available MTF and Scanner
FREE

You've probably heard about the Dow trend Theory, where higher highs and lows indicate an uptrend, and lower highs and lows indicate a downtrend. This indicator determines this trend based on the Dow Theory. You just need to enter a number representing the number of candles between extremes. The optimal solution is the number 3, unless you want to have the trend from M5 but you're on M1, then you need to multiply this number by 5. Check various combinations to trade with the trend. In the scree
FREE

The M.O.D.E stands for " Multiple Oscillator Divergence Exit ". It is an indicator which signals a divergence between the price, and multiple oscillators. It is initially an exit indicator because it signals the weakening of a trend, but it could be used as an entry signal if used analytically Key Features: Check many divergences at once Non repainting Sends Alerts and Push Notifications You could load the M.O.D.E onto a single chart, and be able to see the divergences happening on multiple os
FREE

Modified Parabolic SAR: Your Reliable Market Assistant This enhanced version of the Parabolic SAR indicator effectively reflects the trend direction and can serve as an excellent addition to your trading strategy. Advantages: Trend Direction Reflection: The indicator accurately depicts the market trend direction, aiding you in making informed trading decisions. Signal Filtering: It can serve as an effective filter, complementing your strategy by helping to eliminate false signals and execute mo
FREE

This indicator is the translated version of Anıl ÖZEKŞİ's MOST Indicator, developed on the Matriks Data Terminal, into the MQL4 language. It is a trend-following indicator and quite successful. Its usage will be free and unlimited for a lifetime. You can click on my profile to access the MQL5 version of this indicator. You can also get your programming requests for MQL4 and MQL5 languages done at İpek Bilgisayar with an invoiced service. You can reach İpek Bilgisayar at www.ipekbilgisayar.org .
FREE

MACD Trend FREE is Expert Advisor for EURJPY based on MACD Indicator . You can completely edit settings of MACD Indicator, TakeProfit, StopLoss and TrailingStop. Default paramters are optimized for best results. But you can test other settings for antoher currency pairs or timeframe. MACD Trend FREE has been tested from year 2003 to 2021 . My test used the real tick data with 99,90% accuracy. Doesn't use Martingale or other dangerous strategies.
Recommendations
Symbol: EURJPY Timeframe:
FREE
This indicator is one of the variants of the MACD technical indicator. The indicator is the difference between two moving averages with different smoothing periods. Each moving average is additionally smoothed by an adaptive digital filter. In a simplified sense, an adaptive digital filter is a moving average with effective smoothing. Using a digital filter allows you to smooth out sharp fluctuations with minimal signal delay.
Using the indicator: It should be taken into account that the value
FREE
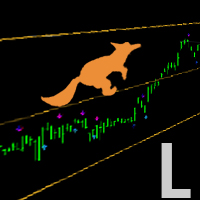
Search for an entry with low risk for trading by Lisek Moving Average Indicator. There are many ways to trade with Lisek Moving Average Indicator: Trend continuation (Trend trading). Trade pullbacks (Range trading). Trade breakouts. Trade reversals. Take profits or set stop-loss based on your MA.
Moving Averages are a frequently used technical indicator in forex trading, especially over 10, 50, 100, and 200 periods. Moving Averages are lagging indicators, which means they don't predict where
FREE

MetaTrader utility MTI (Main Trading Info) – shows the basic trading information for a trader, namely: average and current spread size Swap size for short and long positions Cost of 1 pip for 1 trading lot Stop Level size (minimum distance for placing pending orders) Time until the end of the current (red) and time until the start of the next (gray) trading session The time until the end of the current trading session is displayed in red, the time until the opening of the next session is display
FREE

Screener Breakout Congestion: Have you ever missed a trading opportunity because you were not looking at the chart of that market in that specific time frame? Here is this screener to help you identify congestion breakouts in the markets you want to follow in the different time frames required. Once you have identified the markets (forex, indices, CDF) and the different time frames (1M, 5M, 15M, 30M, 1H, 4H, Daily), the screener is represented by several buttons that change colour when the conge
FREE
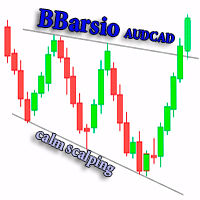
Free version of BBarsio Expert Advisor, which is intended only for AUDCAD pair. Works with a fixed minimum lot ! The Expert Advisor uses a weighted scalping strategy.
Currency pair: AUDCAD.
Timeframe: M5-M15.
The advisor's strategy:
the advisor finds possible reversal / trend continuation points; filters out some of the false signals; entry into the deal with only one order !!! exit from a trade by take profit or by a signal of a possible reversal; Default settings for M5.
The Expert
FREE

Just INDY is a simple, and easy to use trend and reversal indicator. It will continuously monitor the movement of the price actions searching for new trends establishing or strong reversals at extreme overbought, and oversold levels.
Parameters Signal Perios
Sent Notification Please Test it with Strategy Tester and see how it work.
Happy Trading...
FREE

Tarantula is a trend Expert Advisor that looks for entry points based on the standard Moving Average indicator. It works with two timeframes selected in the settings. The EA looks for the points of trend change and opens an order when the signal matches on different timeframes. All orders are protected by stop loss. However almost all orders are closed by the EA on a signal change.
Parameters SL - stop loss. TP - take profit. OnWork_1 - enable/disable searching for signals on the first timefra
FREE

T I P T O P
Tiptop is a trend following Expert Advisor that runs its own proprietary analysis and algorithm. No indicator is used to analyze the entry point. It based it only with each price bar movement and closing price. Same logic with "Volatility Watcher". For the exit plan, it uses the proprietary Sequence Method and implement the cut-losses-and-let-the-profit-run strategy. You will be surprised that at the closing of all trades, almost most of them are having a positiv
FREE
This EA keeps an eye on drawn lines and alerts according specification. It is a semi-automatic robot, which does NOT draw or change any lines. A user can draw them manually or use tools like Trendline-Architect or Channel-Architect, which draw lines automatically. Objects of type OBJ_TREND, OBJ_CHANNEL, OBJ_TRENDBYANGLE, OBJ_REGRESSION, OBJ_STDDEVCHANNEL and OBJ_FIBOCHANNEL will be detected - others will be ignored. The lines or channels have to have valid coordinates and rayed to the right, oth
FREE
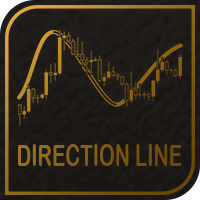
The Direction Line indicator shows you if the current market is in a up trend or uf ut's in a down trend. The sensitivity of the trend calculation ist customizable. You can adjust it till it fit's your strategy. Even as a beginner is this indicator easy to use and you'll see every trend.
Key Features of Direction Line Real-time trend calculations of all time frames Graphical Interface Identical calculation for all time frames Customizable trend sensivity No repainting
Settings / Inputs
Sen
FREE
MetaTrader Market - les robots de trading et les indicateurs techniques pour les traders sont disponibles directement dans votre terminal de trading.
Le système de paiement MQL5.community est disponible pour tous les utilisateurs enregistrés du site MQL5.com pour les transactions sur les Services MetaTrader. Vous pouvez déposer et retirer de l'argent en utilisant WebMoney, PayPal ou une carte bancaire.
Vous manquez des opportunités de trading :
- Applications de trading gratuites
- Plus de 8 000 signaux à copier
- Actualités économiques pour explorer les marchés financiers
Inscription
Se connecter
Si vous n'avez pas de compte, veuillez vous inscrire
Autorisez l'utilisation de cookies pour vous connecter au site Web MQL5.com.
Veuillez activer les paramètres nécessaires dans votre navigateur, sinon vous ne pourrez pas vous connecter.