Смотри обучающее видео по маркету на YouTube
Как купить торгового робота или индикатор
Запусти робота на
виртуальном хостинге
виртуальном хостинге
Протестируй индикатор/робота перед покупкой
Хочешь зарабатывать в Маркете?
Как подать продукт, чтобы его покупали
Бесплатные торговые роботы и индикаторы для MetaTrader 4 - 9

Check out other great products from https://www.mql5.com/en/users/augustinekamatu/seller
This indicator is the best so far at determining the currency strength of each pair. It provides stable values and is highly adaptive to market changes. It is a great tool to add to your arsenal to make sure you are on the right side of the trend at all times. No inputs required, it is simple plug and play. A Winning Trading Strategy This article describes the components and logic needed to develop a tr
FREE

H I G H - P R O B A B I L I T Y - B R E A K O U T T R E N D L I N E I N D I C A T O R This is no ordinary trendline indicator. It has a highly-probability algorithms incorporated in the script to display only trendlines that may give a very high chance of price breakout. The indicator is not a stand alone indicator. Trader should interpret it together with their very own analysis technique to come up with a more efficient trading strategy. You can use with it other trend indic
FREE
Это бесплатная версия индикатора Double Top Tracker . В отличие от полной версии некоторые функции отключены, а параметры не могут быть изменены. Индикатор параллельно анализирует ценовые графики нескольких валютных пар на всех таймфреймах и отправляет уведомление, как только обнаруживаются паттерны "Двойная вершина" и "Двойное дно". Когда цена достигает второй вершины, индикатор формирует сигнал. "Двойная вершина" (Double Top) — паттерн разворота тренда, который состоит из двух последовательны
FREE

Check the Trend Power This indicator is designed to identify the POWER of trend. This is NOT define bullish or bearish trend. It is quite easy to look at the power when the indicator line turns Green the trend are strong when the indicator line turns Red the trend are Weak strategy for trade is : Open possition only when the power go Green Exit possition when the power change to Red
FREE

Dear Friend ... I hope and Wish a happy new year to all of you .. as i told you < this is a simple Utility EA can helps you in your trading . he helps you to ensure that your decision is correct to enter the market . it is work on all currency pairs , stocks ,indices and crypto . its easy to install . no complicated inputs. this EA works as follows : it's main work is to detect the highest price and the lowest price on H4 & H1 time frame and draw resistance and support and trend every line has
FREE

Necessary for traders: tools and indicators Waves automatically calculate indicators, channel trend trading Perfect trend-wave automatic calculation channel calculation , MT4 Perfect trend-wave automatic calculation channel calculation , MT5 Local Trading copying Easy And Fast Copy , MT4 Easy And Fast Copy , MT5 Local Trading copying For DEMO Easy And Fast Copy , MT4 DEMO Easy And Fast Copy , MT5 DEMO
Strongly recommend trend indicators, automatic calculation of wave standard and MT5 ve
FREE

Latest Changes in 1.6 : Added Signal Modes input. Mode 1 : HPF positive go long blue, HPF negative go short red. Mode 2 : slow envelope only, HPF above upper envelope go long blue, HPF below lower envelope go short red. Mode 3 : HPF above both upper envelopes - go long blue, HPF below both lower envelopes go short red. Mode 4 : Go long blue if HPF crosses above upper slow, but fast upper should be below slow upper at the time, exit when HPF crosses below upper fast, reverse logic for short re
FREE

Implied Trader is a fully automatic, professional trading robot designed specifically for the foreign exchange market AUDCAD M30 timeframe. Parameter configuration is not necessary for EA. Only the size of the lot you intend to use needs to be chosen. 0.1 is the suggested lot size for a $2000 account. You can raise the lot size correspondingly if your account has more money. It has an intelligent algorithm that recognizes the trend. On the basis of the trend direction, the expert places orde
FREE

The MT4 indicator that we are describing is designed to provide traders with an alert, notification, and email when Fibonacci levels are crossed. The Fibonacci levels are calculated based on the zigzag indicator, which helps to identify potential trend reversals in the market. When the indicator detects that a price has crossed a Fibonacci level, it will trigger an alert and send a notification to the trader's MT4 mobile app. Additionally, the indicator can be configured to send an email to the
FREE

Технически индикатор представляет собой разницу двух фрактальных адаптивных скользящих средних. Фрактальная адаптивная скользящая средняя (FRAMA) — это умная адаптивная скользящая средняя, разработанная Джоном Элерсом. FRAMA учитывает изменения цен и точно следует за уровнем цены, оставаясь прямой в моменты колебания цены. FRAMA использует тот факт, что рынки фрактальны и динамически корректирует ретроспективный период, основанный на этой фрактальной геометрии. Индикатор имеет возможность отпр
FREE

Утилита для считывания новостей с сайта investing.com
Для доступа к сайту в меню терминала Options на закладке Expert Advisors необходимо добавить WebRequest: https://sslecal2.investing.com
В случае успешного считывания выводится сообщение о записи файла
Файл INV_week_this.txt записывается в папку MQL4\Files терминала и поддерживается в актуальном состоянии, обновляя данные по своему таймеру Присоединить утилиту можно к любому графику с любым таймфреймом, достаточно к одному чтобы поддержи
FREE

Ichimoku Cloud at a Glance (ICG) is an utility shows price vs cloud information for each timeframe at once. It works with any timeframe. Drop it to any chart and you will see where the price is currently at relative to the each timeframe' cloud range. You can switch the timeframe in the middle of the operation as well. There is a box and a letter under each timeframe caption. Box color - Blue : Price is above both Senkouspan A and B.(Above the cloud) - Yellow : Price is at between Senkousp
FREE

This indicator is a histogram showing the trend based on 3 different moving averages. When all averages are set in ascending order, the indicator is green, and when in descending order, it is red. If the averages do not show a trend, the color is yellow. Additionally, each average can have different settings, such as Mode MA and Price MA. You can also set an alert and receive notifications on your phone.
To enable the alert and push notification, you need to activate them first in the MT4 setti
FREE

Следит за текущим трендом, дает сигналы на восходящий тренд, нисходящий тренд и ослабление текущего тренда. Подкрашивает ситуацию на рынке соответствующим цветом. Инструмент - любой. Таймфрейм - любой. Подпишись на мой telegram канал, ссылка в контактах моего профиля . Преимущества: Индикатор не перерисовывает свои сигналы. Есть оповещения сигналов. Легок в использовании. Гибкие настройки. Подходит для торговли любыми финансовыми инструментами. Настройки: Наименование Описание Fast parameter
FREE

При запуске индикатора на любом графике с любым таймфреймом, он автоматически строит трендовые линии (линии поддержки и сопротивления). Кнопки включения (зеленая) и отключения (красная) позволяют управлять отображением уровней поддержки и сопротивления на основе короткого, среднего, длинного и очень длинного тренда. Например: чтобы показать только линии краткосрочного и долгосрочного тренда, установите их кнопки в зеленый цвет, а остальные в красный. Данная бесплатная версия работает только на п
FREE

Introduction The ST Cross indicator is based on the traditional Moving Average (MA) Cross which uses a fast and slow moving average. Entry signals to buy and sell are given when both moving averages cross. However with the basic strategy there are a lot of false signals. In order to filter the trades we use the 200 (MA) to identify the overall direction of the trend. Input Settings Master Trend Period - 200 Period moving average used to get the trend direction. Fast
FREE

This is the free version of EA LIUK TREND. The different is only this is limited use only, maximum 100 trades. But not limited for back test purpose. Lot will be only 0.01. For more detail in original version, please visit : https://www.mql5.com/en/market/product/86874
EA LIUK TREND The best way to get profit in trading is to follow the Market trend. Good money management is important too to keep your investment save, by minimizing the Draw Down. With this EA LIUK TREND, you will be able to c
FREE

RaysFX Market Trend Histogram Il RaysFX Market Trend Histogram è un indicatore personalizzato per la piattaforma di trading MetaTrader 4. Utilizza il Commodity Channel Index (CCI) per identificare le tendenze del mercato e visualizza queste informazioni in un istogramma intuitivo. Caratteristiche principali: Identificazione delle tendenze: L’indicatore calcola il CCI per ogni periodo di tempo e lo utilizza per determinare se il mercato è in una tendenza al rialzo o al ribasso. Visualizzazione in
FREE

Trail every trade position twice, automatically, in Average True Range! All manual trades are given a predetermined Risk-Reward closing point, ruled by a calculated motive that'll adjusts to volatility, also known as volume! The ATR, or average true range, is a technical indicator that measures the volatility, also known as " Volume , " of a financial instrument by taking into account the price range over a specific period of time. There’s an inevitable change of ATR value during price actio
FREE
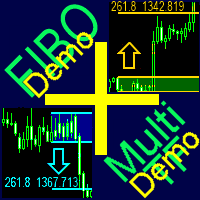
Готовая мультитаймфреймовая торговая система на основе автоматического построения и сопровождения уровней Фибоначчи на продажу и покупку по любому символу. Демо-версия - расчет последних 390 баров не производится.
Преимущества Определение направления тренда по 14 индикаторам в комплексе ( Cx ), на экстремумах ZigZag ( Z ), RSI ( R ), Impulse ( I ) Отображение значений 14 индикаторов, составляющих направление тренда ( Cx ) Построение горизонтальных уровней, линий поддержки и сопротивления, кана
FREE

Version History Date Version Changes 07/08/2022 1.00 Initial Release Description The Aroon indicator is a technical indicator that is used to identify trend changes in the price of an asset, as well as the strength of that trend. In essence, the indicator measures the time between highs and the time between lows over a time period. The idea is that strong uptrends will regularly see new highs, and strong downtrends will regularly see new lows. The indicator signals when this is happening, and
FREE
Check out other great products from https://www.mql5.com/en/users/augustinekamatu/seller
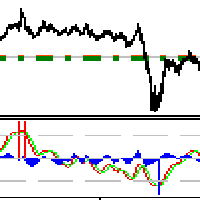
This indicator is the best so far at estimating reversal points especially on high time frames. It does not repaint and is based on a combination of moving averages computed using custom functions. No inputs required, it is simple plug and play. The principles used ensure that it can be used on CFDs, Commodities and Stock with incredibly great results. With proper money management and portfolio balancin
FREE

Simple indicator that shows external ( outside ) bars. In certain cases, external bars can be seen as strong trend bars instead of range bars. This can be observed when a with-trend external bar occurs at a reversal from a strong trend. It will help you notice more easily different patterns like - Inside-outside-inside, Inside- Inside -inside, outside - Inside -outside, etc. Works perfectly with my other free indicators Internal bar and Shadows
Inputs: How many history bars to calculate on l
FREE

Индикатор R Stoploss Signals основан на тренде, следующем за экспоненциальной скользящей средней.
Этот форекс-индикатор генерирует торговые сигналы на покупку и продажу в виде синих и красных линий, нарисованных на графике активности.
Линии синего цвета указывают на то, что тренд восходящий, и это сигнал на покупку валютной пары. Красные линии указывают на то, что тренд направлен вниз, и это является сигналом к продаже валютной пары. Предлагаемая линия стоп-лосса также включена в этот индик
FREE

Behaving in a similar fashion as the price action of a chart, the indicator uses " Trix " to opportune itself to the exposure of divergency, flat/low market volume, and price action expansion . The TRIX indicator nicknamed after the Triple-Exponential-average, is a momentum-based oscillator that filters minor price changes and fluctuations that are considered insignificant for forex trading whilst providing money making opportunities! Overall, TRIX is a leading indicator that shows diverge
FREE

MULTI TRADER TOOL - SUPPORT / RESISTANCE, ONE CLICK CLOSE / OPEN, AUTO CLOSE, GRID ORDERS, ALERTS.
You should use this Panel on FULL SCREEN MODE (F11).
HotKeys: B - Open Market Buy Order with OneClickOpen Settings. S - Open Market Sell Order with OneClickOpen Settings. G - Open Grid Orders with Grid Panel Settings. R - Add Support/Resistance Settings to selected trend and horizontal lines. If you have any questions, ask in a private message or in the comments section.
FREE

The Oscillators histogram indicator is designed to show the histogram of some oscillator indicators. These oscillators are RSI, Momentum, ATR and CCI indications. Our Popular Products Super Oscillator HC Cross Signal Super Cross Trend Strong Trend Super Signal Parameters Oscillators - indicator name. Period - indicator period. Level indicator - indicator level. MAPrice - applied price for Momentum, CCI or RSI. Alerts - enable/disable alerts. Email Notification - enable/disable Email notifica
FREE
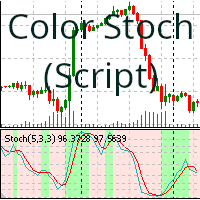
Этот скрипт (перетаскиваемый) окрашивает фон стохастического осциллятора в зависимости от тенденции покупки или продажи. Цвет фона определяется положением линий индикатора. Параметры, которые можно изменить, следующие:
%K Period: Период %K. %D Period: Период %D. Slowing: Период замедления. Price Field : Low/High или Close/Close MA Method: Simple, Exponential, Smoothed, Linear weighted. Color Positive Trend: Цвет фона для восходящей тенденции. Color Negative Trend: Цвет фона для нисходящей тенде
FREE

The logic of this robot is simple, but very powerful. It monitors the current trend using long-term candlesticks, using multiple candlesticks to increase reliability. The EA first monitors the current trend and then places orders in line with the trend. The timing of the orders is based on an internal RCI indicator. The entry value for RCI can be freely adjusted. A value closer to 1 will increase accuracy, but decrease the frequency of entries. It trades with a TP of 50 and an SL of 50, but if
FREE
D1 Free Fibo Channels with support and resistences...
Become a constantly profitable 5-star forex trader!
We offer a few indicators to support you understand and analyse the market! With our strategies you will improve your trading system and bacome an expert...
We have indicators for trend direction, market direction and others.. for multi-time frames and that covers all majors or your favorite trading symbols! Some of them offer a customizable calculation parameters... or Graph features
FREE

Gladius EA Standard is a trading robot specifically designed for the forex market. It uses both technical and standard indicators to identify the best trading opportunities and maximize the potential of every trade. It is best suited for trading the GBPUSD pair and offers the flexibility to set up single, double or triple entries based on your needs. Gladius EA Standard also features a news filter and mathematical predictions to analyze the market, as well as a Super Trend period to track market
FREE
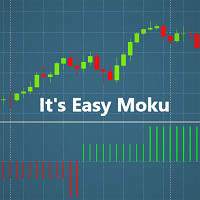
Introduction:
Welcome dear Users, This indicator has been developed in order to help traders who are daily struggling to find a strategy . I have always been acctracted by Ichimoku Strategy, however took me sometime figure out how it does work. Easy Moku makes Ichimoku Simple!
Aspect:
Easy Moku shows 2 principal ICHIMOKU signals: kijun sen/tenken sen sen crossover Span A Span B + Kijun sen/tenken sen Get Rid of all the Ichimoku Lines!
On the Mt4 Chart the Easy Moku paints an Histog
FREE

The MP Andean Oscillator is used to estimate the direction and also the degree of variations of trends. It contains 3 components: Bull component, Bear component and Signal component. A rising Bull component indicates that the market is up-trending while a rising Bear component indicates the presence of down-trending market. Settings: Oscillator period: Specifies the importance of the trends degree of variations measured by the indicator. Signal line per: Moving average period of the Signal line
FREE

The Direction Line indicator shows you if the current market is in a up trend or uf ut's in a down trend. The sensitivity of the trend calculation ist customizable. You can adjust it till it fit's your strategy. Even as a beginner is this indicator easy to use and you'll see every trend.
Key Features of Direction Line Real-time trend calculations of all time frames Graphical Interface Identical calculation for all time frames Customizable trend sensivity No repainting
Settings / Inputs
Sen
FREE

The Candle High Low Exit indicator uses the highest high and the lowest low of a range to draw trailing stop lines (orange under buys, magenta over sells) that advance with the trend until the trend changes direction. Moreover, the trailing stop lines are generated to support the order’s trend direction (long or short): In an upward trend, the long trailing stop line (orange line under buy) appears and advances upward until the close crosses under the line.
In a downward trend, the short tra
FREE

Dear Friends .. As I promised you , this is a demo version of my Expert Advisor that works only on Daw Jones (US30)
It works on simple strategy , Scalper and trend EA . It use the manual lot size that you put in parameters and use the trailing stop to minimize the lost value as much as it dose ,, So u need to put the lot size ( usually it 0.1 minimum in most companies ) and put your Trailing stop value (if you want to cancel the trailing just put 0 in the parameter ) (for DJ try to multiply
FREE
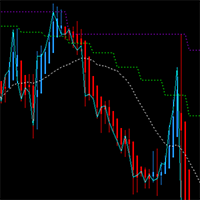
This MT4 chart trend checker cuts through the noise of market volatility to provide a clearer picture of trends and price movements. It includes the following features that can provide more clarity during market assessments: 1 customizable multi-period moving average Optional Heikin-Ashi candles 3 switchable focus modes Distinct colors for easy analysis
Link to MT5 version: https://www.mql5.com/en/market/product/106707/
This indicator shows your preferred moving average from multiple time fr
FREE

Индикатор вычисляет и рисует линии на графике. Два типа тренда: Тренд A: линия отрисовывается по локальным минимумам для восходящих трендов и по локальным максимумам - для нисходящих. Тренд Б: линия отрисовывается по локальным максимумам для восходящих трендов и по локальным минимумам — для нисходящих. Нужно, чтобы ситуация полностью удовлетворяла нескольким условиям, которые можно настроить во входных параметрах (см. также рис. 4): MinBarAge : количество баров до последней базовой точки линии н
FREE

After purchasing, you can request and receive any two of my products for free!
После покупки вы можете запросить и получить два любых моих продукта бесплатно! Советник основан на трех трендовых индикаторах В советнике присутствует фильтр по старшему таймфрейму, TP, SL, Trailing Stop и усреднение. Вход выполняется по сигналу трендовых индикаторов, в усреднении открываются два противоположных ордера. По умолчанию валютная пара GBPUSD, H1 (возможно другие валютные пары, и другой временный инте
FREE

PLEASE HELP REVIEW/ SUPPORT/ SHARE THIS OTHER INDICATOR HERE https://www.mql5.com/en/market/product/51637 AS YOU DOWNLOAD THIS ONE FOR FREE. THANKS.
The indicator was created to make trading very easy to understand. It is based on five moving average crosses and pivot points. Download the "EASY TREND" on my Product list for a more advanced and profiting trades. You can trade with this indicator alone and get the maximum out of the market. If you are a new trader, just open your chart windo
FREE

The Trend Finding Channels indicator was developed to help you determine the trend direction by drawing channels on the graphical screen. It draws all channels that can be trending autonomously. It helps you determine the direction of your trend. This indicator makes it easy for you to implement your strategies. The indicator has Down trend lines and Up trend lines. You can determine the price direction according to the multiplicity of the trend lines. For example , if the Down trend lines s
FREE
The Ergodic is an oscillator based on William Blau's True Strength Index, which is based on Momentum to which double smoothing has been applied. 100* EMA(EMA(Momentum) / EMA(EMA( |Momentum|)) The Ergodic adds a moving average to the TSI which will act as a Signal Line. This oscillator can be used to identify trend reversal zones, or trend continuation phases.
VERY USEFUL WHEN USED IN CONJUNCTION WITH THE CURRENCY INDEX.
L' Ergodic è un oscillatore basato sul True Strenght Index di William B
FREE

This indicator determine price volatility using correlation between Price and Time. WARNING: Not suitable for 1M timeframe, you would not see any lines in this frame!
How to Use:
More closer the indicator's value to 0, the price is considered more volatile. When reversal is started, the indicator's value would be rise or fall significantly. During a strong trend, the indicator's value would be closer to 1 or -1, depends on current trend. Entry Signal:
BUY SIGNAL: Indicator crosses 0.2 from
FREE

Aggressive trading robot, be careful over the long term but for a fun account to try to make gains quickly without fear of losing your investment, it can make a profit in a good period. This expert always takes at least two positions in buying and selling. It uses the so-called hedging system to compensate for losses on one side or the other. It can be used with or without indicators for the opening of a trade, it is however more judicious to enter the purchase or the sale with good signals. Tw
FREE

By default Metatrader will show any newly created chart object on all timeframes.
This handy utility will set the visibility of any new chart object drawn to be that of the current chart only.
e.g. If the chart timeframe is H4 then a new object will only be visible on the H4 timeframe.
Each object type can be included or excluded as required and, of course you can change the timeframes setting afterwards as this only operates at the point the chart object is created.
Add to your chart a
FREE

SuperTrend AM - индикатор который позволяет открыть позицию в самом начале значительного движения цены. Вторым важнейшим качеством индикатора является способность максимально долго следовать тренду для получения всей потенциальной прибыли при этом минимизируя потенциальные убытки. Индикатор не перерисовывается и не пересчитывается. Вариант данного индикатора с расширенными возможностями по настройке и уведомлениями о сигналах - SuperTrend 3 .
Сигналы при работе с индикатором: появление красно
FREE

Risklimiter
Limit your risk with this dynamic stop loss indicator. It will show you exactly where to place your initial stop & subsequent stops as the price goes in your favour. Works on any time frame as well as any symbol. It is not restricted in any way nor does it need optimisation. Simply drag and drop on to a chart for it to display a stop loss. You may find at times, it shows a stop on the other side of your trade, this will change as soon as price closes above/below it.
DOES NOT RE
FREE

This indicator shows the realistic and precise trend. The plotted line as a trend indicator is the best secure place to set the stop-loss.
In case that trend is bullish you will see the plotted line under the candles and in the case of the bearish market, the plotted line is on the upper side of candles. Buy paid version of this indicator which it is Statistical Support Resistance .
FREE

Стратегия торговли с полосами Боллинджера и стохастическим осциллятором
Полосы Боллинджера используются в основном для отслеживания тренда.
Использование основной линии стохастика и сигнальной линии для открытия отложенного ордера на покупку или продажу
Советник Auto3M Lite MT4 может работать на VPS.
Pro version MT4
Pro version MT5
Характерная черта
Без мартингейла Жесткий стоп-лосс и тейк-профит для каждой позиции Трейлинг-стоп Удалить отложенный ордер автоматически по интервал
FREE
Одним из стандартных способов определить направление движения цены в конкретный момент является расчет линейной регрессии для значений такой цены за определенный период времени. Данный индикатор отображает на графике цены линию построенную по значениям линейной регрессии выбранной цены за выбранный период времени.
Индикатор максимально прост и может использоваться в рамках любой стратегии торговли.
На полностью сформированных барах индикатор не перерисовывается.
Настройки: Ind_Period - Пер
FREE

Recommended broker to use the indicator: https://tinyurl.com/5ftaha7c Indicator developed by Diogo Sawitzki Cansi to show possible trade points. Do not repaint. The results displayed in the past are exactly what happened. We also use it to hold trades longer and not get out on false reversal signals which are actually just a profit taking of trades and no one is trying to reverse the direction of the trend. Indicator Parameters: PERIOD: Period for analyzing the buying or selling force to fin
FREE

THIS FREE INDICATOR ALLOWS YOU TO SET THE TIMEFRAME OF THE MA YOU WANT ON YOUR CHART For example, it's very useful if you want to trade the H4 200 SMA using a lower timeframe chart, to identify price reactions such as reversals, Wyckoff schematics, etc. ***Please comment, rate and share it to your friends if you like it*** ------------------------------------------------------------------------- Moving averages are popular technical indicators used to identify trends, support and resistance leve
FREE

Indicator support for only: Entry Point to Trend Pro Link indicator support : https://www.mql5.com/en/market/product/70867
Supports all currency pairs declared in the definition. Help investors do not need to open many charts. Notice the DEAL: multiple time frames confluence M15, H1, H4.
Entry Point to Trend Pro The indicator helps investors to identify the earliest and perfect reversal point. Easy to make decision to trade with the trend Price action trading. support resistance
FREE

The Cossover MA Histogram indicator is a simple tool showing the trend based on crossover of moving averages. Simply specify two mobving averages and addicional parameters like MA method and Applied price. When fast MA is above slow MA the histogram is green, indicating an uptrend. When MA fast is below MA slow the histogram is red, indicating an downtrend.
FREE

Long Term trend analyzer according to proprierty Algorithm and multiple EMA. Works best on H1-H4 Time Frame. We are using this indicator in our Main Fund. Ready to use.
- Setup in any Pair, Equity - H1-H4 Timeframe - Best during main Trading times like Asian-European-American Time - NON REPAINTING
Analyze long term trend. Comes with Alarm, Notifications, Push Signals. Get a signal and enter the Markets.
FREE

Traditional RSI is one of the most popular and must-known indicator that every traders would use. In this combination, we use two RSI period with smoothed factor to smooth the RSI lines for better results. Besides, bottom of Indicator is the Trend-filter display in different colors in order to let Traders identify the trends much easier Grey : Sideway market Light-Blue : Weak UP-Trend Blue : Strong UP-Trend Light-Red : Weak DOWN-Trend Red : Strong DOWN-Trend Signal: Blue-Arrow
FREE

A ratio between 0 and 1 with the higher values representing a more efficient or trending market, It is used in the calculation of Perry J. Kaufman Adaptive Moving Average (KAMA), dividing the price change over a period by the absolute sum of the price movements that occurred to achieve that change. The Fractal Efficiency or also known as Efficiency Ratio was first published by Perry J. Kaufman in his book ‘Smarter Trading‘. This is mostly considered a filter for volatile markets none the less
FREE
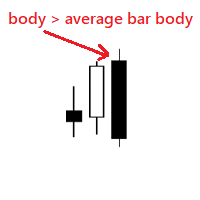
Very simple indicator that shows if body of a new bar is bigger than the average bar body. We can use the indicator to notice bars that are bigger than usual, for example this could mean a new trend. Input params: history bars to display from how many bars to get the average bar body To calculate only bars from the same type distance for the dots bull color bear color dot size
FREE

Support/Resistance Percent Rank
SR Percent Rank helps to see how many times the current close price has been in the past price range. SR Percent makes a loop over x bars into the past and calculates the percentage of times the current closing price has been between the high and the low price in the x bars before that. So we can determine if the current price is moving at supports or resistance that was formed in the past. I use the indicator when creating strategies with the StrategyQuant X p
FREE

Индикатор на основе (Williams` Percent Range) анализирует касания сигнальной линии по стенкам канала и формирует зоны для принятия решения о направлении хода цены. Для удобства встроена функция оповещения. Также можно включать и отключать искомые зоны. На одном графике можно использовать несколько индикаторов с разными настройками. Это поможет подобрать оптимальную стратегию.
FREE
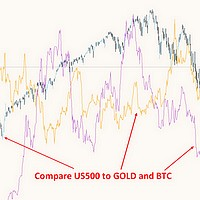
This free MT4 indicator allows you to easily compare as many symbols as you want! Make sure that the input symbol matches the name displayed in the Market Watch ***Please comment, rate and share it to your friends if you like it*** ------------------------------------------------------------------------------ Comparing trading pairs is useful for several reasons, including: Identifying relative strength: Comparing trading pairs can help traders identify which currency or asset is relatively stro
FREE

TrendFinder VolumeI are Colored candlesticks showing the trend based on Volume and Slope of Trend
This indicator will give you the color change on the next bar on the confirmation candle and will never repaint Lime Green = Possible Buy (Volume up), Teal Green = Bullish Weak (Volume Decreasing), Red = Possible Sell (Volume up) , Orange = Bearish Weak (Volume Decreasing)
TrendFinder Volume is optimize to trade on any market and to be used trending and None trending markets. For best results us
FREE

The RSI Basket Currency Strenght brings the RSI indicator to a new level. Expanding the boundaries of TimeFrames and mono-currency analysis, the RSI Multi Time Frame Currency Strenght take the movements of each currency that composes the cross and confront them in the whole basket of 7 crosses. The indicator works with any combination of AUD, CAD, CHF, EUR, GBP, JPY, NZD, USD pairs and with full automation takes in account every RSI value for the selected Time Frame. After that, the indic
FREE

"Trend Guide" - это индикатор, показывающий направление тренда, основанный на быстрой и медленной скользящей средней. Все просто и главное удобно. Параметры индикатора : "_Fast_Moving_Average_Period" - Период быстрой скользящей средней; "_ Slow_Moving_Average_Period" - Период медленной скользящей средней ; "_ MA_SHIFT " - Сдвиг скользящей средней; "_ MA_METHOD " - Метод усреднения; "_ APPLIED_PRICE " - Тип расчета цен; "_ Line_width " - Ш
FREE

[DESCRIPTION] A Simple Moving Average with period 20 that changes color to green when the price is above the moving average and to red when the price is below the moving average. A simple moving average (SMA) calculates the average of a selected range of prices (closing prices), by the number of periods in that range. The SMA is a technical indicator that can aid in determining if an asset price will continue or reverse a bull or bear trend [WARNING AND RECOMMENDATIONS] Trading Forex and
FREE

'Circle Rising Point' is an indicator based on the cycle theory. No matter whether your trading cycle is short or long, you can use this indicator to find the rise and fall points of different cycles and different bands. Therefore, the signals displayed to you on charts of different cycles are different, and applicable to left side transactions. This indicator is recommended to be used together with the multi cycle window for analysis. Indicator introduction Applicable products This indicato
FREE

The WTR Dynamic Range Indicator is a powerful and deeply customizable range indicator that takes in account the average upward and downward movement of the price in the past trading days. This fully customizable indicator can be setted for a lot of uses and cases:
• Trend trading on level breakouts
• Spotting high probability targets for Take Profits
• Setting a multiple targets for position scaling out The WTR Dynamic Range Indicator calculates the average movements in the long side, the
FREE

Данный индикатор находит сильные трендовые движения валютной пары на заданном количестве баров, а также находит коррекцию к этому тренду. Если тренд достаточно сильный, а коррекция становится равной заданной в параметрах, то индикатор сигнализирует об этом. Можно устанавливать разные значения коррекции, лучше подходят значения 38, 50 и 62 (уровни Фибоначчи). Кроме этого, можно настраивать минимальную длину тренда, количество истории баров для поиска и другие параметры.
Параметры History - коли
FREE

Hello all. This indicator helps you to open a trade, when break out occurred, also you can add to your position and ride it if trend continued. I use it on 1-5 min chart, as you can use short stop loss. Also profit target should be small as well. It is better to enter few small position, so you can book some profit early and ride the rest for bigger gains. Look at the past to have a plan. Enjoy.
FREE

Necessary for traders: tools and indicators Waves automatically calculate indicators, channel trend trading Perfect trend-wave automatic calculation channel calculation , MT4 Perfect trend-wave automatic calculation channel calculation , MT5 Local Trading copying Easy And Fast Copy , MT4 Easy And Fast Copy , MT5 Local Trading copying For DEMO Easy And Fast Copy , MT4 DEMO Easy And Fast Copy , MT5 DEMO
Can set the cycle for other varieties of K line graph covered this window, fluctuations obse
FREE
MetaTrader Маркет - единственный магазин, где можно скачать демоверсию торгового робота и подвергнуть его проверке и даже оптимизации на исторических данных.
Прочитайте описание и отзывы других покупателей на заинтересовавший вас продукт, скачайте его прямо в терминал и узнайте, как протестировать торгового робота перед покупкой. Только у нас вы можете получить представление о программе, не заплатив за неё.
Вы упускаете торговые возможности:
- Бесплатные приложения для трейдинга
- 8 000+ сигналов для копирования
- Экономические новости для анализа финансовых рынков
Регистрация
Вход
Если у вас нет учетной записи, зарегистрируйтесь
Для авторизации и пользования сайтом MQL5.com необходимо разрешить использование файлов Сookie.
Пожалуйста, включите в вашем браузере данную настройку, иначе вы не сможете авторизоваться.