Voir comment télécharger gratuitement des robots de trading
Retrouvez-nous sur Facebook !
Rejoignez notre page de fans
Rejoignez notre page de fans
Vous avez aimé le script ? Essayez-le dans le terminal MetaTrader 5
- Vues:
- 25820
- Note:
- Publié:
- 2008.07.21 08:27
- Mise à jour:
- 2016.11.22 07:32
-
Besoin d'un robot ou d'un indicateur basé sur ce code ? Commandez-le sur Freelance Aller sur Freelance
Description:

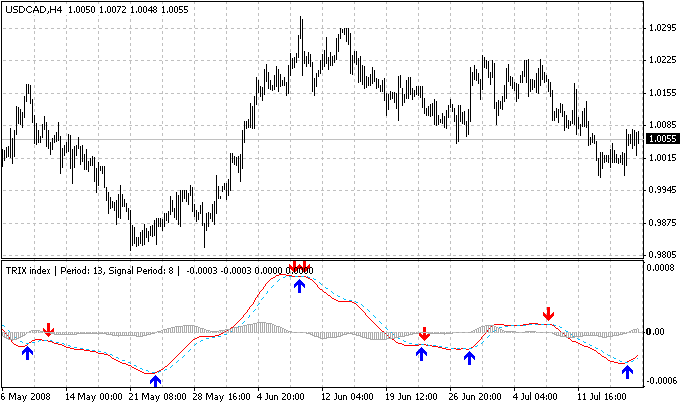
The Trix EA is based on the Trix indicator created by raff1410, it is for H4 timeframe.
You have to put the Trix_EA.mq4 in the "experts" file and the two other mq4 in the "indicators" file.

Recommendations:
Test first on demo.
Strategy Tester Report
Trix_EA
InterbankFX-Demo Accounts (Build 217)
| Symbole | USDCAD (US Dollar vs Canadian Dollar) | ||||
| Periode | 4 Heures (H4) 2008.06.29 20:00 - 2008.07.18 16:00 (2008.06.29 - 2008.07.30) | ||||
| Modele | Chaque tick (la méthode la plus précise, basée sur tous les moindres relevés disponibles) | ||||
| Parametres | Lots=2.8; StopLoss=50; TakeProfit=0; TradeAtCloseBar=true; TrailingStop=0; TrailingStep=1; BreakEven=0; MagicNumber=0; Repeat=3; Periods=5; UseAlert=false; SendEmail=true; TradeLog="Trix_EA"; Slippage=3; Indicator_Setting="---------- Indicator Setting"; TimeFrame=0; TRIX_Period=13; Signal_Period=8; Signals=true; CountBars=1500; | ||||
| Bars en test | 1090 | Ticks modelés | 64823 | Qualité du modelage | 90.00% |
| Erreurs des graphiques désaccordés | 0 | ||||
| Dépot initial | 10000.00 | ||||
| Profit total net | 7000.14 | Profit brut | 7000.14 | Perte brute | 0.00 |
| Facteur de profit | Rémunération espérée | 2333.38 | |||
| Chute absolue | 1029.72 | Chute maximal (%) | 4115.05 (29.83%) | Enfoncement relatif | 29.83% (4115.05) |
| Total des Trades | 3 | Positions SHORT (vente) gagnées % | 1 (100.00%) | Positions LONG (achat) gagnées % | 2 (100.00%) |
| Profits des Trades (% du total) | 3 (100.00%) | Pertes des Trades (% du total) | 0 (0.00%) | ||
| Le plus large | gains par Trade | 4280.68 | pertes par Trade | 0.00 | |
| Average (moyenne) | gains par Trade | 2333.38 | pertes par Trade | 0.00 | |
| Maximum | gains consecutifs (profit en $) | 3 (7000.14) | pertes consecutives (perte en $) | 0 (0.00) | |
| Maximal | Gains consecutifs (coups gagnants) | 7000.14 (3) | Pertes consecutives (coups perdants) | 0.00 (0) | |
| Average (moyenne) | gains consecutifs | 3 | Pertes consecutives | 0 | |

| # | Date exécution | Transaction | Ordre | Volume | Prix | S/L (Stop/Perte) | T/P (Prendre/profit) | Profit | Balance |
| 1 | 2008.06.30 04:00 | buy | 1 | 2.80 | 1.0098 | 1.0048 | 0.0000 | ||
| 2 | 2008.07.07 04:05 | close | 1 | 2.80 | 1.0197 | 1.0048 | 0.0000 | 2663.77 | 12663.77 |
| 3 | 2008.07.08 16:00 | sell | 2 | 2.80 | 1.0204 | 1.0254 | 0.0000 | ||
| 4 | 2008.07.18 00:04 | close | 2 | 2.80 | 1.0052 | 1.0254 | 0.0000 | 4280.68 | 16944.45 |
| 5 | 2008.07.18 00:04 | buy | 3 | 2.80 | 1.0053 | 1.0003 | 0.0000 | ||
| 6 | 2008.07.18 19:58 | close at stop | 3 | 2.80 | 1.0055 | 1.0003 | 0.0000 | 55.69 | 17000.14 |
 SuperTrend
The SuperTrend indicator developed for MetaTrader 4 based on the ProRealTime version.
 DoubleCCI_Woodies
A two CCI with the coloured trend bars
 AutoDayFibs
Automatically draws Fibonacci Retracement lines from yesterday's range, or today's range.
 Rads MACD
The Rads MACD indicator.
